


Tuesday, 1 December 2009 - Monthly Climate Summary for Victoria - Product code IDCKGC26R0
Victoria in November 2009:
Record heatwave early in month, then cooler and wet.
An exceptionally prolonged heatwave has affected large parts of Victoria during November 2009, resulting in the month being the hottest November on record for many areas. Temperatures well above average began to influence much of the region on the weekend of 7-8 November. The hot spell continued largely unbroken, except in the south, until 15 November. Slightly cooler conditions then prevailed on 16-17 November, before the heat returned from the 18th, with the highest temperatures of the whole event between November 18 and 20. The most intense heat of the event broke down across Victoria from the 20th onwards as a trough crossed the region, bringing widespread substantial rain on the 21st and 22nd. Conditions were relatively cool after that, with temperatures mostly close to normal through the last week of the month.
The first stage of the event, broadly from 7-15 November, was more exceptional for its duration than its intensity. Few records were set for individual high temperatures, but many were set for the number of consecutive days above high temperature thresholds such as 35 or 40°C. Prolonged hot spells are rare in November, compared with summer and early autumn, in southern Australia for a number of reasons; most significantly, that the subtropical high pressure belt is normally much further north in November than it is between December and March, allowing frontal systems to influence the southern continent on a regular basis instead of passing to the south as is more typical later in the summer. Individual November record high temperatures became much more widespread in the second stage of the event, from the 18th onwards.
As a result of the prolonged heatwave, mean monthly temperatures, both maxima and minima, were exceptionally high over much of south-eastern Australia. The mean monthly temperature for Victoria was 4.36°C above normal, breaking the previous record. The duration of this event was exceptional, especially in parts of western Victoria, with records for consecutive days above 30°C set in northern and western Victoria (e.g. Nhill, Bendigo, Kerang). Melbourne missed out on equalling its November record of six consecutive days above 30°C when the temperature peaked at 29.8°C on the 12th.
Monthly mean maximum temperatures were at least 5°C above normal over most of Victoria, except for the coastal fringe. Overnight minimum temperatures were slightly less extreme, but still 4 to 6°C over much of northern Victoria.
Monthly mean temperature anomalies were well beyond anything previously experienced in the historical record, Victoria's mean temperature anomaly being +4.36°C. In Victoria, November was hotter than a normal January, and Victoria’s mean monthly temperature of 20.39°C has been surpassed by only one December (1994).
Records were also set for maximum temperatures, with Victoria (+4.92°C). The set of records was completed by minimum temperatures, with Victoria (+3.81°C). The Victorian anomalies were records for any month.
At the station level, 136 long-term Australian stations had their highest mean maximum temperature on record for November, and 118 had their highest mean minimum temperature. Of these stations, 80 had their largest monthly maximum temperature anomaly on record for any month, and 49 their largest monthly minimum temperature anomaly. Maximum temperature records covered 16% of Australia, including all of Victoria, while minimum temperature records covered 9% of Australia, including 88% of Victoria.
Despite more moderate conditions in September and October, the exceptional November was sufficient to lift mean spring temperatures to record levels in Victoria.
Synoptic Patterns
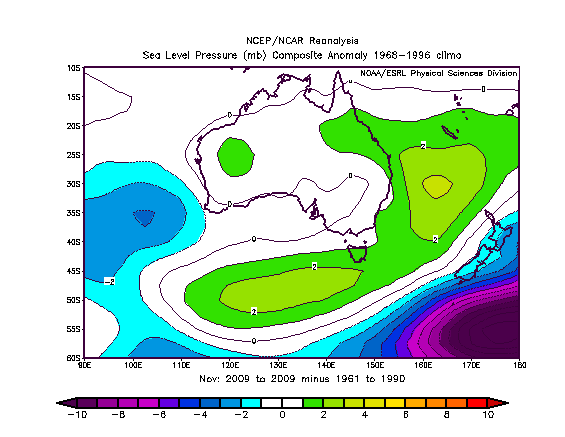
The main feature of synoptic patterns during the month is reflected in the pattern of Mean Sea Level Pressure (MSLP) anomalies (shown below). An anomalous ridge of high pressure prevailed over an area extending from the Tasman Sea to the south of Tasmania. This feature directed very warm air from the north and northeast across the State.
Details Extremes Records Summaries Important notes the top
Rainfall
Some sites had their highest total November rainfall on record.
Some sites had their highest total November rainfall for at least 20 years.
Some sites had their lowest total November rainfall on record.
Temperature
Some sites had their highest November temperature on record.
Some sites had their highest November mean daily maximum temperature on record.
Some sites had their highest November mean daily maximum temperature for at least 20 years.
Minimum temperature
Some sites had their warmest November night (highest daily minimum temperature) on record.
Some sites had their highest November mean daily minimum temperature on record.
Some sites had their highest November mean daily minimum temperature for at least 20 years.
Further information
- Media
- media@bom.gov.au (03) 9669 4057
- Enquiries
- helpdesk.climate@bom.gov.au
| Extremes in November 2009 | |
|---|---|
| Hottest day | 42.1 °C at Mildura Airport on the 18th |
| Warmest days on average |
32.5 °C at Mildura Airport 32.5 °C at Walpeup Research |
| Coolest days on average | 15.5 °C at Mount Hotham |
| Coldest day | 4.6 °C at Mount Hotham on the 30th |
| Coldest night | -1.7 °C at Mount Baw Baw on the 23rd |
| Coolest nights on average | 7.8 °C at Mount Hotham |
| Warmest nights on average | 17.3 °C at Mildura Airport |
| Warmest night |
28.1 °C at Melbourne CBD on the 19th 26.9 °C at Mildura Airport on the 20th |
| Wettest overall | 191.0 mm at Cudgewa Ck @ Berringama |
| Highest wind gust | 126 km/h at Wilsons Promontory Lighthouse on the 3rd |
Details Extremes Records Summaries Important notes the top
| Record highest total November rainfall | |||||
|---|---|---|---|---|---|
|
Total rainfall for November 2009 (mm) |
Previous highest for November |
Years of record |
Average for November |
||
| Warracknabeal Museum | 89.0 | 76.8 | in 1976 | 41 | 31.7 |
| Highest total November rainfall for at least 20 years | |||||
|---|---|---|---|---|---|
|
Total rainfall for November 2009 (mm) |
Most recent higher for November |
Years since higher |
Average for November |
||
| Wedderburn (Post Office) | 95.0 | 155.6 | in 1887 | 121 | 33.5 |
| St Arnaud | 112.2 | 115.6 | in 1903 | 104 | 35.4 |
| Natte Yallock | 95.0 | 116.2 | in 1924 | 85 | 33.7 |
| Woomelang | 100.4 | 114.7 | in 1924 | 85 | 27.8 |
| Maryborough | 100.6 | 134.1 | in 1933 | 76 | 39.2 |
| Daylesford | 138.6 | 156.5 | in 1952 | 56 | 60.9 |
| Trentham (Post Office) | 173.6 | 177.6 | in 1960 | 49 | 74.9 |
| Beulah | 81.2 | 95.3 | in 1960 | 46 | 29.5 |
| Korong Vale (Burnbank) | 82.6 | 85.4 | in 1965 | 44 | 33.5 |
| Werrimull | 67.0 | 100.9 | in 1961 | 43 | 23.4 |
| Yanac North | 75.8 | 76.0 | in 1970 | 39 | 29.4 |
| Kaniva | 71.4 | 97.3 | in 1970 | 38 | 32.2 |
| Jeparit | 68.0 | 68.2 | in 1976 | 32 | 28.6 |
| Ballarat Aerodrome | 113.0 | 131.1 | in 1978 | 31 | 55.8 |
| Bannockburn | 108.2 | 145.6 | in 1978 | 31 | 48.3 |
| Clunes | 99.8 | 100.4 | in 1978 | 31 | 45.7 |
| Horsham Polkemmet Rd | 57.6 | 72.6 | in 1983 | 26 | 33.7 |
| Melbourne Airport | 115.0 | 158.0 | in 1988 | 20 | 61.0 |
| Patchewollock | 56.8 | 68.8 | in 1988 | 20 | 25.7 |
| Record highest November temperature | ||||||
|---|---|---|---|---|---|---|
|
Highest temperature in November 2009 (°C) |
Previous highest for November |
Years of record |
Average for November |
|||
| Tatura Inst Sustainable Ag | 40.3 | on the 19th | = 40.3 | on the 20th in 2007 | 45 | 24.5 |
| Lake Eildon | 38.9 | on the 19th | 38.6 | on the 24th in 1982 | 40 | 23.2 |
| Strathbogie | 37.2 | on the 19th | 37.0 | on the 24th in 1982 | 31 | 21.3 |
| Morwell (Latrobe Valley Airport) | 38.6 | on the 20th | 38.0 | on the 21st in 2006 | 25 | 21.6 |
| Edi Upper | 39.2 | on the 19th | 37.0 | on the 26th in 1997 | 24 | 23.4 |
| Mount Buller | 26.1 | on the 19th | 24.1 | on the 20th in 2007 | 23 | 12.0 |
| Wangaratta Aero | 41.4 | on the 19th | 41.0 | on the 26th in 1997 | 23 | 25.4 |
| Record highest November mean daily maximum temperature | |||||
|---|---|---|---|---|---|
|
Mean daily maximum temperature for November 2009 (°C) |
Previous highest for November |
Years of record |
Average for November |
||
| Melbourne Regional Office | 27.1 | 25.5 | in 1862 | 154 | 21.9 |
| Horsham Polkemmet Rd | 31.2 | 31.0 | in 1902 | 101 | 24.7 |
| Ballarat Aerodrome | 25.1 | 24.9 | in 1982 | 100 | 19.5 |
| Kerang | 31.7 | 31.2 | in 1914 | 99 | 26.6 |
| Rutherglen Research | 30.8 | 30.1 | in 1914 | 96 | 25.2 |
| Longerenong | 30.9 | 29.2 | in 1982 | 75 | 24.5 |
| Ouyen (Post Office) | 32.4 | 31.7 | in 1982 | 72 | 27.2 |
| Orbost (Comparison) | 26.3 | 24.7 | in 1982 | 70 | 21.5 |
| Laverton RAAF | 25.8 | 25.2 | in 1982 | 66 | 21.4 |
| East Sale Airport | 25.9 | 25.3 | in 1982 | 64 | 21.2 |
| Mildura Airport | 32.5 | 31.5 | in 1982 | 63 | 27.4 |
| Walpeup Research | 32.5 | 31.2 | in 1982 | 59 | 26.6 |
| Casterton Showgrounds | 27.5 | 26.3 | in 1982 | 49 | 21.7 |
| Scoresby Research Institute | 26.2 | 25.1 | in 1982 | 49 | 21.2 |
| Tatura Inst Sustainable Ag | 30.0 | 28.7 | in 1982 | 44 | 24.5 |
| Kyabram DPI | 31.4 | 29.5 | in 1982 | 42 | 24.8 |
| Ararat Prison | 27.1 | 26.4 | in 1982 | 40 | 21.2 |
| Essendon Airport | 26.8 | 24.4 | in 2005 | 39 | 21.5 |
| Lake Eildon | 28.8 | 27.4 | in 1982 | 39 | 23.2 |
| Melbourne Airport | 26.8 | 26.2 | in 1982 | 39 | 21.7 |
| Wonthaggi | 23.8 | 22.1 | in 2005 | 39 | 19.8 |
| Moorabbin Airport | 25.7 | 24.9 | in 1982 | 38 | 21.4 |
| Warracknabeal Museum | 31.2 | 30.1 | in 1982 | 37 | 25.6 |
| Bairnsdale Airport | 26.1 | 24.3 | in 1997 | 29 | 21.5 |
| Weeaproinah | 21.0 | 19.1 | in 1982 | 28 | 16.0 |
| Portland (Cashmore Airport) | 22.3 | 20.9 | in 1982 | 27 | 18.4 |
| Hamilton Airport | 26.7 | 23.4 | in 2006 | 26 | 20.6 |
| Noojee (Slivar) | 25.4 | 24.2 | in 1982 | 26 | 20.5 |
| Bundoora (Latrobe University) | 27.2 | 26.0 | in 1982 | 25 | 22.2 |
| Morwell (Latrobe Valley Airport) | 27.0 | 24.4 | in 2005 | 24 | 21.6 |
| Mount Buller | 16.8 | 14.7 | in 2006 | 22 | 12.0 |
| Wangaratta Aero | 30.6 | 29.2 | in 2002 | 22 | 25.4 |
| Beechworth Woolshed | 29.4 | 27.7 | in 2007 | 20 | 24.3 |
| Highest November mean daily maximum temperature for at least 20 years | |||||
|---|---|---|---|---|---|
|
Mean daily maximum temperature for November 2009 (°C) |
Most recent higher for November |
Years since higher |
Average for November |
||
| Gabo Island Lighthouse | 21.7 | 22.4 | in 1894 | 115 | 18.3 |
| Wilsons Promontory Lighthouse | 20.3 | 20.6 | in 1901 | 108 | 17.1 |
| Echuca Aerodrome | 31.5 | 32.1 | in 1902 | 107 | 26.0 |
| Cape Otway Lighthouse | 20.8 | 22.4 | in 1907 | 102 | 18.3 |
| Maryborough | 28.9 | 29.4 | in 1902 | 99 | 23.6 |
| Mangalore Airport | 30.0 | 30.1 | in 1982 | 27 | 24.2 |
| Castlemaine Prison | 27.6 | 27.7 | in 1982 | 24 | 22.5 |
| Dartmouth Reservoir | 27.9 | 28.7 | in 1982 | 22 | 23.7 |
| Strathbogie | 26.2 | 26.4 | in 1982 | 22 | 21.3 |
| Record highest November daily minimum temperature | ||||||
|---|---|---|---|---|---|---|
|
Highest daily minimum temperature in November 2009 (°C) |
Previous highest for November |
Years of record |
Average for November |
|||
| Kerang | 25.5 | on the 20th | 24.7 | on the 27th in 1997 | 46 | 11.2 |
| Kyabram DPI | 21.2 | on the 20th | 21.1 | on the 3rd in 2005 | 43 | 10.1 |
| Walpeup Research | 26.1 | on the 20th | 25.4 | on the 30th in 1982 | 42 | 11.2 |
| Warracknabeal Museum | 25.0 | on the 20th | 24.2 | on the 13th in 2008 | 38 | 10.0 |
| Weeaproinah | 21.2 | on the 20th | = 21.2 | on the 2nd in 1987 | 29 | 8.1 |
| Portland (Cashmore Airport) | 18.7 | on the 20th | 18.1 | on the 30th in 2003 | 28 | 9.7 |
| Mount Buller | 18.8 | on the 20th | 17.9 | on the 26th in 1997 | 23 | 4.4 |
28.1 °C at Melbourne CBD on the 19th was the highest overnight minimum temperature on record.
| Record highest November mean daily minimum temperature | |||||
|---|---|---|---|---|---|
|
Mean daily minimum temperature for November 2009 (°C) |
Previous highest for November |
Years of record |
Average for November |
||
| Melbourne Regional Office | 15.9 | 15.2 | in 2000 | 154 | 11.1 |
| Wilsons Promontory Lighthouse | 14.0 | 13.8 | in 2000 | 130 | 11.2 |
| Gabo Island Lighthouse | 15.3 | 15.1 | in 2000 | 126 | 12.7 |
| Maryborough | 13.6 | 12.2 | in 2000 | 102 | 9.4 |
| Ballarat Aerodrome | 11.2 | 10.7 | in 2000 | 100 | 7.7 |
| Kerang | 15.7 | 14.7 | in 1914 | 99 | 11.2 |
| Longerenong | 12.5 | 11.4 | in 2000 | 76 | 8.9 |
| Ouyen (Post Office) | 16.3 | 14.6 | in 2000 | 72 | 11.4 |
| Laverton RAAF | 13.8 | 13.2 | in 2000 | 66 | 10.0 |
| East Sale Airport | 12.0 | = 12.0 | in 2000 | 64 | 9.5 |
| Mildura Airport | 17.3 | 15.1 | in 2000 | 63 | 12.4 |
| Walpeup Research | 15.9 | 14.4 | in 2000 | 59 | 11.2 |
| Scoresby Research Institute | 13.3 | 13.2 | in 2000 | 50 | 10.2 |
| Casterton Showgrounds | 11.9 | = 11.9 | in 2000 | 49 | 8.8 |
| Mangalore Airport | 13.6 | 12.9 | in 2000 | 49 | 9.8 |
| Tatura Inst Sustainable Ag | 13.7 | 13.4 | in 2000 | 44 | 10.1 |
| Kyabram DPI | 14.5 | 13.3 | in 2000 | 42 | 10.1 |
| Ararat Prison | 11.3 | 10.4 | in 2007 | 40 | 7.6 |
| Castlemaine Prison | 13.6 | 11.7 | in 2000 | 40 | 9.0 |
| Point Hicks (Lighthouse) | 15.1 | 14.8 | in 2000 | 40 | 12.6 |
| Essendon Airport | 14.1 | 12.7 | in 2007 | 39 | 9.7 |
| Lake Eildon | 13.2 | 12.1 | in 2000 | 39 | 9.1 |
| Melbourne Airport | 13.8 | 13.1 | in 2000 | 39 | 10.2 |
| Wonthaggi | 12.8 | 12.7 | in 2000 | 39 | 10.2 |
| Moorabbin Airport | 13.8 | 13.5 | in 2000 | 38 | 10.9 |
| Warracknabeal Museum | 14.4 | 13.4 | in 1990 | 37 | 10.0 |
| Dartmouth Reservoir | 13.0 | 12.7 | in 2000 | 29 | 9.5 |
| Strathbogie | 10.6 | 10.5 | in 2000 | 29 | 7.3 |
| Weeaproinah | 11.9 | 10.7 | in 2000 | 28 | 8.1 |
| Portland (Cashmore Airport) | 12.3 | 11.9 | in 2000 | 27 | 9.7 |
| Hamilton Airport | 11.6 | 10.3 | in 2000 | 26 | 7.9 |
| Noojee (Slivar) | 11.4 | 10.9 | in 2000 | 26 | 8.3 |
| Bundoora (Latrobe University) | 14.0 | 13.4 | in 2000 | 25 | 10.5 |
| Mount Buller | 8.9 | 7.2 | in 2007 | 22 | 4.4 |
| Highest November mean daily minimum temperature for at least 20 years | |||||
|---|---|---|---|---|---|
|
Mean daily minimum temperature for November 2009 (°C) |
Most recent higher for November |
Years since higher |
Average for November |
||
| Cape Otway Lighthouse | 13.5 | 14.0 | in 1897 | 111 | 10.6 |
| Echuca Aerodrome | 14.8 | 15.0 | in 1914 | 95 | 11.1 |
| Rutherglen Research | 13.1 | 14.4 | in 1914 | 94 | 8.6 |
| Horsham Polkemmet Rd | 11.8 | 11.9 | in 1966 | 38 | 9.4 |
Details Extremes Records Summaries Important notes the top
| Summary statistics for November 2009 | ||||||||||||
|---|---|---|---|---|---|---|---|---|---|---|---|---|
| Maximum temperatures for November (°C) |
Minimum temperatures for November (°C) |
Rainfall for November (millimetres) |
||||||||||
| Mean for November 2009 |
Diff from average |
Highest for November 2009 |
Mean for November 2009 |
Diff from average |
Lowest for November 2009 |
Total for November 2009 |
Average for November |
Rank of November 2009 |
Fraction of November average |
|||
| North Mallee (district 76) | ||||||||||||
| Mildura Airport | 32.5 | +5.1 | 42.1 | 18th | 17.3 | +4.8 | 8.3 | 5th | 63.2 | 25.0 | v high | 253% |
| Ouyen (Post Office) | 32.4 | +5.1 | 41.9 | 19th | 16.3 | +4.9 | 6.6 | 5th | 68.4 | 27.9 | v high | 245% |
| Walpeup Research | 32.5 | +5.9 | 41.8 | 12th | 15.9 | +4.7 | 5.5 | 5th | 54.2 | 27.4 | high | 198% |
| South Mallee (district 77) | ||||||||||||
| Hopetoun Airport | 32.4 | 41.6 | 11th | 14.7 | 5.6 | 4th | 88.0 | |||||
| Swan Hill Aerodrome | 32.3 | +4.6 | 41.7 | 19th | 15.6 | +4.2 | 6.7 | 5th | 79.6 | 48.2 | high | 165% |
| North Wimmera (district 78) | ||||||||||||
| Nhill Aerodrome | 31.0 | 39.8 | 15th | 13.7 | 4.2 | 6th | 69.0 | |||||
| Warracknabeal Museum | 31.2 | +5.7 | 40.2 | 19th | 14.4 | +4.4 | 5.6 | 4th | 89.0 | 31.7 | highest | 281% |
| South Wimmera (district 79) | ||||||||||||
| Edenhope Airport | 28.5 | 37.2 | 19th | 12.8 | 4.0 | 6th | 36.8 | |||||
| Grampians (Mount William) | 19.8 | 28.5 | 19th | 10.8 | 1.5 | 4th | 81.0 | |||||
| Horsham Aerodrome | 30.4 | +4.5 | 39.1 | 11th | 11.9 | +3.7 | 2.7 | 6th | 61.8 | 31.9 | v high | 194% |
| Horsham Polkemmet Rd | 31.2 | +6.4 | 40.2 | 11th | 11.8 | +2.4 | 2.2 | 6th | 57.6 | 33.7 | high | 171% |
| Kanagulk | 29.1 | 37.9 | 19th | 11.7 | 4.0 | 6th | 41.8 | |||||
| Longerenong | 30.9 | +6.4 | 39.4 | 14th | 12.5 | +3.6 | 4.1 | 4th | 62.4 | 30.8 | high | 203% |
| Pyrenees (Ben Nevis) | 23.0 | 32.7 | 10th | 12.7 | 3.5 | 4th | 105.4 | |||||
| Stawell Aerodrome | 28.7 | +5.3 | 37.8 | 11th | 13.3 | +3.9 | 7.0 | 23rd | 80.6 | 45.0 | high | 179% |
| Lower North (district 80) | ||||||||||||
| Charlton | 32.0 | 41.1 | 11th | 14.4 | 5.3 | 6th | 89.4 | |||||
| Echuca Aerodrome | 31.5 | +5.5 | 41.1 | 19th | 14.8 | +3.7 | 8.0 | 4th | 52.0 | 32.6 | high | 160% |
| Kerang | 31.7 | +5.1 | 41.4 | 11th | 15.7 | +4.5 | 7.5 | 5th | 98.4 | 29.5 | v high | 334% |
| Kyabram DPI | 31.4 | +6.6 | 41.8 | 19th | 14.5 | +4.4 | 6.2 | 4th | 80.2 | 38.1 | v high | 210% |
| Upper North (district 81) | ||||||||||||
| Bendigo Airport | 29.8 | +5.8 | 38.8 | 19th | 13.9 | +4.6 | 6.7 | 5th | 61.0 | 45.3 | average | 135% |
| Shepparton Airport | 31.2 | +5.5 | 41.2 | 19th | 14.1 | +3.9 | 7.4 | 6th | 62.6 | 53.9 | average | 116% |
| Tatura Inst Sustainable Ag | 30.0 | +5.6 | 40.3 | 19th | 13.7 | +3.6 | 7.2 | 5th | 65.4 | 40.2 | high | 163% |
| Yarrawonga | 32.1 | +5.4 | 42.0 | 19th | 15.0 | +4.2 | 7.1 | 5th | 57.2 | 43.2 | high | 132% |
| Lower Northeast (district 82) | ||||||||||||
| Beechworth Woolshed | 29.4 | +5.1 | 39.1 | 19th | 11.9 | +3.6 | 2.4 | 5th | 90.4 | 59.6 | high | 152% |
| Benalla Airport | 30.4 | 41.1 | 19th | 13.4 | 6.5 | 6th | 61.3 | |||||
| Corryong Airport | 29.4 | 34.4 | 15th | 11.7 | 3.1 | 5th | 65.4 | |||||
| Dartmouth Reservoir | 27.9 | +4.2 | 35.1 | 19th | 13.0 | +3.5 | 7.5 | 6th | 77.0 | 66.7 | high | 115% |
| Hunters Hill | 24.0 | +4.7 | 31.2 | 19th | 14.3 | +4.7 | 7.2 | 5th | 72.6 | 91.2 | average | 80% |
| Rutherglen Research | 30.8 | +5.5 | 40.6 | 19th | 13.1 | +4.5 | 4.6 | 5th | 64.2 | 44.8 | high | 143% |
| Strathbogie | 26.2 | +4.9 | 37.2 | 19th | 10.6 | +3.3 | 3.6 | 6th | 66.2 | 63.8 | average | 104% |
| Wangaratta Aero | 30.6 | +5.3 | 41.4 | 19th | 12.3 | +3.1 | 5.3 | 6th | 56.8 | 54.4 | average | 104% |
| Upper Northeast (district 83) | ||||||||||||
| Dinner Plain (Mount Hotham Airport) | 21.4 | 29.5 | 20th | 8.7 | -0.3 | 23rd | 82.4 | 85.1 | average | 97% | ||
| Falls Creek | 17.1 | +4.9 | 23.4 | 19th | 8.5 | +4.7 | 0.7 | 5th | 146.6 | 120.5 | average | 122% |
| Mount Buller | 16.8 | +4.8 | 26.1 | 19th | 8.9 | +4.5 | -0.4 | 4th | 137.8 | 123.3 | average | 112% |
| Mount Hotham | 15.5 | +4.6 | 22.9 | 20th | 7.8 | +4.3 | -0.5 | 5th | 184.4 | 131.8 | average | 140% |
| Omeo | 25.6 | 34.2 | 19th | 10.1 | 2.1 | 6th | 60.6 | |||||
| East Gippsland (district 84) | ||||||||||||
| Combienbar AWS | 26.3 | +5.8 | 36.6 | 19th | 13.8 | +4.3 | 6.7 | 5th | 45.8 | 114.2 | v low | 40% |
| Gabo Island Lighthouse | 21.7 | +3.3 | 29.1 | 20th | 15.3 | +2.6 | 11.3 | 6th | 38.2 | 72.8 | low | 52% |
| Gelantipy | 24.2 | +5.5 | 34.1 | 20th | 11.6 | +4.0 | 5.2 | 6th | 89.8 | 99.7 | average | 90% |
| Lakes Entrance (Eastern Beach Road) | 23.6 | 37.9 | 19th | 13.5 | 6.6 | 6th | 23.0 | |||||
| Mallacoota | 24.7 | +4.5 | 37.0 | 20th | 14.2 | +2.6 | 8.8 | 6th | 38.0 | 86.7 | low | 44% |
| Mount Nowa Nowa | 25.4 | +4.8 | 37.4 | 19th | 14.3 | +3.8 | 7.7 | 6th | 64.8 | 86.6 | average | 75% |
| Orbost | 25.8 | 39.8 | 19th | 13.3 | 5.8 | 6th | 55.0 | 80.0 | low | 69% | ||
| Orbost (Comparison) | 26.3 | +4.8 | 39.6 | 19th | 12.2 | +2.0 | 4.2 | 6th | 52.0 | 72.5 | average | 72% |
| Point Hicks (Lighthouse) | 24.3 | +4.2 | 35.0 | 20th | 15.1 | +2.5 | 11.0 | 6th | 49.4 | 80.4 | average | 61% |
| West Gippsland (district 85) | ||||||||||||
| Bairnsdale Airport | 26.1 | +4.7 | 38.8 | 19th | 12.1 | +2.7 | 4.4 | 6th | 44.0 | 82.0 | low | 54% |
| East Sale Airport | 25.9 | +4.8 | 36.2 | 20th | 12.0 | +2.5 | 6.3 | 6th | 41.2 | 62.7 | average | 66% |
| Morwell (Latrobe Valley Airport) | 27.0 | +5.4 | 38.6 | 20th | 11.5 | +2.1 | 3.8 | 6th | 67.4 | 75.0 | average | 90% |
| Mount Moornapa | 26.0 | +5.3 | 37.4 | 20th | 13.6 | +4.0 | 6.9 | 5th | 83.2 | 116.7 | average | 71% |
| Noojee (Slivar) | 25.4 | +4.9 | 35.0 | 20th | 11.4 | +3.1 | 5.1 | 6th | 67.4 | 100.3 | low | 67% |
| Pound Creek | 23.2 | 34.9 | 20th | 11.2 | 1.9 | 6th | 66.4 | |||||
| Wilsons Promontory Lighthouse | 20.3 | +3.1 | 33.6 | 20th | 14.0 | +2.8 | 10.1 | 4th | 79.2 | 70.9 | average | 112% |
| Yarram Airport | 24.9 | 38.2 | 20th | 10.8 | 0.6 | 6th | 73.6 | |||||
| East Central (district 86) | ||||||||||||
| Bundoora (Latrobe University) | 27.2 | +5.0 | 38.0 | 20th | 14.0 | +3.5 | 5.7 | 6th | 101.4 | 68.2 | high | 149% |
| Cerberus | 23.9 | +3.8 | 36.8 | 20th | 12.4 | +2.0 | 8.3 | 7th | 86.2 | 51.1 | high | 169% |
| Coldstream | 26.5 | +4.2 | 35.4 | 20th | 11.5 | +3.1 | 2.3 | 6th | 58.6 | 67.0 | average | 87% |
| Coldstream Comparison | 26.8 | 35.6 | 20th | 11.4 | 2.3 | 6th | 58.6 | |||||
| Cranbourne Botanic Gardens | 24.6 | +3.8 | 35.9 | 20th | 12.3 | +2.1 | 5.6 | 6th | 82.4 | 72.6 | average | 113% |
| Essendon Airport | 26.8 | +5.3 | 38.1 | 20th | 14.1 | +4.4 | 7.4 | 6th | 97.0 | 57.8 | high | 168% |
| Ferny Creek (Dunns Hill) | 22.5 | +4.8 | 31.6 | 20th | 12.3 | +3.5 | 2.3 | 30th | 114.2 | 103.2 | high | 111% |
| Frankston AWS | 24.1 | +4.2 | 33.4 | 10th | 14.8 | +2.9 | 9.3 | 6th | ||||
| Melbourne Airport | 26.8 | +5.1 | 38.0 | 20th | 13.8 | +3.6 | 6.8 | 6th | 115.0 | 61.0 | v high | 189% |
| Melbourne Regional Office | 27.1 | +5.2 | 38.3 | 20th | 15.9 | +4.7 | 9.4 | 6th | 100.2 | 59.7 | high | 168% |
| Moorabbin Airport | 25.7 | +4.3 | 37.4 | 20th | 13.8 | +2.9 | 6.2 | 6th | 81.8 | 61.8 | high | 132% |
| Rhyll | 23.1 | +3.4 | 33.3 | 20th | 14.5 | +2.5 | 10.1 | 4th | 65.2 | 56.4 | average | 116% |
| Scoresby Research Institute | 26.2 | +5.0 | 36.4 | 20th | 13.3 | +3.1 | 4.9 | 6th | 112.8 | 80.6 | high | 140% |
| Viewbank (ARPANSA) | 27.8 | +3.7 | 38.4 | 20th | 13.8 | 5.2 | 6th | 117.4 | ||||
| Wallan (Kilmore Gap) | 24.8 | +5.7 | 34.2 | 20th | 12.6 | +4.0 | 4.8 | 6th | 88.0 | 64.3 | high | 137% |
| Wonthaggi | 23.8 | +4.1 | 35.6 | 20th | 12.8 | +2.6 | 5.0 | 6th | 72.6 | 69.2 | average | 105% |
| West Central (district 87) | ||||||||||||
| Avalon Airport | 25.7 | +3.7 | 37.8 | 20th | 12.7 | +2.3 | 7.6 | 6th | 80.2 | 44.6 | high | 180% |
| Grovedale (Geelong Airport) | 25.0 | +4.5 | 34.9 | 9th | 11.2 | +1.8 | 4.8 | 6th | 90.4 | 51.4 | high | 176% |
| Laverton RAAF | 25.8 | +4.4 | 38.3 | 20th | 13.8 | +3.7 | 7.7 | 4th | 78.6 | 51.4 | high | 153% |
| Sheoaks | 26.0 | +5.5 | 35.5 | 11th | 11.8 | +3.1 | 2.0 | 6th | 103.4 | 63.4 | high | 163% |
| North Central (district 88) | ||||||||||||
| Castlemaine Prison | 27.6 | +5.1 | 36.4 | 19th | 13.6 | +4.6 | 6.5 | 4th | 85.0 | 46.4 | v high | 183% |
| Eildon Fire Tower | 25.7 | +5.2 | 36.2 | 19th | 13.5 | +4.2 | 5.1 | 5th | 58.0 | 50.9 | average | 114% |
| Lake Eildon | 28.8 | +5.5 | 38.9 | 19th | 13.2 | +4.1 | 5.9 | 6th | 63.0 | 67.2 | average | 94% |
| Mangalore Airport | 30.0 | +5.8 | 40.5 | 19th | 13.6 | +3.8 | 7.5 | 4th | 55.6 | 46.4 | high | 120% |
| Maryborough | 28.9 | +5.3 | 37.6 | 11th | 13.6 | +4.2 | 5.2 | 6th | 100.6 | 39.2 | v high | 257% |
| Redesdale | 28.4 | +5.4 | 38.4 | 19th | 12.1 | +4.0 | 5.1 | 5th | 75.6 | 40.4 | high | 187% |
| Western Plains (district 89) | ||||||||||||
| Ararat Prison | 27.1 | +6.0 | 36.1 | 19th | 11.3 | +3.7 | 3.3 | 6th | 71.6 | 45.3 | high | 158% |
| Ballarat Aerodrome | 25.1 | +5.5 | 33.7 | 19th | 11.2 | +3.5 | 5.7 | 24th | 113.0 | 55.8 | v high | 203% |
| Westmere | 27.0 | 35.9 | 10th | 10.3 | 0.4 | 6th | 71.0 | |||||
| West Coast (district 90) | ||||||||||||
| Aireys Inlet | 22.1 | +2.8 | 33.8 | 8th | 13.4 | +2.6 | 8.3 | 4th | 84.8 | 62.1 | high | 137% |
| Cape Nelson Lighthouse | 21.7 | +3.6 | 35.9 | 8th | 14.2 | +2.5 | 10.5 | 4th | 57.0 | 44.7 | average | 128% |
| Cape Otway Lighthouse | 20.8 | +2.5 | 32.8 | 19th | 13.5 | +2.8 | 8.6 | 15th | 58.4 | 63.8 | average | 92% |
| Casterton | 26.4 | 35.0 | 19th | 11.8 | 4.6 | 23rd | 48.0 | |||||
| Casterton Showgrounds | 27.5 | +5.8 | 36.4 | 11th | 11.9 | +3.2 | 3.0 | 6th | 56.8 | 47.2 | average | 120% |
| Colac (Mount Gellibrand) | 24.3 | 33.3 | 11th | 12.2 | 5.9 | 23rd | 64.4 | 47.5 | average | 136% | ||
| Dartmoor | 26.7 | 35.6 | 11th | 12.1 | 2.5 | 6th | 35.8 | |||||
| Hamilton Airport | 26.7 | +6.1 | 35.4 | 19th | 11.6 | +3.7 | 2.2 | 6th | 46.4 | 49.7 | average | 93% |
| Mortlake Racecourse | 25.6 | +5.3 | 34.6 | 10th | 11.0 | +3.4 | 2.2 | 6th | 48.4 | 51.6 | average | 94% |
| Port Fairy AWS | 22.8 | +3.3 | 35.6 | 8th | 13.1 | +2.1 | 7.4 | 6th | 60.0 | 47.8 | average | 126% |
| Portland (Cashmore Airport) | 22.3 | +3.9 | 32.4 | 19th | 12.3 | +2.6 | 7.2 | 6th | 64.4 | 53.5 | average | 120% |
| Warrnambool Airport NDB | 24.4 | +4.3 | 33.7 | 9th | 11.5 | +2.8 | 2.8 | 6th | 47.0 | 56.7 | average | 83% |
| Weeaproinah | 21.0 | +4.9 | 30.0 | 10th | 11.9 | +3.7 | 5.2 | 6th | 145.0 | 139.3 | average | 104% |
Details Extremes Records Summaries Important notes the top
Notes
A Monthly Climate Summary is prepared to list the main features of the weather in Victoria using the most timely and accurate information available on the date of publication; it will generally not be updated. Later information, including data that has had greater opportunity for quality control, will be presented in the Monthly Weather Review, usually published in the fourth week of the month.
This statement has been prepared based on information available at 2 pm on Tuesday 1 December 2009. Some checks have been made on the data, but it is possible that results will change as new information becomes available.
Averages are long-term means based on observations from
all available years of record, which vary widely from site to site.
They are not shown for sites with less than 10 years of record, as they cannot then be calculated reliably.
The median
is sometimes more representative than the
mean
of long-term average rain.
The Rank indicates how rainfall this time compares with the climate record for the site,
based on the
decile ranking
(very low rainfall is in decile 1, low in decile 2 or 3,
average in decile 4 to 7, high in decile 8 or 9
and very high is in decile 10).
The Fraction of average shows how much rain has fallen this time as a
percentage of the long-term mean.
Further information
- Media
- media@bom.gov.au (03) 9669 4057
- Enquiries
- helpdesk.climate@bom.gov.au
![]() Unless otherwise noted, all maps, graphs and diagrams in this page are licensed under the Creative Commons Attribution 4.0 International Licence
Unless otherwise noted, all maps, graphs and diagrams in this page are licensed under the Creative Commons Attribution 4.0 International Licence
