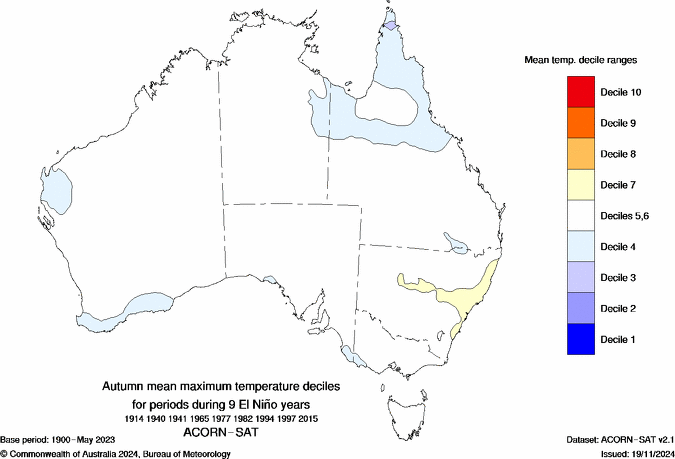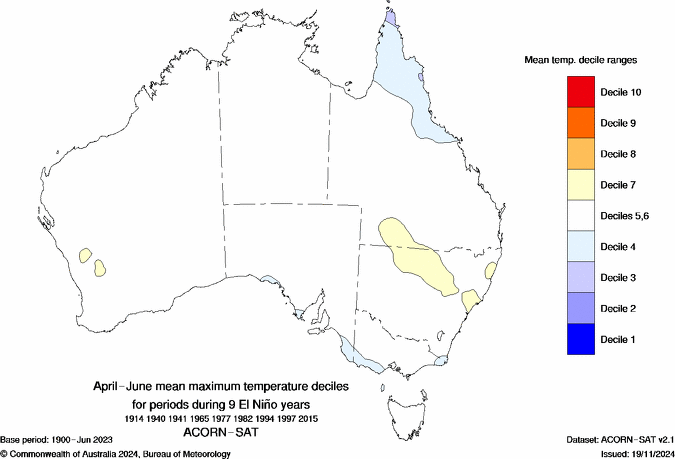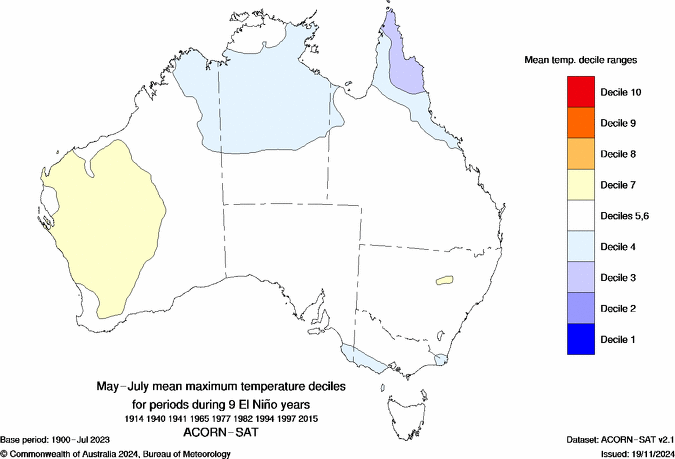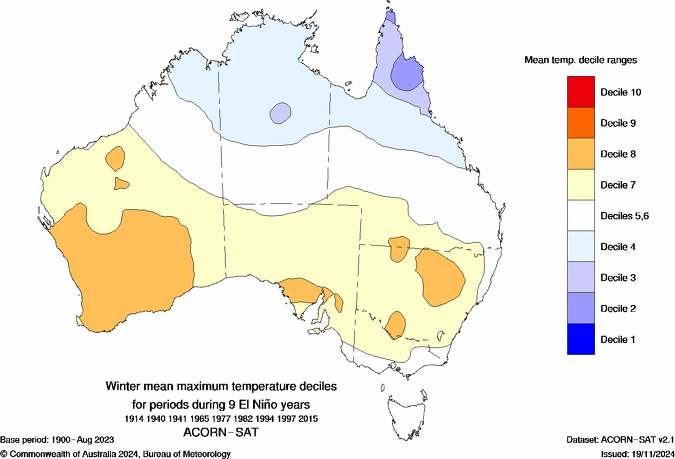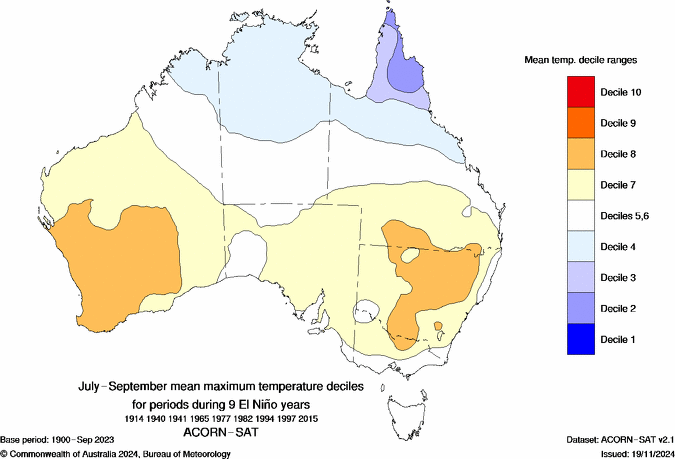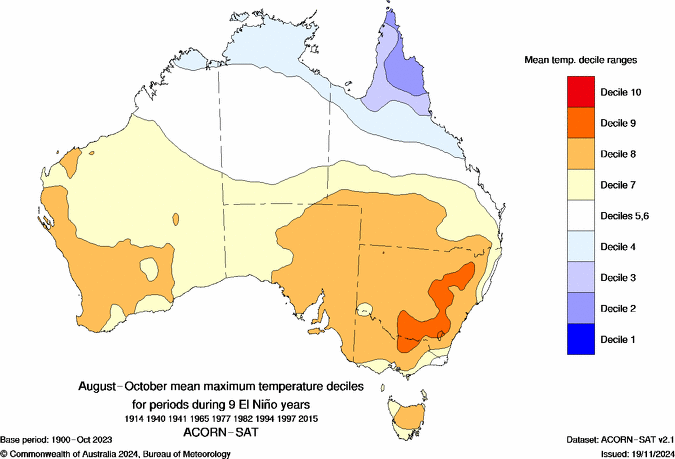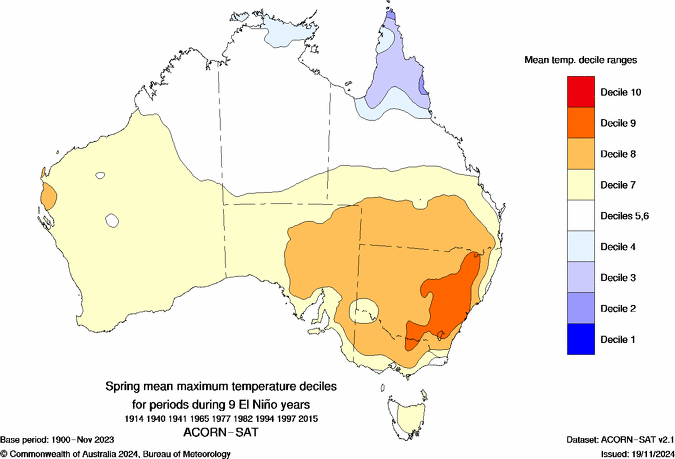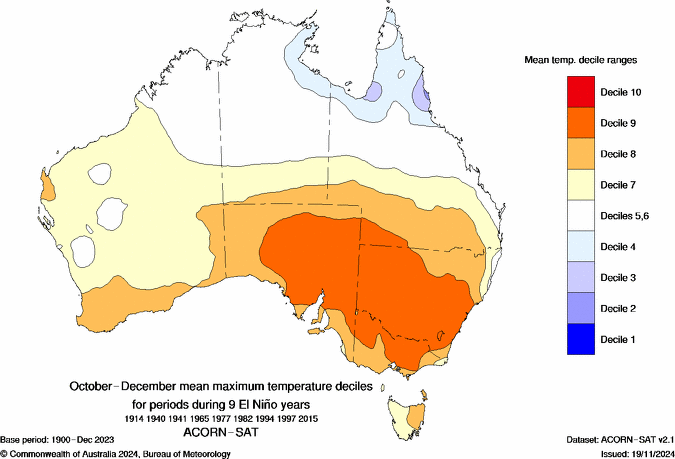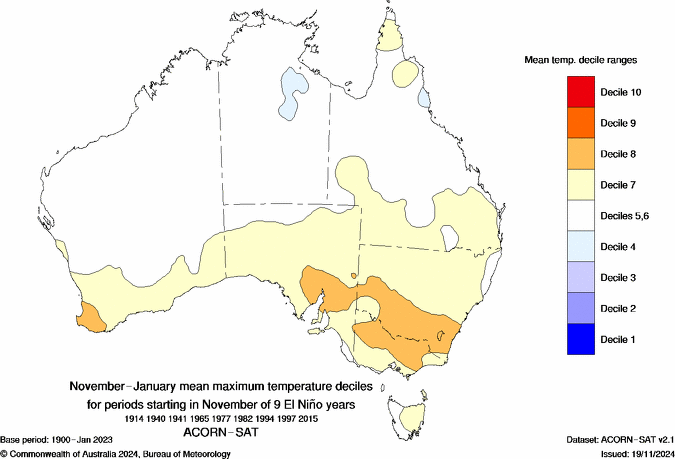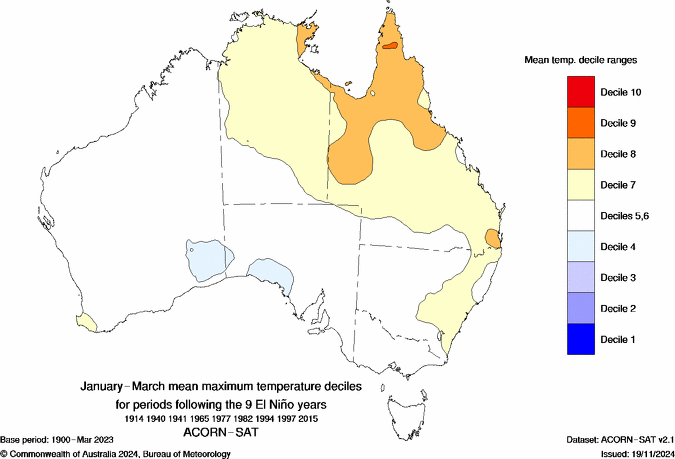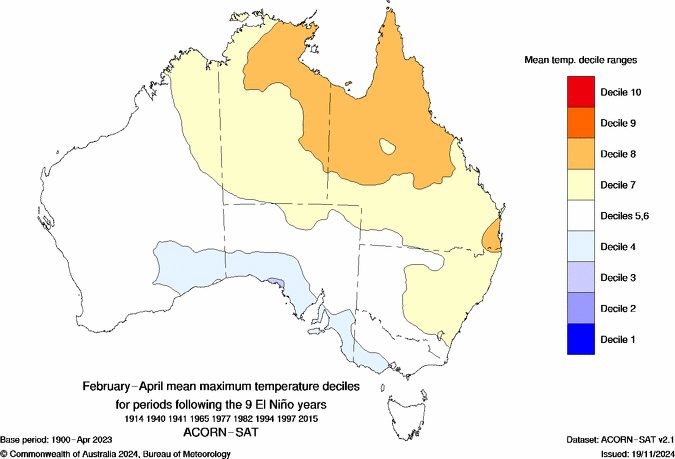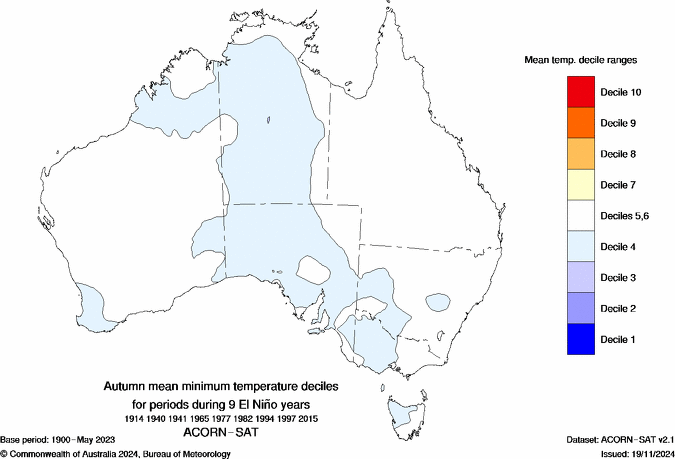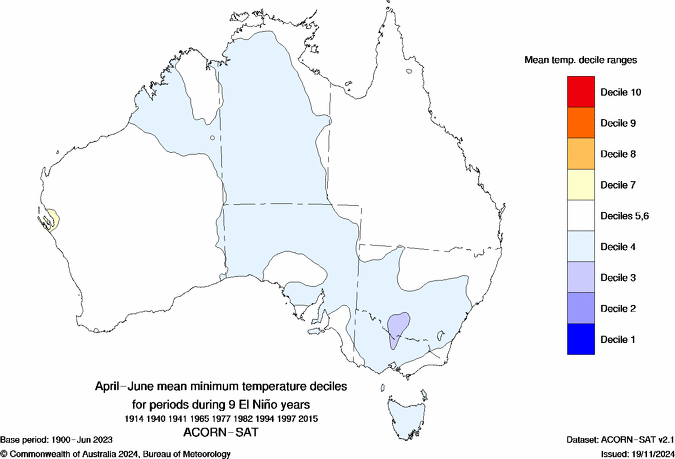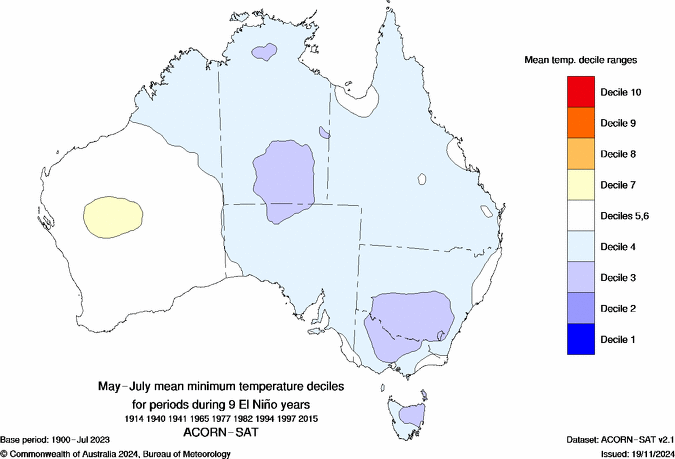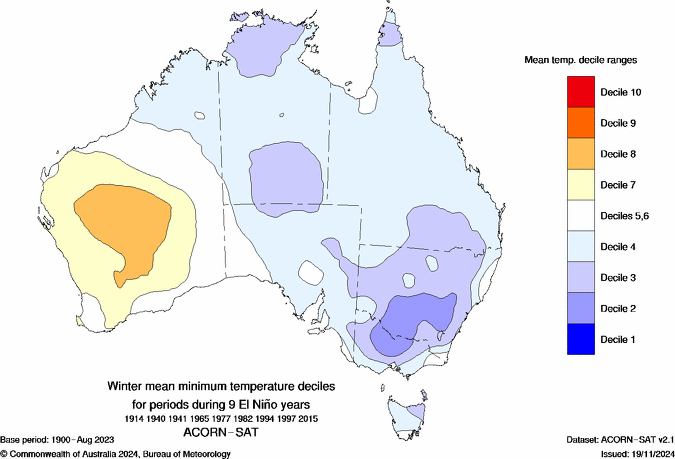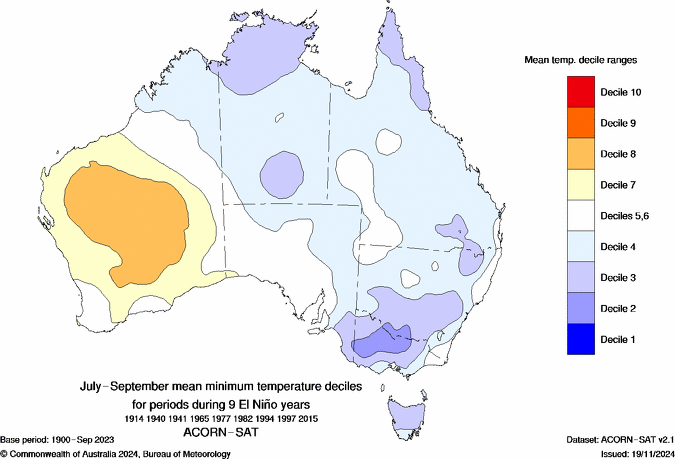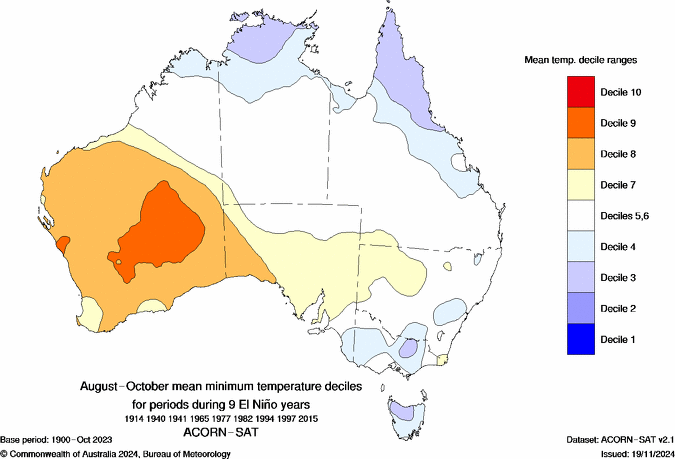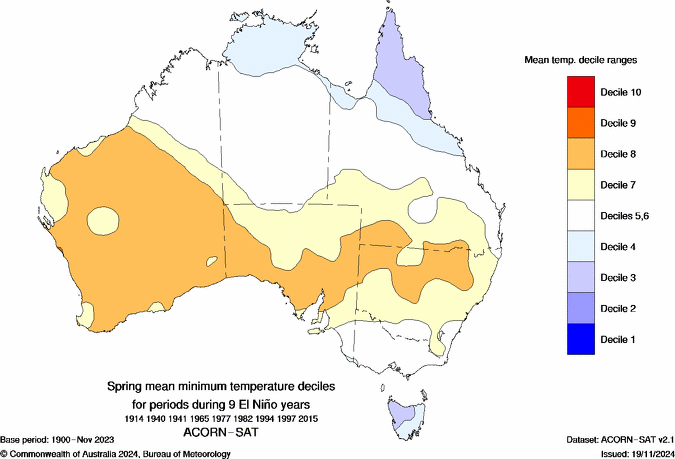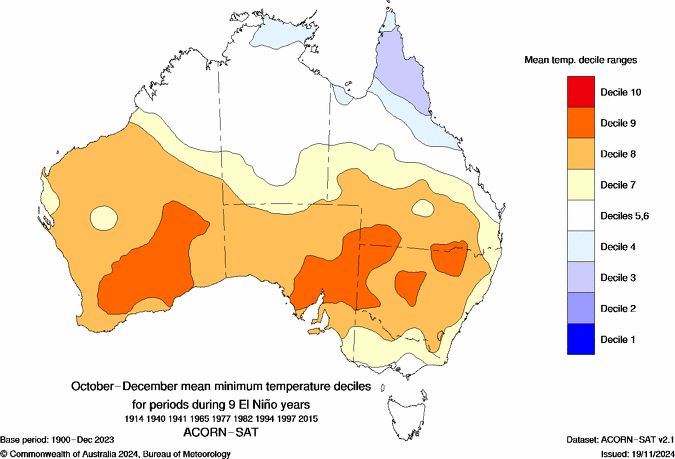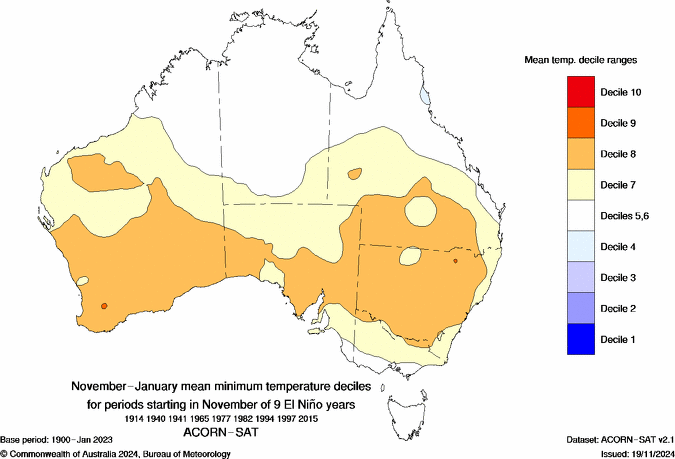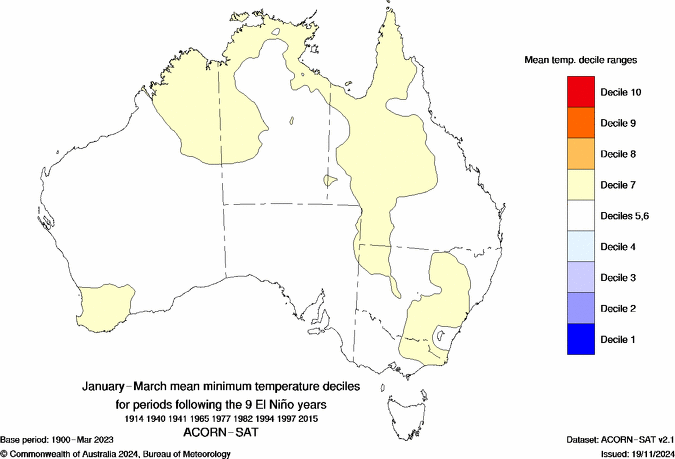
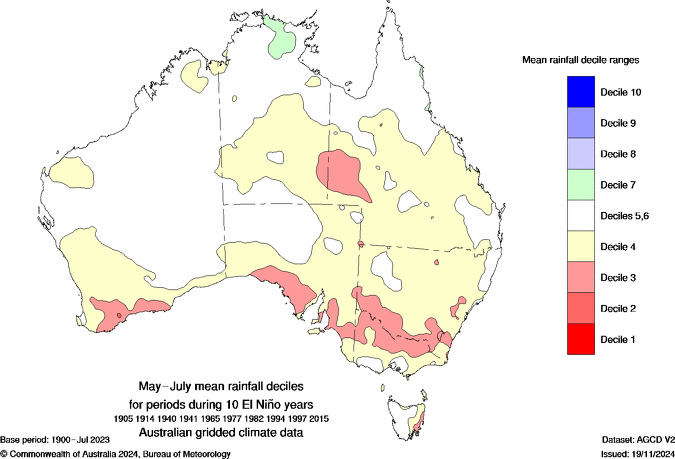
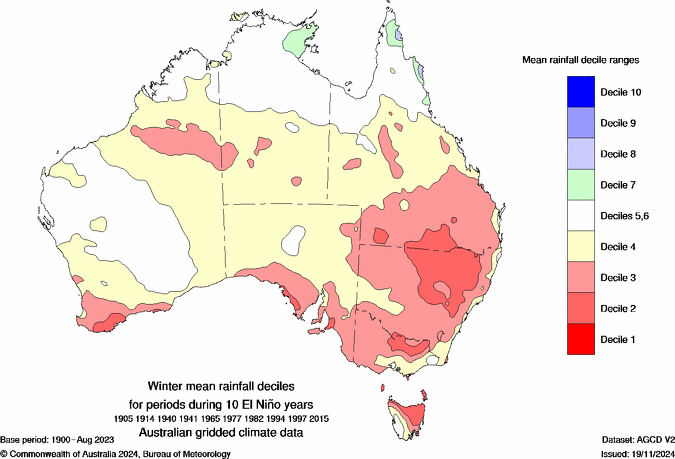
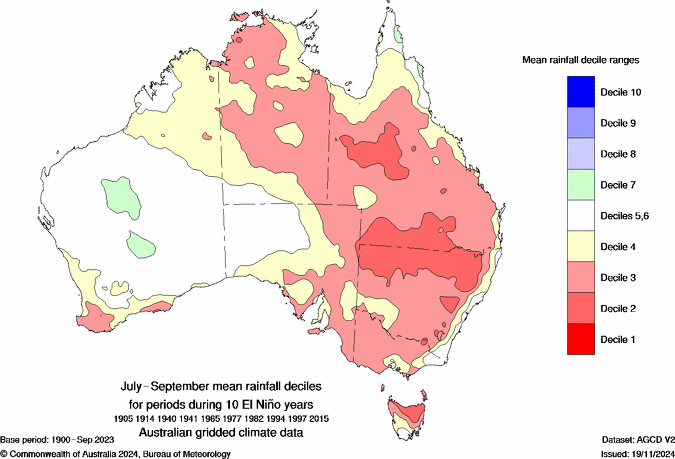
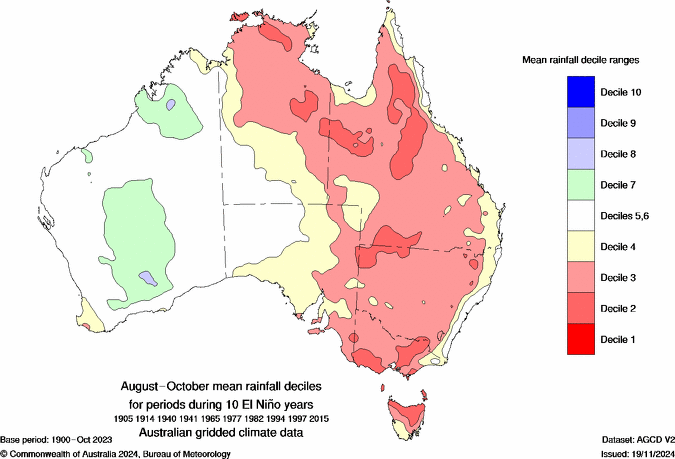
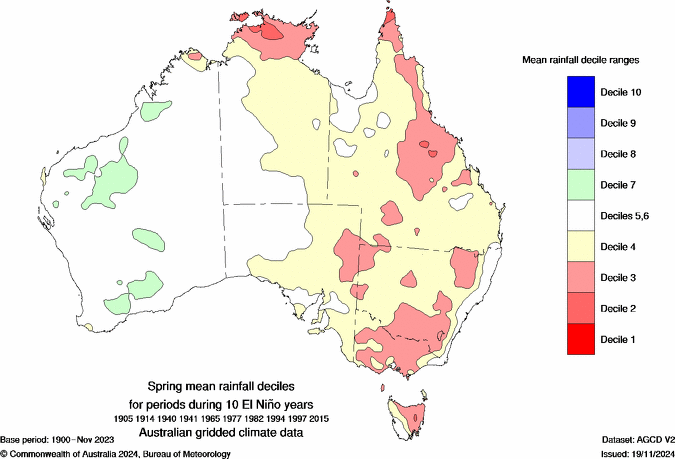

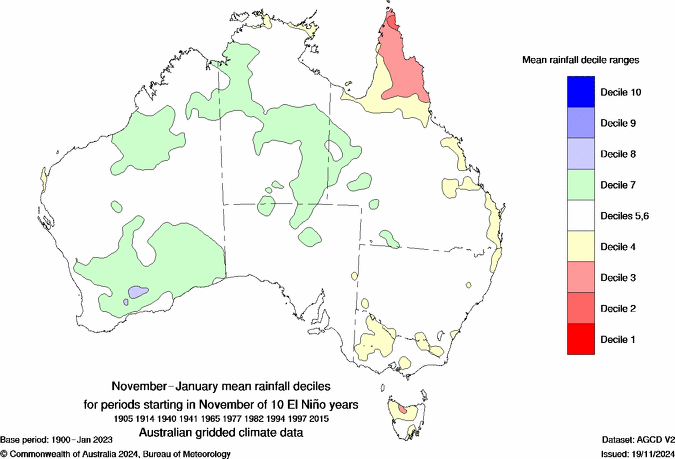

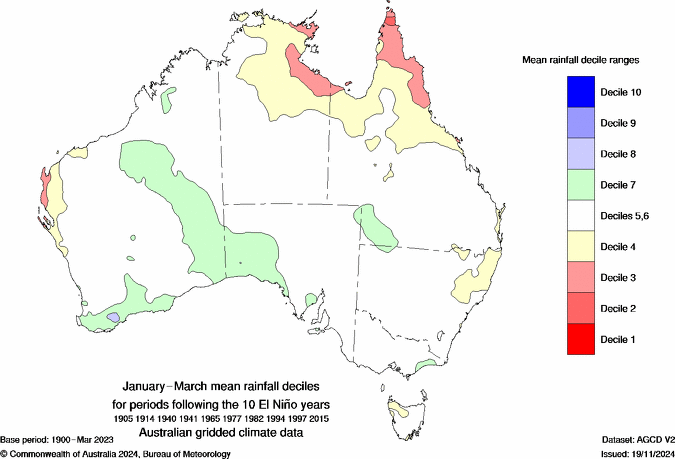

The following maps show the evolution of 3-month rainfall and temperature deciles averaged over the moderate to strong El Niño years. The maps include each overlapping 3-month period during autumn (March to May) to autumn of the decay year, to encompass a typical event from start to finish.
Each El Niño, which can span more than one year, is different. It should not be expected that the climate pattens in any given El Niño year will match those shown. The evolution of individual El Niño events is available at the past ENSO events page.