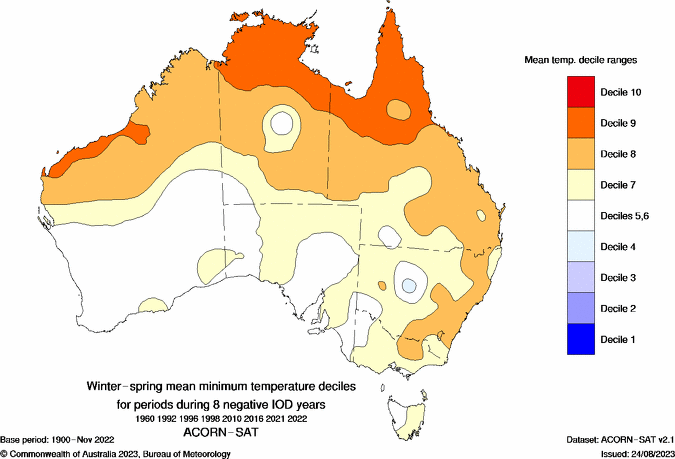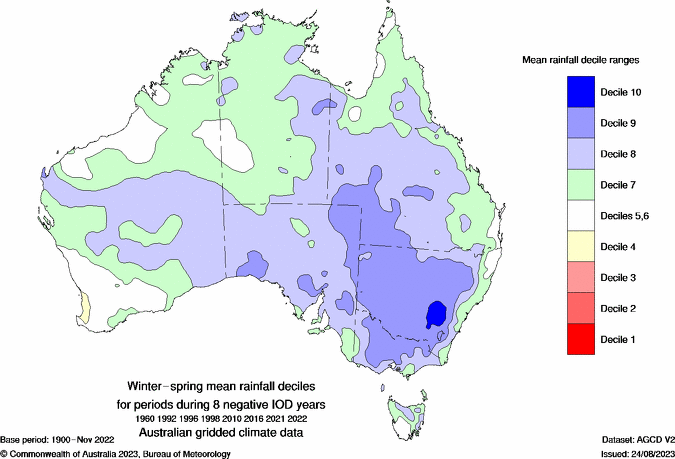
The maps below are composites, or the average impact, of moderate to strong negative Indian Ocean Dipole (IOD) years since 1960. Moderate to strong years are years where there were 2 consecutive, 3-month averages of the IOD index more than 1.5 standard deviations below average, over all years between 1960 and 2023. The years since 1960 were analysed as sea surface temperatures were less reliable prior to this period, due to the reduced availability of satellite observations.
Using this criterion there are 8 moderate to strong negative IOD years between 1960 and 2023. They are: 1960, 1992, 1996, 1998, 2010, 2016, 2021, 2022.
These years were selected because they provide the clearest historical picture of their impact on our climate patterns. However, each negative IOD year is different, and many negative IOD years are weaker in strength. The composite maps are therefore only a guide to the potential influence of a negative IOD. It should not be expected that the climate pattens in any given negative IOD year will match those shown. It is always possible for some regions to receive below average rainfall during a negative IOD year. For each selected year, the deciles for each winter–spring period were calculated against all years since data was available, up to the relevant latest month in 2023. These deciles were then averaged for each point in Australia, and the result mapped.
Historically, a negative IOD has often resulted in more rainfall than average over parts of Australia. The map below shows rainfall during negative IOD years has typically been above average (decile 8 or higher, indicated by the blue shading) across much of southern Australia, particularly over the south-east.
The temperature deciles maps show the average pattern of maximum (Figure 2) and minimum (Figure 3) temperature during moderate to strong negative IOD events in the past. Historically, a negative IOD has often resulted in cooler than average maximum temperatures (decile 3 or lower, indicated by the blue shading) over south-eastern mainland Australia and above average maximum temperature in the far north. Minimum temperatures in the far north have typically being warmer than average (decile 8 or higher), while being above average (decile 7 and 8) over south-eastern Australia.