This brochure describes the flood risk and previous flooding in the
Leichhardt River catchment, last updated in August 2025.
Flood Risk
The Leichhardt River catchment is located in northwest Queensland and covers an area of approximately 33,000 square kilometres. The river rises in the Selwyn Ranges, 40 kilometres southeast of Mount Isa. It flows in a northerly direction, through the city of Mount Isa and Lake Moondarra, before passing through Julius Dam. It is joined by its major tributary, Gunpowder Creek, 15 kilometres downstream of Kamileroi. Another major tributary, Fiery Creek, joins the river 70 kilometres downstream of Lorraine. The Alexandra River enters the river from the east, just downstream of Floraville, before the Leichhardt River finally passes through a vast coastal plain and enters the Gulf of Carpentaria 30 kilometres northeast of Burketown.
Floods normally develop in the headwaters of the Leichhardt River and its major tributaries; however, general heavy rainfall events can develop from monsoonal and cyclonic influences which can result in widespread flooding, particularly in the lower reaches below Lorraine.
Areas around Mount Isa on the upper end of the catchment can be prone to rapid responses during heavy rainfall events.
Previous Flooding
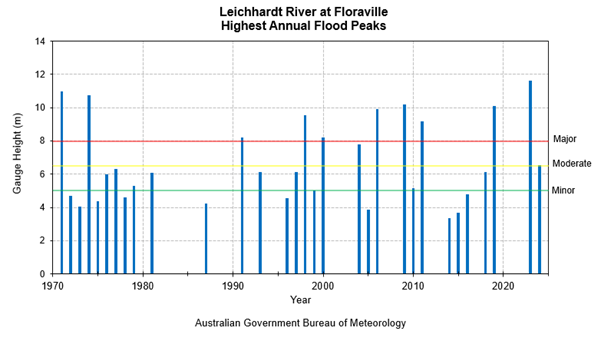
Previous flood information for the Leichhardt River is rather limited. However, peak heights are generally available from 1974 onwards. Some of the most notable major flood events occurred in 1971, 1974, 1991, 1998, 2006, 2009, 2011, 2019 and 2023, and to a lesser extent in 1997 and 2004.
More recently, the record major flood event in February and March 2023 caused widespread disruption and prolonged isolation of communities along with inundation of properties, especially across the lower reaches of the catchment.
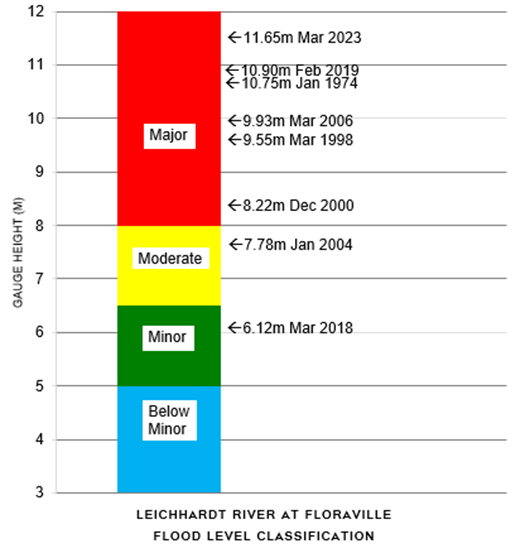
The table below summarises the flood history of the Leichhardt River catchment - it contains the flood gauge heights of the more significant recent floods.
| Flood Event | Doughboy Creek (m) | Julius Dam (m) | Miranda Creek (m) | Lorraine (m) | Gunpowder (m) | *The 16 Mile Waterhole (m) | Floraville (m) |
| Mar 1971 | - | - | 10.26 | - | - | - | 10.97 |
| Jan 1974 | - | - | 9.24 | 16.06 | 8.66 | 5.34 | 10.75 |
| Jan/Feb 1991 | 9.55 | - | - | 15.65 | 5.97 | - | 8.22 |
| Mar 1997 | 11.57 | 4.5 | - | 14.70 | - | 2.19 | 6.12 |
| Mar 1998 | 5.01 | 1.13 | - | 13.70 | 4.69 | 5.12 | 9.55 |
| Jan 2004 | - | - | - | 16.20 | 8.82 | 4.70 | 7.78 |
| Mar 2006 | 7.02 | 2.77 | - | 16.90 | 10.63 | - | 9.93 |
| Jan/Feb 2009 | 6.21 | 8.09 | - | 16.80 | 8.49 | 5.51 | 10.18 |
| Mar 2011 | 8.53 | 2.47 | 8.49 | 15.90 | 5.22 | 4.02 | 9.20 |
| Feb 2019 | 10.15 | 3.01 | 5.36 | 16.87 | 6.46 | - | 10.09 |
| Mar 2023 | 8.86 | 3.18 | 11.28 | 17.00 | 10.59 | - | 11.65 |
| Feb 2024 | 6.73 | 3.18 | - | 10.65 | 4.96 | - | 6.56 |
All heights are in metres on flood gauges.
*Note: The 16 Mile Waterhole information site was closed in March 2020.


Further Information:
- Latest rainfall and river heights
- For information on the flood warning service for the Leichhardt River: Queensland Service Level Specification
- Catchment map: Queensland Leichhardt,Nicholson,Settlement Rivers map
- National Arrangements for Flood Forecasting and Warning


