Perth
16.5.3.7 Groundwater allocation extraction—other lumped holders
Supporting information
This line item refers to groundwater extracted from licensed bores within the Perth region.
The groundwater supply licences are divided into licence entitlement purposes. Total groundwater extracted from each aquifer for each licence purpose during 2009-10 is given in the table below. The figure below shows the percentage of the total volume of groundwater extracted for each licence category.
|
Licence category |
Volume abstracted (ML) |
|||
|---|---|---|---|---|
|
|
Water table aquifer |
Underlying aquifer Leederville |
Underlying aquifer Yarragadee |
Total |
|
Agriculture |
118,699 |
18,169 |
600 |
137,468 |
|
Commercial and institutional |
15,468 |
741 |
0 |
16,209 |
|
Environment and conservation |
1,284 |
1,200 |
0 |
2,484 |
|
Industry and power generation |
25,448 |
2,048 |
7,235 |
34,731 |
|
Mining |
2,567 |
1 |
0 |
2,568 |
|
Parks, gardens and recreation |
64,802 |
9,769 |
880 |
75,451 |
|
Stock and domestic |
21,500 |
3,596 |
0 |
25,096 |
|
Other |
368 |
107 |
0 |
475 |
|
Total |
250,136 |
35,631 |
8,715 |
294,482 |
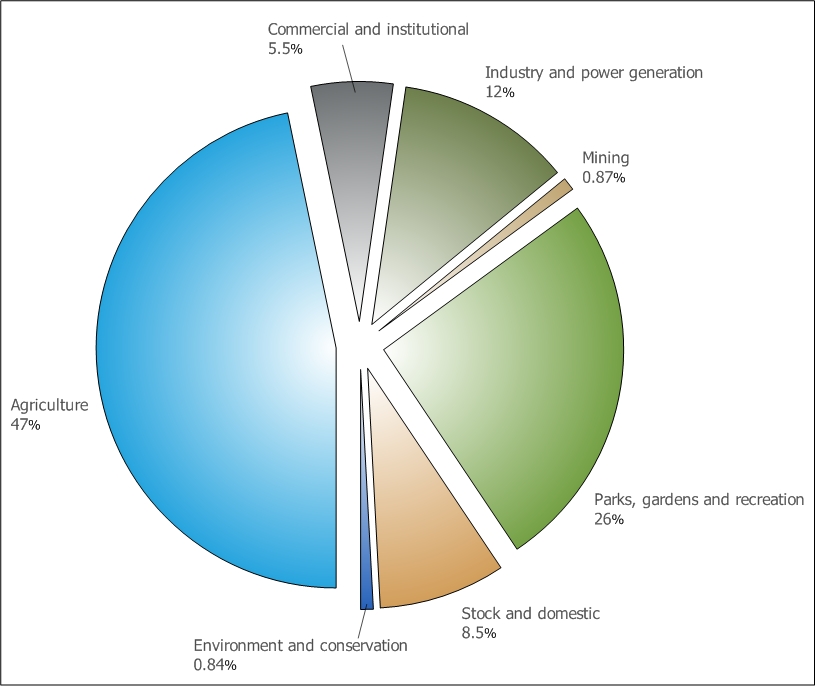
Graph of the percentage of the total volume of groundwater extracted for each licence category
Quantification approach
Data source
Western Australian Department of Water: Water Resource Licensing database.
Australian Bureau of Statistics (ABS): domestic bore survey database.
Data provider
Western Australian Department of Water.
Method
The Department of Water does not have sufficient metering information relating to actual extraction from licensed bores to determine the total volume of water extracted. Consequently, the allocation extraction during the reporting period is estimated based on the licensed allocation.
The volume of extraction is estimated to be the full allocation, divided by the number of days that each licence was active during the reporting period. The number of days the licences were active is calculated using the annual renewal date of each individual licence.
- For licences that expired during the reporting year (and were not renewed), the volume of extraction is estimated to be the full entitlement divided by the number of days from 1 July 2009 until its expiry date.
- For new licences that were created during the reporting year, the volume of extraction is estimated to be the full entitlement divided by the number of days from the licence start date until 30 June 2010.
Some licences are issued in perpetuity and do not have an annual renewal date. In these cases, the volume of extraction is estimated as the amount of one full year’s allocation for licences in force during the reporting year.
Uncertainty
Ungraded.
Approximations, assumptions, caveats/limitations
There is insufficient information relating to actual extraction to provide more accurate estimates of extraction for all licences. The pro-rata estimates of extraction assume that the full annual entitlement is extracted each year and that the rate of extraction is uniform throughout the year. It is unlikely on both counts that this will be the case for all licences.