Sydney
Urban Water - Shoalhaven City Council
Summary of the water distribution system
Figure 1 and tables 1 –8 summarise the water distribution for Shoalhaven City Council for 2009-10. The tables provide a breakdown for values shown in Figure 1. Notes for the values provided in tables 1 –8 are available after Table 8.
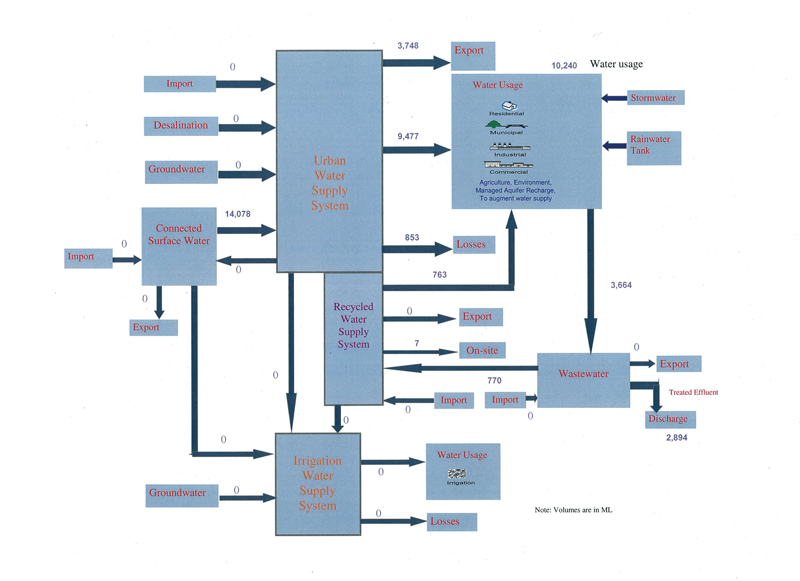
Figure 1. Diagram of water distribution summary for Shoalhaven City Council for 2009–10
| Item | Sources of water | Volume (ML) | Note identifier | |
|---|---|---|---|---|
| 1 | Delivered via the water supply system | Water sourced from external entity | Not applicable | |
| 2 | Water sourced from surface water | 14,078 | SCC_U1 | |
| 3 | Water sourced from groundwater | Not applicable | ||
| 4 | Water sourced from desalination | Not applicable | ||
| 5 | Water sourced from recycling | Not applicable | ||
| 6 | Total water sourced | 14,078 | Item 2 |
|
Item |
Water export |
Volume (ML) |
Note identifier |
|---|---|---|---|
|
1 |
Potable water export |
2,574 |
SCC_U7 |
|
2 |
nonpotable water export |
1,174 |
SCC_U8 |
|
3 |
Total export |
3,748 |
Items (1+2) |
| Item | Water usage | Volume (ML) | Note identifier |
|---|---|---|---|
| 1 | Residential – potable water | 3,125 | SCC_U9 |
| 2 | Commercial, industrial, municipal – potable water | 3,597 | SCC_U10 |
| 3 | Other including Agricultural – potable water | 567 | SCC_U11 |
| 4 | Residential – nonpotable water | 8 | SCC_U12 |
| 5 | Commercial, industrial, municipal – nonpotable water | 2,180 | SCC_U13 |
| 6 | Total water use | 9,477 | Sum of items 1 to 5 |
| Item | Losses | Volume (ML) | Note identifier |
|---|---|---|---|
| 1 | Losses from potable, nonpotable water supplies | 853 | SCC_U17 & U18 |
| 2 | Losses from recycled water supplies | Not available | |
| 3 | Total water losses | 853 | Item 1 |
| Item | Wastewater collected and treated | Volume (ML) | Note identifier |
|---|---|---|---|
| 1 | Wastewater collected and treated within the entity | 3,664 | SCC_U19a* |
| 2 | Wastewater collected and treated from external entity | 0 | |
| 3 | Total wastewater collected and treated | 3,664 | Item 1 |
* SCC_U19a which is the note for wastewater collected also applies for wastewater treated.
| Item | Wastewater discharged | Volume (ML) | Note identifier |
|---|---|---|---|
| 1 | Treated wastewater discharged to surface water | 2,742 | SCC_U22 |
| 2 | Treated wastewater discharged to ocean | 152 | SCC_U23 |
| 3 | Total volume discharged | 2,894 | Items (1 + 2) |
| Item | Recycled water produced and supplied | Volume (ML) | Note identifier |
|---|---|---|---|
| 1 | Total recycled water produced | 770 | SCC_U30 |
| 2 | Recycled water supplied to commercial, industrial, municipal | 62 | SCC_U32 |
| 3 | Recycled water supplied to agricultural | 701 | SCC_U33 |
| 4 | Recycled water use on-site / in-process | 7 | SCC_U34 |
| 5 | Total recycled water supplied | 763 | Items (2 + 3) |
| Item | Component | Volume (ML) | Reference |
|---|---|---|---|
| 1 | Water use from potable and nonpotable water supply | 9,477 | Table 3 |
| 2 | Water use from recycled water supply | 763 | Table 7 |
| 3 | Total water use | 10,240 | Items (1 + 2) |
U1 Volume of water taken from surface water for water supply
(SCC_U1) See the following table for the volume
Data source
Shoalhaven City Council’s Telemetry System.
Data provider
Shoalhaven City Council (SCC).
Method
This item represents the total volume of surface water taken for water supply as shown in the following table. The table presents volumes recorded by the bulk supplier, the Sydney Catchment Authority (SCA) as provided to SCC, and received volumes recorded by SCC.
| Component | Volume recorded by SCC (ML) | Volume recorded by SCA (ML) |
|---|---|---|
| 1. Water diverted from Bendeela Pondage for Kangaroo Valley Water Treatment Plant | 87 | 87 |
| 2. Water diverted from Bamarang Reservoir (water from the Shoalhaven River pumped at Burrier) for the Bamarang and Flat Rock water treatment plants | 10,629 | 14,057 |
| 3. Water diverted from Bamarang Reservoir (water from the Shoalhaven River pumped at Burrier) for nonpotable (raw) water supplies to Bomaderry and Jasper | 2,188 | |
| 4. Water diverted from Bamarang Reservoir (water from the Shoalhaven River pumped at Burrier) for nonpotable (raw) water export to the Clyde River catchment (beyond the Sydney Region) | 1,174 | |
| Total | 14,078 | 14,144 |
Volumes from SCA are based on full bore magnetic flow meter readings to measure water diverted to urban utilities from the storage reservoirs. Sources of SCA data include invoices to retail water utilities, daily returns system database and Integrated Instrumentation Control Automation and Telemetry System (IICATS) meter readings.
Volumes from SCC are based on its telemetry system records. The data extracted from the telemetry system were analysed using Microsoft Access query to derive the volume.
This UrbanSAT Note is based on data provided by SCC, but in order to maintain consistency in calculation, the accounting statements for the Sydney Region show the volumes delivered by the bulk supplier (see Line item 14.7.4). The data suppliers suggest limits of meter accuracy as the cause for the difference.
Uncertainty
Volumes for both SCA and SCC have been based on measured data. Estimated accuracy based on meter accuracy is +/–2% for SCA. Estimated uncertainty based on meter accuracy is +/–5% for SCC.
Assumptions, approximations and caveats/limitations
Nil.
U7 Volume of potable water export
SCC_U7 2,574 ML
Data source
Shoalhaven City Council’s water billing records and the telemetry system.
Data provider
Shoalhaven City Council (SCC).
Method
This item represents the total metered volume of potable water exported as supplies to the council’s service area in the Clyde River Catchment (outside the Sydney Region). Metered customer use data extracted from billing records have been used to determine potable water export.
Uncertainty
Estimated uncertainty, based on meter accuracy and professional judgment on determination of boundaries of billing areas beyond the Sydney region, is +/–5%.
Assumptions, approximations and caveats/limitations
The compilation of data for the line item has been difficult in that the Sydney Region does not align with the boundaries of SCC. Every effort was made by the council to ensure accuracy on a suburb/location basis.
U8 Volume of nonpotable water export
SCC_U8 1,174 ML
Data source
Shoalhaven City Council’s telemetry system.
Data provider
Shoalhaven City Council (SCC).
Method
This item represents the total metered volume of nonpotable water exported as supplies to the council’s service area in the Clyde River Catchment (outside the Sydney Region). Data sourced from the telemetry system for the flow meters that measure raw water deliveries have been used to derive the volume.
Uncertainty
Estimated uncertainty, based on meter accuracy and professional judgment on determination of boundaries of water supply areas beyond the Sydney region, is +/–5%.
Assumptions, approximations and caveats/limitations
The compilation of data for the line item has been difficult in that the Sydney Region does not align with the boundaries of SCC. Every effort was made by the council to ensure accuracy on a suburb/location basis.
U9 Volume of potable water supplied for residential use
SCC_U9 3,125 ML
Data source
Shoalhaven City Council’s water billing records.
Data provider
Shoalhaven City Council.
Method
This item represents the total metered volume of potable water supplied for residential use, based on water billing records.
Uncertainty
Estimated uncertainty, based on meter accuracy and professional judgment, is +/–5%.
Assumptions, approximations and caveats/limitations
Nil.
U10 Volume of potable water supplied for commercial, industrial and municipal uses
SCC_U10 3,597 ML
Data source
Shoalhaven City Council’s water billing records.
Data provider
Shoalhaven City Council.
Method
This item represents the total metered volume of potable water supplied for commercial, industrial and municipal use based on water billing records.
Uncertainty
Estimated uncertainty, based on meter accuracy and professional judgment, is +/–5%.
Assumptions, approximations and caveats/limitations
Nil.
U11 Volume of potable water supplied other than for residential, commercial, municipal and industrial uses
SCC_U11 567 ML
Data source
Shoalhaven City Council’s water billing records.
Data provider
Shoalhaven City Council.
Method
This item represents the total metered volume of potable water supplied for agricultural use based on water billing records.
Uncertainty
Estimated uncertainty, based on meter accuracy and professional judgment, is +/–5%.
Assumptions, approximations and caveats/limitations
Nil.
U12 Volume of nonpotable water supplied for residential use
SCC_U12 8 ML
Data source
Shoalhaven City Council’s water billing records.
Data provider
Shoalhaven City Council.
Method
This item represents the total metered volume of nonpotable water supplied for residential use in Jasper Brush from Bamarang Reservoir based on water billing records.
Uncertainty
Estimated uncertainty, based on meter accuracy and professional judgment, is +/–5%.
Assumptions, approximations and caveats/limitations
Nil.
U13 Volume of nonpotable water supplied for commercial, industrial and municipal uses
SCC_U13 2,180 ML
Data source
Shoalhaven City Council’s water billing records.
Data provider
Shoalhaven City Council.
Method
This item represents the total metered volume of nonpotable water supplied to Bomaderry from Bamarang Reservoir for industrial use based on water billing records.
Uncertainty
Estimated uncertainty, based on meter accuracy and professional judgment, is +/–5%.
Assumptions, approximations and caveats/limitations
Nil.
U17 Losses (e.g. pipe bursts) from potable water supply system
and
U18 Losses (e.g. pipe bursts) from nonpotable water supply system
Background leakage represents water loss from the system in slow, diffuse or continuous egress forms. A burst is a rupture at a point in the system that generally results in loss of water in fast, point-based or event-based egress forms.
The total volume of leakage and losses is taken as an input to the ‘landscape’ water store, as the breakdown on the component entering ‘groundwater’ is not available separately.
SCC_U17 and SCC_U18 853 ML
Data source
NSW Water Supply and Sewerage Performance Monitoring Report 2009–10 (access through ‘Performance monitoring’ webpage of the NSW Office of Water. The report will be included on the webpage from June 2011; see ‘Additional notes 1’ for more details).
Data provider
Shoalhaven City Council (SCC).
Method
The value provided by SCC is the total loss and leakage from the urban potable water supply and nonpotable water (raw water diverted from the rivers) supply systems. This volume is estimated as 9% of the total consumption via the urban potable water and nonpotable water supplies.
Uncertainty
The volume is based on measured data from a sample area and extrapolated to other areas. Estimated uncertainty based on meter accuracy, professional judgment and organisational practice is +/–5%.
Assumptions, approximations and caveats/limitations
The volume represents total leakage and loss from potable and nonpotable water supply systems, as a breakdown is not available.
The uncertainty estimate is based on the total leakage factor for the whole of the area managed and may not specifically relate to the SCC area within the Sydney Region (i.e. the value provided is likely to be an overestimate).
U19a Volume of wastewater collected
SCC_U19a 3,664 ML
Data source
NSW Water Supply and Sewerage Performance Monitoring Report 2009–10 (access through ‘Performance monitoring’ webpage of the NSW Office of Water; the report will be included on the webpage from June 2011).
Data provider
Shoalhaven City Council (SCC).
Method
This item represents the total metered volume of wastewater collected and treated by SCC’s wastewater treatment plants within the Sydney Region.
| Wastewater treatment plant | Volume collected/treated in 2009–10 (ML) |
|---|---|
| Berry | 214 |
| Bomaderry | 930 |
| Culburra | 561 |
| Nowra | 1,707 |
| Shoalhaven Heads | 252 |
| Total | 3,664 |
Outflows from wastewater treatment plants (measured as follows) plus on-site use have been considered as wastewater collected assuming no losses at the plants:
- Berry Wastewater Treatment Plant: Vega-type ultrasonic flow meter
- Bomaderry and Nowra wastewater treatment plants: a Parshall flume with a venturi flow meter at each site
- Culburra Wastewater Treatment Plant: Combined Instruments M300 flow meters
- Shoalhaven Heads Wastewater Treatment Plant: an Elster meter and a Parshall flume with a venturi flow meter.
Uncertainty
The volume is based on measured data. Estimated uncertainty based on meter accuracy is +/–5%.
Assumptions, approximations and caveats/limitations
The volume of wastewater collected/treated at sewerage treatment plants may also include any net ingress of stormwater or groundwater to the sewer system.
U19b Volume of wastewater treated
SCC_U19b
Note: information used in SCC_U19a is assumed to be applicable to U19b; any loss from the wastewater treatment process is assumed to be negligible.
U22 Volume of (treated) wastewater discharged to surface water
SCC_U22 2,742 ML
Data source
Shoalhaven City Council (SCC) telemetry system and daily data registers in respect of the operations of the plants.
Data provider
Shoalhaven City Council.
Method
This item represents the total metered volume of treated wastewater discharge to surface water at SCC’s wastewater treatment plants within the Sydney Region.
| Wastewater treatment plant | Volume discharged (ML) | River / Creek |
|---|---|---|
| Berry | 149 | Broughton Creek |
| Bomaderry | 927 | Abernathys Creek |
| Nowra | 1,666 |
Shoalhaven River |
| Total | 2,742 |
Outflows from wastewater treatment plants have been measured as follows:
- Berry Wastewater Treatment Plant: Vega-type ultrasonic flow meter
- Bomaderry and Nowra wastewater treatment plants: a Parshall flume with a venturi flow meter at each site.
Uncertainty
The volume is based on measured data. Estimated uncertainty based on meter accuracy is +/–5%.
Assumptions, approximations and caveats/limitations
Nil.
U23 Volume of (treated) wastewater discharged to sea or out of entity
This information was prepared based on the relevant data provided under Line item U22.
SCC_U23 152 ML
Data source
NSW Water Supply and Sewerage Performance Monitoring Report 2009–10 (access through ‘Performance monitoring’ webpage of the NSW Office of Water; the report will be included on the webpage from June 2011).
Data provider
Shoalhaven City Council.
Method
This item represents the total metered volume of treated wastewater discharge to the sea from wastewater treatment plants.
| Wastewater treatment plant | Volume (ML) |
|---|---|
| Shoalhaven Heads | 152 |
| Total | 152 |
Outflow volumes from Shoalhaven Heads Wastewater Treatment Plant have been measured using an Elster meter, and a Parshall flume with a venturi flow meter.
Uncertainty
The volume is based on measured data. Estimated uncertainty based on meter accuracy is +/–5%.
Assumptions, approximations and caveats/limitations
Nil.
U30 Volume of recycled water produced from sewage
SCC_U30 770 ML
Data source
NSW Water Supply and Sewerage Performance Monitoring Report 2009–10 (access through ‘Performance monitoring’ webpage of the NSW Office of Water; the report will be included on the webpage from June 2011).
Data provider
Shoalhaven City Council (SCC).
Method
This item represents the total metered volume of recycled water produced from sewage from SCC’s wastewater treatment plants within the Sydney Region.
| Wastewater treatment plant | Volume produced (ML) |
|---|---|
| Berry | 65 |
| Bomaderry | 3 |
| Culburra | 561 |
| Nowra | 41 |
| Shoalhaven Heads | 100 |
| Total | 770 |
Uncertainty
The volume is based on measured data. Estimated uncertainty based on meter accuracy is +/–5%.
Assumptions, approximations and caveats/limitations
Nil.
U32 Volume of recycled water supplied for commercial, industrial and municipal uses
SCC_U32 62 ML
Data source
NSW Water Supply and Sewerage Performance Monitoring Report 2009–10 (access through ‘Performance monitoring’ webpage of the NSW Office of Water; the report will be included on the webpage from June 2011).
Data provider
Shoalhaven City Council (SCC).
Method
This item represents the total metered volume of recycled water supplied for commercial, industrial and municipal uses by SCCl’s wastewater treatment plants within the Sydney Region.
| Wastewater treatment plant | Volume of supplied (ML) |
|---|---|
| Bomaderry | 3 |
| Culburra | 22 |
| Nowra | 37 |
| Total | 62 |
Uncertainty
The volume is based on measured data. Estimated uncertainty based on meter accuracy is +/–5%.
Assumptions, approximations and caveats/limitations
Nil.
U33 Volume of recycled water supplied other than for residential, commercial, municipal and industrial uses
SCC_U33 701 ML
Data source
NSW Water Supply and Sewerage Performance Monitoring Report 2009–10 (access through ‘Performance monitoring’ webpage of the NSW Office of Water; the report will be included on the webpage from June 2011).
Data provider
Shoalhaven City Council (SCC).
Method
This item represents the total metered volume of recycled water supplied for irrigation use by SCC’s wastewater treatment plants within the Sydney Region.
| Wastewater treatment plant | Volume supplied (ML) |
|---|---|
| Berry | 64 |
| Culburra | 537 |
| Shoalhaven Heads | 100 |
| Total | 701 |
Uncertainty
The volume is based on measured data. Estimated uncertainty based on meter accuracy is +/–5%.
Assumptions, approximations and caveats/limitations
Nil.
U34 Volume of recycled water used on-site or in-process
SCC_U34 7 ML
Data source
NSW Water Supply and Sewerage Performance Monitoring Report 2009–10 (access through ‘Performance monitoring’ webpage of the NSW Office of Water; the report will be included on the webpage from June 2011).
Data provider
Shoalhaven City Council (SCC).
Method
This item represents the total metered volume of recycled water used in the wastewater treatment process by SCC’s wastewater treatment plants within the Sydney Region.
| Wastewater treatment plant | On-site within process use volume (ML) |
|---|---|
| Berry | 1 |
| Culburra | 2 |
| Nowra | 4 |
| Total | 7 |
Uncertainty
The volume is based on measured data. Estimated uncertainty based on meter accuracy is +/–5%.
Assumptions, approximations and caveats/limitations
Nil.