
Meteorology is a global science. Sharing knowledge and expertise benefits all nations, including Australia.
We contribute to this global effort, working with organisations around the world. Our expertise helps advance international science, technology and operations.
We are active in many intergovernmental bodies and collaborate with a wide range of partners. This can be bilaterally (one-on-one) or multilaterally (with many parties).
World Meteorological Organization
The World Meteorological Organization (WMO) is a specialised agency of the United Nations. It promotes international cooperation and coordination to understand:
- the state and behaviour of the Earth’s atmosphere
- how the atmosphere interacts with the land and oceans
- the weather and climate this produces
- how resulting water resources are distributed.
We are the lead Australian Government agency for Australia's engagement in the WMO. Our CEO and Director of Meteorology is Australia's Permanent Representative to the WMO. This role coordinates Australian participation in WMO programs and activities, including:
- sharing of data and products
- operation of WMO-recognised regional and global centres.
Our engagement includes taking part in the:
- World Meteorological Congress
- Executive Council
- Regional Association V (South-West Pacific)
- WMO technical commissions and expert subsidiary bodies
- WMO Research Board
- other advisory and coordination bodies.
Regional Association V
Australia is a member of WMO's Regional Association V (South-West Pacific).
Together, we aim to enhance the region's ability to deal effectively with weather, water and climate conditions. We work with Regional Association V members to coordinate meteorological, hydrological and related activities. This includes priority activities to support multi-hazard early warning systems (MHEWS).
For more information on our regional activities, view our Indo-Pacific development page.

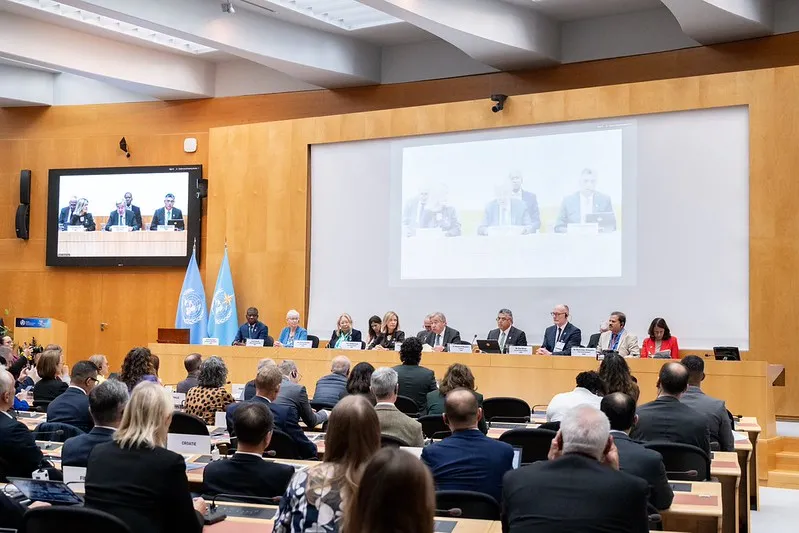
United Nations Secretary-General António Guterres addresses the Extraordinary World Meteorological Congress, held every 4 years. The Bureau is the lead Australian Government agency for engagement in the World Meteorological Organization. Credit: Irina Popa/UN/WMO.
Intergovernmental Oceanographic Commission
We represent Australia as a member state of the Intergovernmental Oceanographic Commission (IOC). It's part of the United Nations Educational, Scientific and Cultural Organization (UNESCO).
The IOC promotes international cooperation, coordinates programs and develops capacity in marine research, services, observation systems and hazard mitigation.
As the nominated Australian government agency, we engage with Australian marine science stakeholders to:
- represent the government's position at governing body sessions
- contribute to IOC programs and activities.
We're engaged in the:
- IOC Assembly
- Executive Council
- intergovernmental coordination groups for the Indian Ocean and Pacific Ocean Tsunami Warning and Mitigation Systems
- other advisory and coordination bodies
- co-sponsorship and hosting of the IOC Secretariat for the Intergovernmental Coordination Group for the Indian Ocean Tsunami Warning and Mitigation System.
For more information about how we protect coastal communities from tsunamis, see our Tsunami knowledge centre.
International Civil Aviation Organization
The International Civil Aviation Organization (ICAO) is the UN specialised agency that manages the administration and governance of the Convention on International Civil Aviation (Chicago Convention).
The Chicago Convention sets out the standards and recommended practices for meteorological services for international aviation. The aim of these is to contribute to the safety, regularity and efficiency of international air navigation.
Meteorological Authority Office
As a signatory to the Chicago Convention, Australia must comply with the obligations and responsibilities set out in the Convention. The Australian Government has delegated some of these responsibilities to the Bureau, and our CEO and Director of Meteorology.
The Bureau is the designated meteorological authority for Australia under the Chicago Convention. Our Meteorological Authority Office represents us in this role.
Find out more on our Meteorological Authority Office page.
Meteorology Five Eyes Community of Practice (MET5)
MET5 brings together military and civilian meteorological entities. They work to support the objectives of the Five Eyes nations' defence strategies. These nations include Australia, Canada, New Zealand, the United Kingdom and the United States.
Meteorological information is critical to military operations and security. This includes aviation, energy, food and economic security. MET5 provides data and advice on:
- climate
- atmosphere
- hydrology
- oceanography
- space.
International collaboration across meteorological agencies helps ensure resilience, data assurance and security. MET5's vision is to:
- leverage our special trust to broadly and transparently share our capabilities and gaps
- focus our efforts specifically on objectives that improve our nations' defence and security.
Learn more about how the Bureau supports National security.
Research and operational partnerships
We partner with other national meteorological and hydrological services on global research and operational projects. For details, see our Research and development section.