


Seasonal Climate Outlook Archive
Frequently Asked Questions
MEDIA RELEASE - ISSUED 4th AUGUST 1998
Seasonal Climate Outlook Summary: 3-month rainfall probabilities for August to October 1998
Patterns favour more wet weather in north and east
The Bureau of Meteorology's rainfall outlook for August to October is that there is a significant chance of above average rainfall across much of northern and eastern Australia.
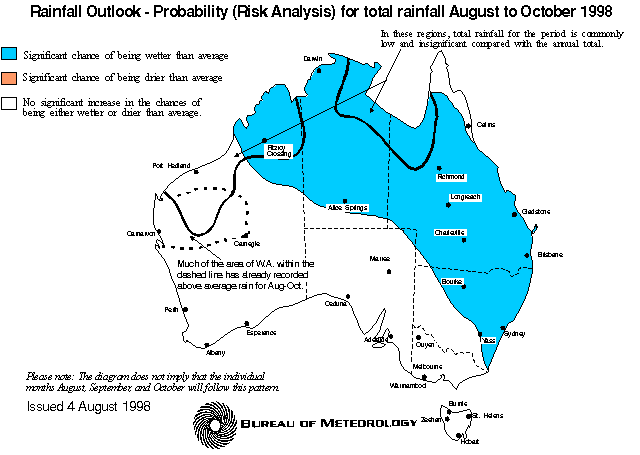
The Bureau's analysis of the latest climate data points to a significant probability of the coming three months being among the wettest third on record in those areas shown on the accompanying map.
They are:
- WA - the Kimberley and part of the northeast interior.
- NT - all of the region except for the far south.
- Qld - all of the region except for some northern and eastern areas of Cape York.
- NSW - northeast of a line from Tibooburra to Bega.
Much of this region has already been wetter than normal since April, most notably across northern New South Wales. Flood affected areas therefore remain at risk of further problems.
The recent spate of wet weather through parts of eastern Australia is linked with rising values of the Southern Oscillation Index (SOI). The SOI showed another moderate rise in July to +15, following the +10 in June. In addition, recent SOI trends account for the continued high chance of wetter than average weather in the north and east.
Also noteworthy are the warmer than normal sea temperatures surrounding tropical Australia. These warm seas increase the amount moisture which can be converted to rainfall by transient weather systems.
The warm tropical oceans are likely to be the main cause of the above average rainfall recorded over much of Western Australia during recent months.
In the longer term, the continued development of a La Niña in the Pacific Ocean looks almost certain. Computer models are nearly unanimous in their predictions of this, although the precise timing and strength remain unclear. Recent SOI movements and strong cooling of the central and eastern Pacific, are both consistent with the early stages of La Niña.
For more information regarding this outlook please contact Grant Beard on (03) 9669 4527, Robert Fawcett on (03) 9669 4603, Joe Courtney on (03) 9669 4288, or Clare Mullen on (03) 9669 4296.
| Frequently Asked Questions |
|---|
|
Q: WHAT ARE THE BUREAU OF METEOROLOGY'S
SEASONAL CLIMATE OUTLOOKS? A:General statements about the probability or risk of wetter or drier than average weather over a three-month period. The outlooks are based on the statistics of chance (the odds) taken from rainfall and sea surface temperature records. They are not, however, categorical predictions about future rainfall, and they are not about rainfall within individual months of the three-month outlook period. Q: WHAT DO WE MEAN BY WETTER OR DRIER THAN "AVERAGE", OR WARMER OR COOLER THAN "AVERAGE"? A:Being above or below the MEDIAN rainfall, MEDIAN maximum temperature, or MEDIAN minimum temperature over the three-month outlook period. The median is the middle value in the historical record for the period in question. In the long term, rainfall or temperature are above median in one half of years, and below median in the other half. Example 1: For the July to September period at Mackay in Queensland, one-half of 3-month rainfall totals have been below 80mm, and one-half have been above. If rainfall was above 80mm in that period it would be "wetter than average" or above median. Over the long haul there is a 50% chance of this occurring. In terms of odds this is even money. Example 2: In Sydney, one-half of summers (Dec-Feb) have a mean maximum temperature above 25.7°C, with the other half being below. Therefore 25.7°C is the median. Note that the mean or average maximum temperature is the average of all the daily highest temperatures for the period. Similarly, the mean or average minimum temperature is the average of all the daily lowest temperatures for the period Q: HOW ACCURATE ARE THE OUTLOOKS? A: In the places and seasons where the outlooks are most skilful, the category of the eventual outcome (above or below median) is consistent with the category favoured in the outlook about 75% of the time. In the least skilful areas, the outlooks perform no better than random chance or guessing. The rainfall outlooks perform best in eastern and northern Australia between July and January, but are less useful in autumn and in the west of the continent. The skill at predicting seasonal maximum temperature peaks in early winter and drops off marginally during the second half of the year. The lowest point in skill occurs in early autumn. The skill at predicting seasonal minimum temperature peaks in late autumn and again in mid-spring. There are also two distinct periods when the skill is lowest - namely late summer and mid-winter. However, it must always be remembered that the outlooks are statements of chance or risk. For example, if you were told there was a 50:50 chance of a horse winning a race but it ran second, the original assessment of a 50:50 chance could still have been correct. Q: WILL CATEGORICAL OUTLOOKS EVER BE ISSUED? (Eg. It WILL be drier than average.) A: Very unlikely. There is a certain level of natural variability in the climate which is chaotic and unpredictable. This is particularly the case with rainfall. For example, rainfall in a season can be significantly above average in one region, and significantly below average less than 50km away. Q: HOW SHOULD THE OUTLOOKS BE USED? A: As another tool in risk management and decision making. The benefits accrue from long-term use, say over 10 years. At any given time, the probabilities may seem inaccurate, but taken over several years, the advantages of taking account of the risks will outweigh the disadvantages. For more information on the use of probabilities, farmers could contact their local departments of agriculture or primary industry. |
| Definitions and Explanations.... |
|---|
|
THE SOUTHERN OSCILLATION INDEX (SOI) is calculated using the barometric pressure difference between Tahiti and Darwin. The SOI is one indicator of the stage of El Ni�o or La Ni�a events in the tropical Pacific Ocean. It is best considered in conjunction with sea-surface temperatures, which form the basis of the outlooks. A strongly negative SOI (below -10) is characteristic of El Ni�o, which is often associated with below average rainfall over eastern Australia, and a weaker than normal monsoon in the north. A strongly positive SOI (above +10) is characteristic of La Ni�a, which is often associated with above average rainfall over parts of tropical and eastern Australia, and an earlier than normal start to the northern monsoon season. El Niño & La Niña El Ni�o translates from Spanish as "the boy-child", and refers to the extensive warming of the central and eastern Pacific Ocean. La Ni�a translates from Spanish as "the girl-child", and refers to the extensive cooling of the central and eastern Pacific Ocean. The term has recently become the conventional label for the opposite of El Ni�o. See http://www.bom.gov.au/climate/glossary/elnino.shtml for more on SOI and El Ni�o. |
[an error occurred while processing this directive]