


About Daily Rainfall Data
Introduction
Historical daily rainfall data are provided from this product in a variety of formats - web (html), data (csv), graphical, and print (pdf). In addition, there is a tool to compare data against related climate statistics.
The table of daily rainfall data
- Above the table of data
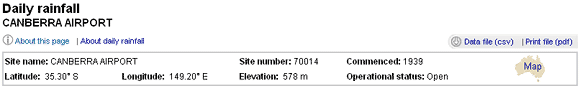
Important information at the top of the page.
Near the top of the data table page are links to Help Pages, including this information page. Also at the same location are links to download one or all years of rainfall data in text file format (.csv files) suitable for importing into spreadsheets and pdf format for printing. These files are created at the same time as the html page and automatically removed from the web site after a short time. Thus a stored link to one of these files (such as a Bookmark or Favorite in your browser) may not work for very long after it was created.
Information about the observing station is provided below these links to help assess how applicable the data are for your needs. A basic site summary and topographic map of the area around the observing station are provided by clicking on the 'Details' link that is over map icon.
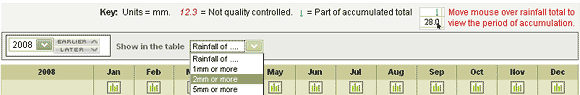
Key information about the data table
Guidance about how the measurement units, quality of the data, and accumulated totals are displayed in the data table is provided directly above the table. Another year of data can be selected by either using the "Earlier" and "Later" buttons at the top left of the table, or selecting the year from the drop-down list of years for which there are data available. There is also a tool which can highlight rainfall totals of or above certain totals (thresholds in the Days of Rain climate maps). This highlighting tool does not detect whether the rainfall amount is a one day total or multi-day accumulated total.
- The table of data
Information provided at the top of the data table.
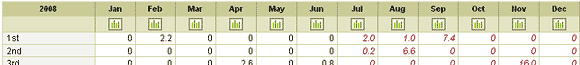
In the top left of the table is the year in which the data were measured. The row below contains links to graphs of the daily rainfall for each month of the year. Following this are the rainfall observations, with the day of the month in the left column. For each day of the year a table cell may contain:
- A number in normal black text - a rainfall observation which has completed quality control.
- A number in red italic text - a rainfall observation which has not completed quality control.
- A blank cell - no rainfall total is available for that day.
- A downward-facing arrow - this represents an accumulated rainfall total
- A rainfall total for the day following an accumulation - this is the multi total. The number of days in the accumulated total can be seen by placing the mouse over the table cell with the accumulated total.
- The bottom of the table of data
Information at the bottom of the data table
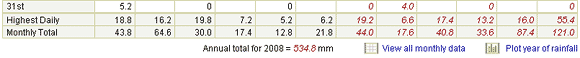
The highest one day total in rainfall for each month is provided at the bottom of the data table. Below that is the monthly total. The monthly total rainfall is stored in a different database to the daily rainfall, and receives additional steps in the data processing. As a result, there are infrequent occasions when the total of the daily values in the data table do not agree with the monthly total at the bottom of the data table. If there is a difference between the two the monthly value should be used.
The total rainfall for the year is provided directly below the table of data. It is listed as being not available if there are missing monthly data. A progressive total to end of the last complete month is provided if the table being displayed is for the current year. Next to the annual total is a link to the full record of monthly data, and a link to a graph of the year of rainfall.
Summary rainfall statistics
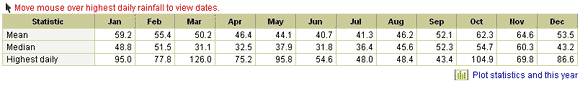
Summary statistics at the bottom of the data table.
Below the main table of data is a summary table of rainfall statistics related to the data in the main table, and a link to plot these statistics. These statistics are calculated over all available years of data. The mean and median are not provided if there are less than 20 years of data. Dates associated with the highest daily rainfall can be seen by moving your mouse over each of the data in the table. The most recent date will be displayed if there is more than one occurrence for that month. Dates are also included in the data files and print files.
Finally, at the bottom of the page is the Bureau's product code for this page, and a unique reference number. Please record this number if you need to contact the Bureau about any aspect of the data you have retrieved. Further information is available from the Bureau, and there may be a charge associated with this service.
Graphical display of data
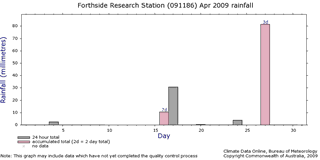
A graph of one month of daily rainfall
If you click on the graph icon within the main data table a graph of the corresponding month of data will be generated. Above the graph is a menu which will re-plot the graph for the newly selected time period. Within the graph accumulated totals of rainfall are plotted in a different colour, with the number of days over which the rainfall accumulated provided at the top. Missing data are represented by a cross.
Note that the graph may contain some data which have not fully completed the quality control process. You should refer to the table of data, or the text or pdf download files, to check on the status of the quality control of the data.
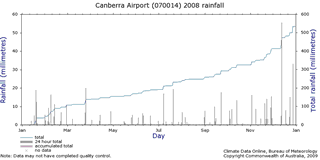
A graph of one year of daily rainfall
If you click on the yearly graph icon at the bottom of the main data table, or the annual menu button on the graph page, a graph of the corresponding year of data will be generated. This graph contains both a plot of the daily rainfall totals (accumulations are in a different colour) and a progressive total over the year. The daily accumulation totals do not have a numeric display of the period of accumulation. Gaps in the progressive total are associated with days which are part of an accumulated total. The progressive total graph will stop at the first occurrence of a missing observation (since we do not know what happened on that day).
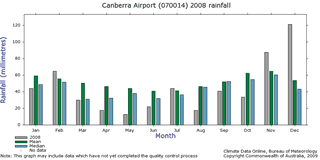
Monthly rainfall statistics graph
The final type of graph, accessible via a link at the bottom of the summary statistics table, plots the mean and median monthly rainfall totals (if available) against the corresponding monthly rainfall total for the year being displayed. The mean and median plot is not available if there is less than 20 years of data
