


About Climate Calendar
Introduction
The Climate Calendar provides an indication of what the weather has been like at a location for each day of the year. It is based on historical weather observations made at approximately 1700 Bureau weather stations. Because the weather at any time of year can vary significantly from one year to the next the Climate Calendar is a guide only, and should not be considered a forecast. You should also look at the monthly climate statistics for more information.
The table of typical weather shows 7 day averages around the selected day of the year; historical weather shows the conditions observed on that day of the year at the selected location, while "On this day" provides small snippets of weather information from around Australia which occurred on the selected day of the year.
Typical weather
For most locations the weather can change significantly from one day to the next, and for the same day from one year to the next. As the number of observations of the changeable weather increases, so too does our ability to include this range of weather conditions into what a typical day may be like. For this reason the Typical weather presented in the Climate Calendar is based on the average of the observations over a seven day period, including the three days either side of the day selected, using all years of available data. It is, in effect, the typical weather averaged over the week. The diagram below illustrates how this is calculated.
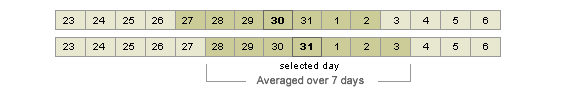
Seven day averaging is used in the calculation of typical weather temperatures and rainfall. The 7 days which are averaged include 3 days before and 3 days after the user-selected day.
A minimum of sixty observations are required before temperature or rainfall information is provided in the Typical Weather section. Observations for February 29 are not included in the typical weather calculations unless it is the day selected in the calendar. For example, the days used for deriving the Typical Weather for 27 February are (Feb. 24, 25, 26, 27, 28) and (Mar 01, 02).
The "Days with rain" statistics are calculated in a simple manner. All of the daily rainfall totals are grouped together and the number of dry days (rainfall = 0 mm) are counted. This count is then converted to a percentage of the total number of observations. In a similar way the percentage of days with at least 2 mm, 5 mm, 10 mm, and 25 mm are calculated. Note that because the intervals overlap the total by adding the percentages of each group does not have to add up to 100%.
Historical weather
The historical weather information is based only on observations made for the specific day of the year selected in the Climate Calendar. Thus there may be some differences between the average maximum and minimum temperatures and those provided under Typical weather, where a seven day averaging period is used. The extreme values - highest maximum temperature, lowest minimum temperature, etc. - have been automatically extracted from the climate database without any additional processing. On rare occasions one of these values may differ from the officially recognised rainfall and temperature extremes, which have been subject to an additional level of inspection (for example, removing values which may have been influenced by bush fires relatively close to the thermometer).
The highest and lowest values of maximum and minimum temperature are marked as uncertain (red, italic text) if either the observation has not yet passed through the Bureau's quality control process, or the observation for the previous day is missing, so that we can not be sure that the measured temperature was recorded on the selected day and not one of the previous, missing days (this is what is known as an accumulated temperature observation). Highest daily rainfall is similarly marked if it has not completed quality control, but any rainfall total accumulated over more than 24 hours is not included.
On this day
The "On this day" section includes brief summaries of Australian historical weather events. When there is more than one event listed for the day, click the ‘Events’ buttons below the "On this day" area, to see each event. Further information about many of these events is available via "Related data & information". If an event is listed as setting a record, it applies relative to the time it occurred and may have been subsequently replaced. For current records, see: Climate extremes. Damages amounts identified in events are estimates only and in the currency value of the time (ie. not converted to equivalent current dollars).
