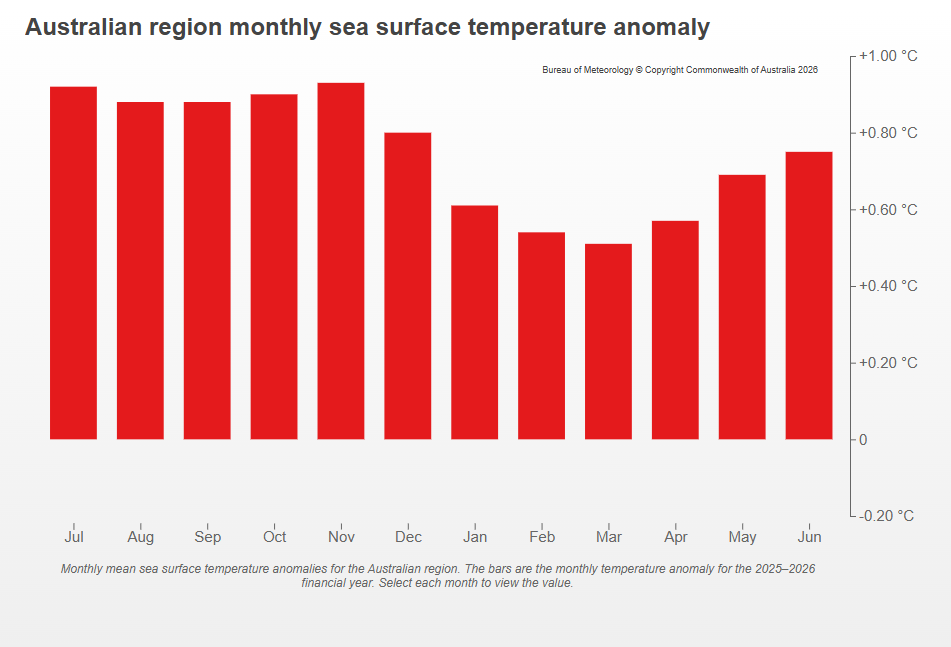
Australian region ocean temperatures second-warmest on record
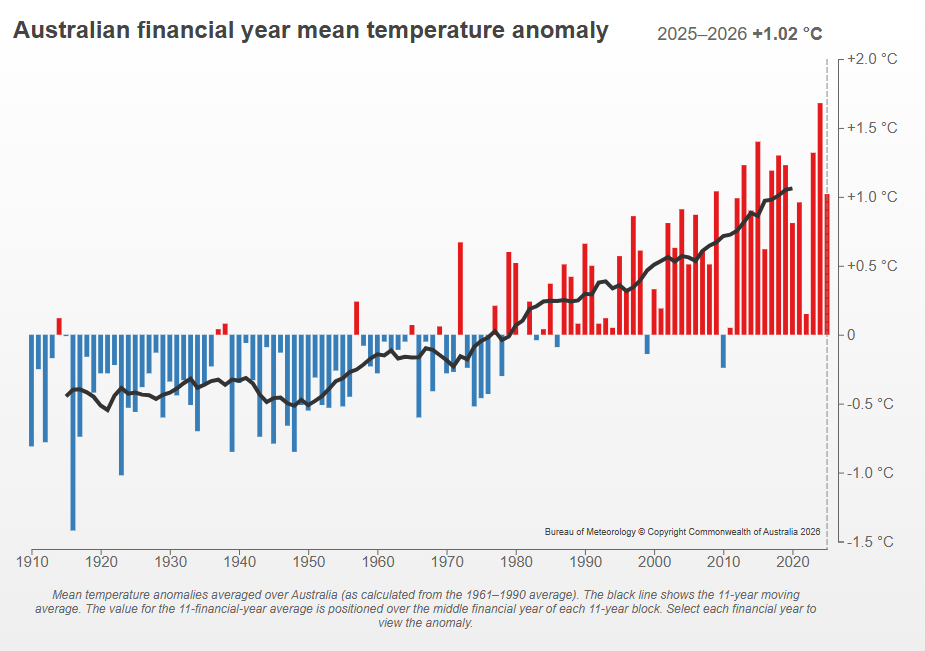
The 2025–26 financial year was Australia's ninth-warmest on record, with the area-averaged mean temperature 1.02 °C above the 1961–1990 average. Sea surface temperatures averaged over the Australian region were the second-warmest on record, at 0.75 °C above average.
Rainfall patterns varied across the country. Rainfall was above average across most of northern Australia, increasing soil moisture, streamflow and water storage levels. It was also above average across large parts of southern Australia. However, rainfall was below average for parts of the east, contributing to drier soils. Across southern Australia, streamflow was below average and surface water storage levels continued to decline.
Key statistics
Temperature
- Australia's area-averaged mean temperature for the 2025–26 financial year was 1.02 °C above the 1961–1990 average, the ninth-warmest on record since 1910–11.
- Australia's area-averaged maximum temperature was 1.06 °C above average and the minimum temperature was 0.97 °C above average, the fifth-warmest on record.
Rainfall
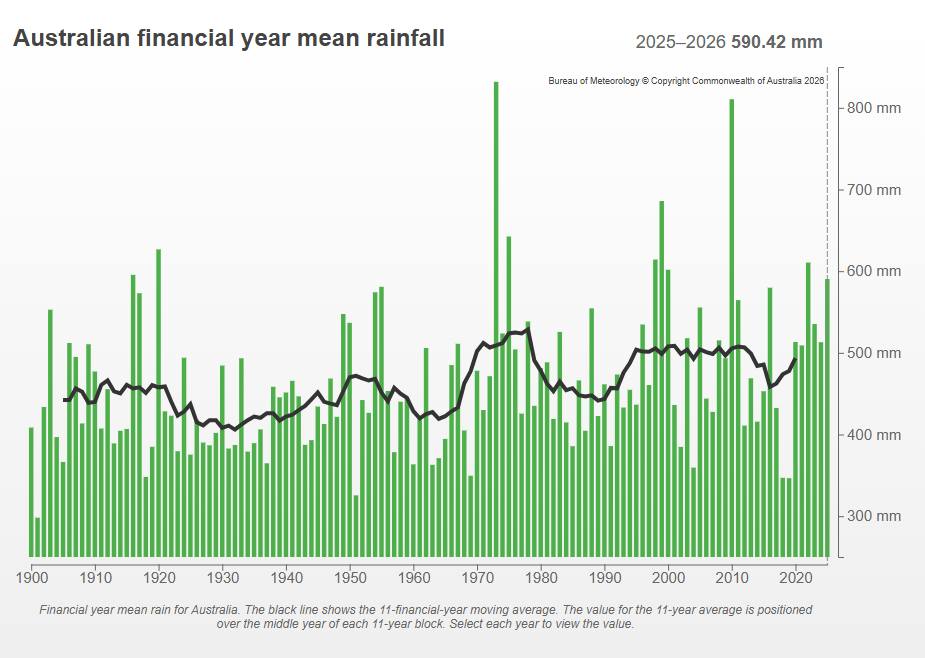
- Australia's area-averaged rainfall for the 2025–26 financial year was 27% above the 1961–1990 average at 590.4 mm and the 10th-wettest on record.
- Area-averaged rainfall across northern Australia was 39% above average, the eighth-wettest on record, and across southern Australia it was 7% above average.
Water resources
- Streamflow for the 2025–26 financial year was above average at approximately 27% of sites, mostly in Queensland and the Northern Territory, while for 28% of sites, mostly across the south, it was below average.
- Total surface water storage volume in Australia was 65% of available capacity at the end of the 2025–26 financial year, compared with 66% at the end of the 2024–25 financial year.
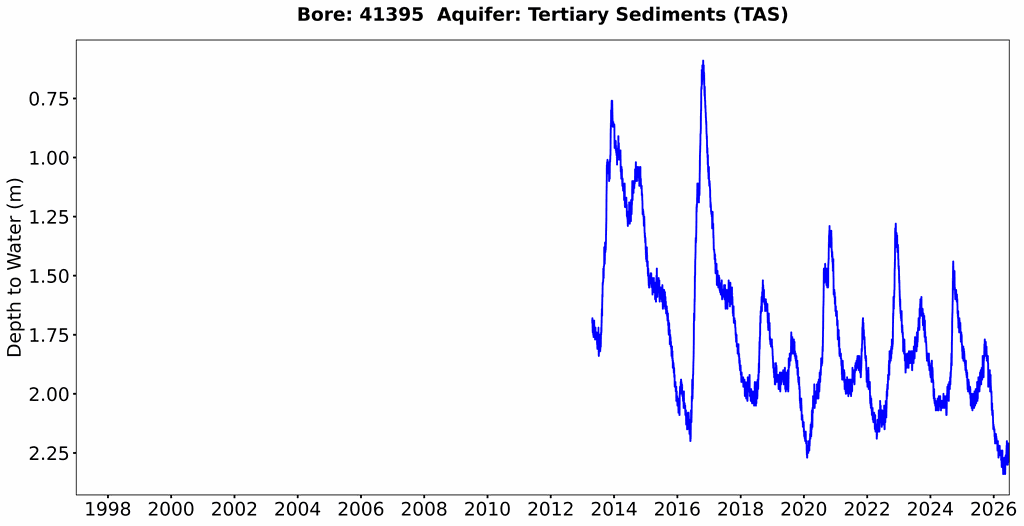
- Groundwater bore levels were above average for 40% of bores and below average for 30% of bores at the end of the 2025–26 financial year. This compares with 34% and 36% in the previous year, respectively.
Oceans and Atmosphere
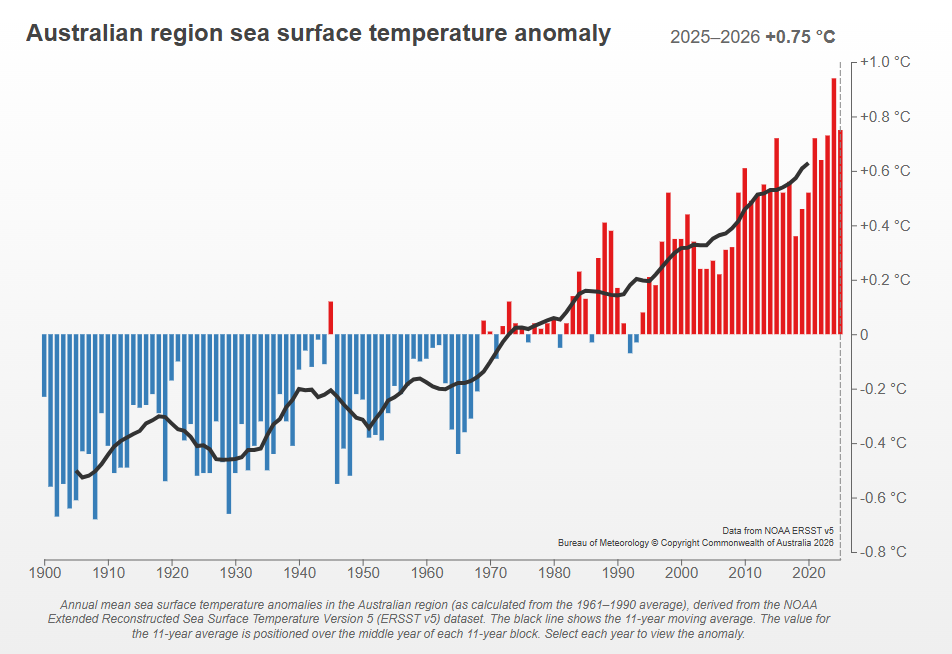
- Sea surface temperatures averaged over the Australian region for the 2025–26 financial year were 0.75°C above the 1961–1990 average, the second-warmest on record.
- La Niña developed in late spring 2025 and returned to neutral conditions by early March 2026, followed by El Niño conditions emerging in early March and becoming established by mid-June 2026.
Tropical Cyclones
- There were 11 tropical cyclones in the Australian region during the 2025–26 financial year, compared to the average of 10 for all seasons since 1980–81.
- Four systems (Fina, Luana, Hayley and Narelle) made landfall on the Australian mainland at tropical cyclone strength (at least Category 1) and two (Mitchell and Koji) made landfall at tropical low strength.
The national area-averaged mean temperature in the 2025–26 financial year was 1.02 °C above the 1961–1990 average, the ninth-warmest on record since 1910–11. Australia's area-averaged mean temperature for all months was above average, with October 2025 and January, May and June 2026 among their respective top 5 warmest on record.
The area-averaged mean temperature for all states and territories was above average, and New South Wales, Victoria and South Australia had their respective top 10 warmest July to June periods on record.
Temperature
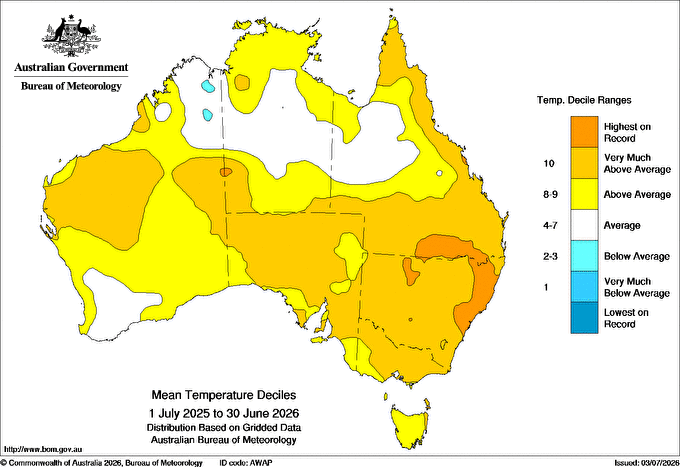
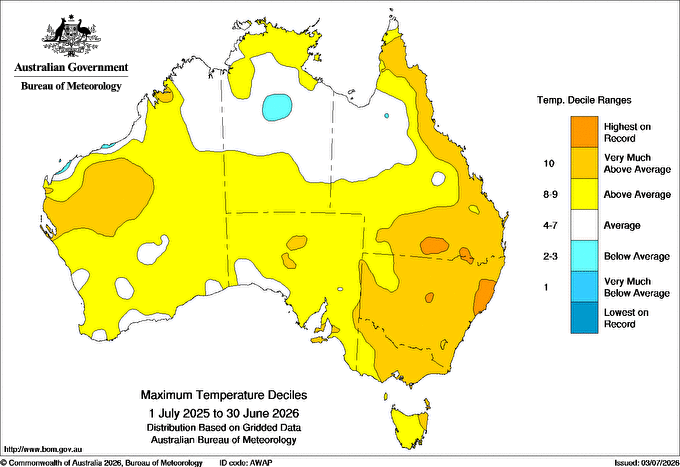
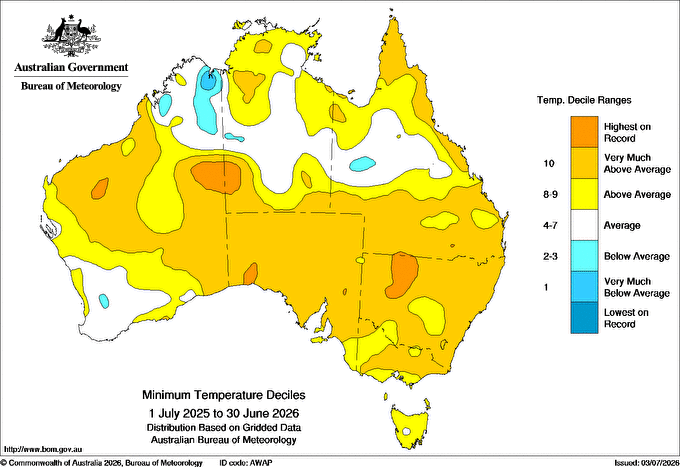
Maximum temperature
Australia's area-averaged maximum temperature for the 2025–26 financial year was 1.06 °C above average, the 13th-warmest on record since 1910–11.
For the 2025–26 financial year, maximum temperatures were above to very much above average (in the warmest 10% of July to June periods since 1910–11) for much of Australia and the warmest on record for the mid-north coast of New South Wales and parts of southern Queensland. Maximum temperatures were below average for an area of inland Northern Territory.
Minimum temperature
Australia's area-averaged minimum temperature for the 2025–26 financial year was 0.97 °C above average, the fifth-warmest on record.
For the 2025–26 financial year, minimum temperatures were above to very much above average for much of the country and were the warmest on record for:
- an area of northern New South Wales
- an area of eastern Western Australia extending into western Northern Territory
- a small area of the inland Pilbara region of Western Australia and a pocket of western coastal of South Australia.
Minimum temperatures were below to very much below average (in the coolest 10% of July to June periods since 1910–11) for parts of the Kimberley region in Western Australia and a small area of western Queensland.
Monthly temperature
In 2025–26, Australia's area-averaged mean temperatures were warmer than average for all months. October, January, May and June were within their respective top 5 warmest on record since 1910.
Minimum temperatures in winter 2025 were below average for large parts of northern and southern Australia as a result of cooler southerly airflow reaching inland areas throughout the season.
Spring 2025 was the ninth-warmest spring on record, at 1.42 °C above average. October 2025 was the third-warmest October on record nationally, with highest on record temperatures across parts of eastern and northern Australia. In November, temperatures were below average for Victoria, Tasmania and South Australia as successive cold fronts crossed the region.
Summer 2025–26 was the eighth warmest on record, at 1.10 °C above average. January 2026 was the fourth-warmest January on record. Severe to extreme heatwave conditions impacted large parts of the west interior and south of the country in January. Maximum temperatures during February and March were below average across much of northern and central Australia, due to increased cloud cover associated with above-average rainfall from tropical systems.
Between April and June, slow moving and strong high pressure systems dominated southern Australia. These systems, generally associated with clear skies and light winds, contributed to warmer than average temperatures. Many sites across south-eastern Australia had their warmest May or June maximum and minimum temperatures on record.
Climate change
Australia's climate has warmed by 1.59 ± 0.23 °C between 1910 and 2025, with most of the warming having occurred since 1950. Every decade since 1950 has been warmer than preceding decades, and Australia's 10 warmest financial years have occurred since 2009–10. The observed warming in Australia is consistent with the average warming across the Earth's land areas.
Area-average temperatures
| Maximum Temperature | Minimum Temperature | Mean Temperature | |||||||
|---|---|---|---|---|---|---|---|---|---|
| Rank (of 116) |
Anomaly (°C) |
Comment | Rank (of 116) |
Anomaly (°C) |
Comment | Rank (of 116) |
Anomaly (°C) |
Comment | |
| Australia | 104 | +1.06 | 112 | +0.97 | 5th highest | 108 | +1.02 | 9th highest | |
| Queensland | = 101 | +1.06 | 104 | +1.19 | = 103 | +1.13 | |||
| New South Wales | 111 | +1.91 | 6th highest | 113 | +1.53 | 4th highest | 114 | +1.72 | 3rd highest |
| Victoria | 104 | +0.97 | 110 | +0.93 | 7th highest | = 108 | +0.96 | equal 8th highest | |
| Tasmania | 95 | +0.50 | = 87 | +0.25 | 94 | +0.38 | |||
| South Australia | 101 | +1.18 | = 114 | +1.36 | equal 2nd highest | 109 | +1.27 | 8th highest | |
| Western Australia | 101 | +1.10 | 105 | +0.69 | 105 | +0.90 | |||
| Northern Territory | 89 | +0.41 | 93 | +0.61 | = 91 | +0.52 | |||
Australia's area-averaged total rainfall for the 2025–26 financial year was 590.4 mm, 27% above the 1961–1990 average, and the tenth-wettest on record since 1900–01. Area-averaged rainfall for northern Australia was 39% above average, the eighth-wettest on record. Rainfall across southern Australia was 7% above average overall, but below average in inland areas of New South Wales and southern Queensland, and in parts of south-west Western Australia.
Rainfall
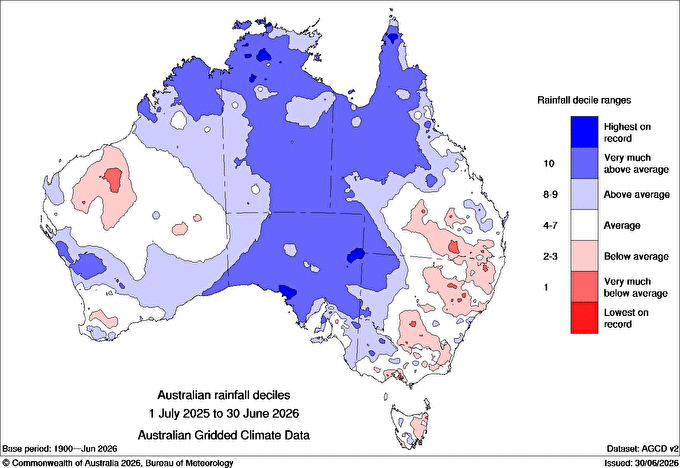
for the 2025–26 financial year, relative to all years since 1900.
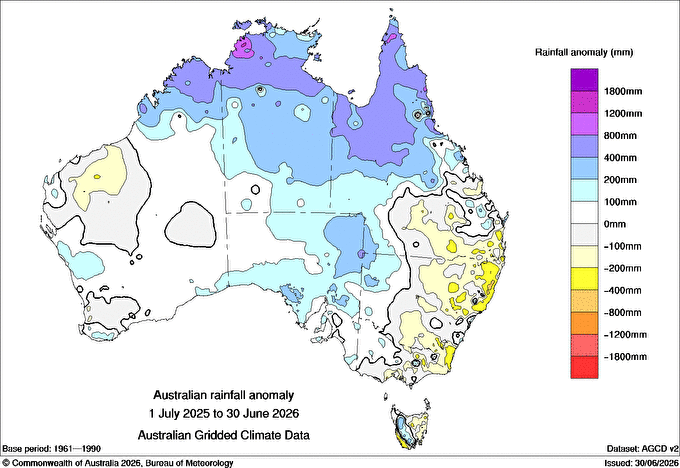
for the 2025–26 financial year, relative to all years since 1900.
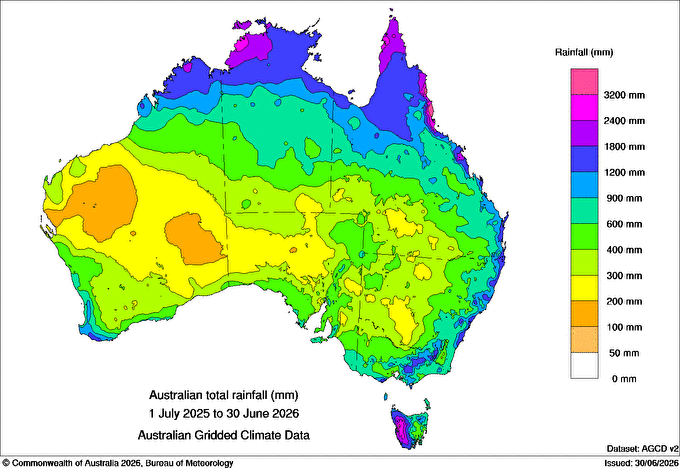
for the 2025–26 financial year.
Overall
Australia's area-averaged rainfall total for the 2025–26 financial year was 590.4 mm, which was 27% above the 1961–1990 average of 466.0 mm and the tenth-wettest on record since 1900–01.
For northern Australia (north of 26°S, including the South Australia and Northern Territory border region), total rainfall for the financial year was 735.0 mm, which was 39% above the 1961–1990 average and the eighth-wettest on record. For the wet season period (October 2025 to April 2026), northern Australia's total rainfall was 686.8 mm, which was 44% above average and the seventh-wettest on record.
For southern Australia (south of 26°S), total rainfall was 421.8 mm, which was 7% above average and the wettest July to June period since 2022–23.
Rainfall was above to very much above average (wettest 10% of all July to June periods since 1900–01) for:
- the Northern Territory
- northern and western Queensland
- the Kimberley, Central West and much of the Interior districts of Western Australia
- South Australia, northern and western Victoria, and western New South Wales.
Rainfall was the highest on record for parts of:
- the Daly and Katherine River catchments in the Northern Territory
- northern Cape York in Queensland
- north-east and western coastal South Australia.
Rainfall was below to very much below average (driest 10% of all July to June periods since 1900–01) for:
- parts of the inland Pilbara and Gascoyne regions and the south-west of Western Australia
- inland and eastern areas of New South Wales and southern Queensland
- eastern Tasmania and an area of the south-west coast
- southern and eastern parts of Victoria.
Monthly rainfall
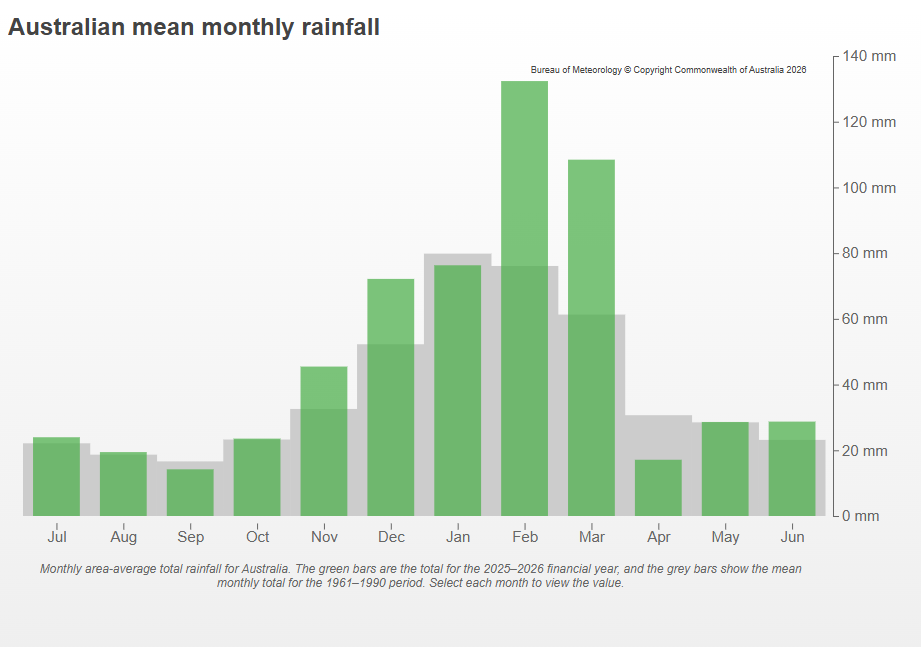
In November Severe Tropical Cyclone Fina brought record rainfall across northern parts of the Northern Territory Top End and the Kimberley region in Western Australia. The onset of the monsoon trough in December 2025 led to widespread rainfall and flooding across northern and western Queensland, which continued into January.
February and March saw a number of slow-moving tropical lows and inland troughs which brought widespread heavy rainfall, wet soils and riverine flooding to much of northern Australia. Cold fronts crossing the south-east of the country connected with the tropical moisture to extend the heavy rainfall into South Australia, western New South Wales and Victoria.
It was the fourth-wettest February on record (since 1900) for northern Australia overall. February rainfall was the highest on record for:
- parts of the Simpson and Tanami districts in the Northern Territory
- much of the North East Pastoral district in South Australia and adjoining areas in far west Queensland and New South Wales.
Across Lake Eyre Basin (the drainage division for Kati Thanda-Lake Eyre) February was the third-wettest month on record for any month since 1900, with more than 3.5 times its monthly average.
It was the eighth-wettest March on record for northern Australia overall. Heavy rainfall from tropical low 31U caused major flooding along the Daly and Katherine Rivers in the Northern Territory. Highest March rainfall on record occurred across:
- much of the Northern Territory Top End
- much of eastern South Australia
- pockets of northern Cape York and the Wide Bay and Burnett districts in Queensland.
Short-term serious to severe rainfall deficiencies (lowest 10% or 5% of rainfall on record respectively) emerged in inland north-eastern New South Wales and south-eastern Queensland between August 2025 and April 2026. The largest rainfall deficiencies, including lowest on record rainfall in some areas, lasted from January to April. Persistent slow-moving high pressure systems over eastern Australia and in the Tasman Sea resulted in hot and settled conditions and blocked rain-bearing systems from reaching much of inland eastern Australia during this period. Above average rainfall in May cleared short-term deficiencies in eastern Australia.
In May and June unseasonable rainfall fell on parts of northern Australia from a series of north-west cloud bands.
Above average rainfall also occurred across much of southern Australia in June 2026, with multiple cold fronts crossing the region.
Climate change
State of the Climate 2024 reported that northern Australia has been wetter than average in recent decades, especially in the north-west during the northern wet season. Wet season rainfall in northern Australia for the last 30 seasons, since 1996–97, has been 23% above the 1900–1995 average.
There has also been a decline in cool season (April to October) rainfall over the south-west and south-east of Australia in recent decades, with more high pressure systems, and less rain bearing low pressure systems and cold fronts. Cool season rainfall across southern Australia for the last 30 seasons, since 1996, has been 8% below the 1900–1995 average.
Area-average rainfall
| Rank (of 126) |
Average (mm) |
Departure from mean |
Comment | |
|---|---|---|---|---|
| Australia | 117 | 590.4 | +27% | 10th highest |
| Queensland | 118 | 824.2 | +32% | 9th highest; highest since 2011 |
| New South Wales | 61 | 500.0 | −10% | |
| Victoria | 71 | 646.1 | −3% | |
| Tasmania | 56 | 1328.0 | −2% | |
| South Australia | 122 | 355.4 | +59% | 5th highest; highest since 2011 |
| Western Australia | 95 | 398.2 | +16% | |
| Northern Territory | 121 | 835.7 | +53% | 6th highest; highest since 2011 |
| Murray-Darling Basin | 52 | 440.6 | −11% |
Water
Soil moisture for the 2025–26 financial year was above to very much above average across much of northern and central Australia, largely driven by tropical activity. Soil moisture was below to very much below average in parts of the south-west and south-east due to dry conditions for much of the period.
Soil moisture
Overall
Soil moisture in the root zone (top 100 cm) was above average for much of northern and central Australia. It was very much above average (in the highest 10% of all July to June periods since 1911–12) for:
- large parts of northern and western Queensland
- most of the Northern Territory and South Australia and adjacent parts of New South Wales
- northern Western Australia.
The wet soil conditions were largely due to tropical activity during the wet season (October 2025 to April 2026), particularly from late December to March. This contributed to high runoff and widespread riverine flooding, particularly in northern and western Queensland, the Northern Territory Top End and the Lake Eyre Basin (the drainage division for Kati Thanda-Lake Eyre).
Root zone soil moisture was below to very much below average (in the lowest 10% of all July to June periods since 1911–12) for:
- much of the Pilbara and Gascoyne regions and parts of the south-west of Western Australia
- large parts of the Murray–Darling Basin, notably in north-eastern New South Wales and southern Queensland
- parts of western and central Victoria
- much of eastern Tasmania.
The dry soils in these regions were associated with below average rainfall for much of the July to June period, and frequently warmer than average conditions.
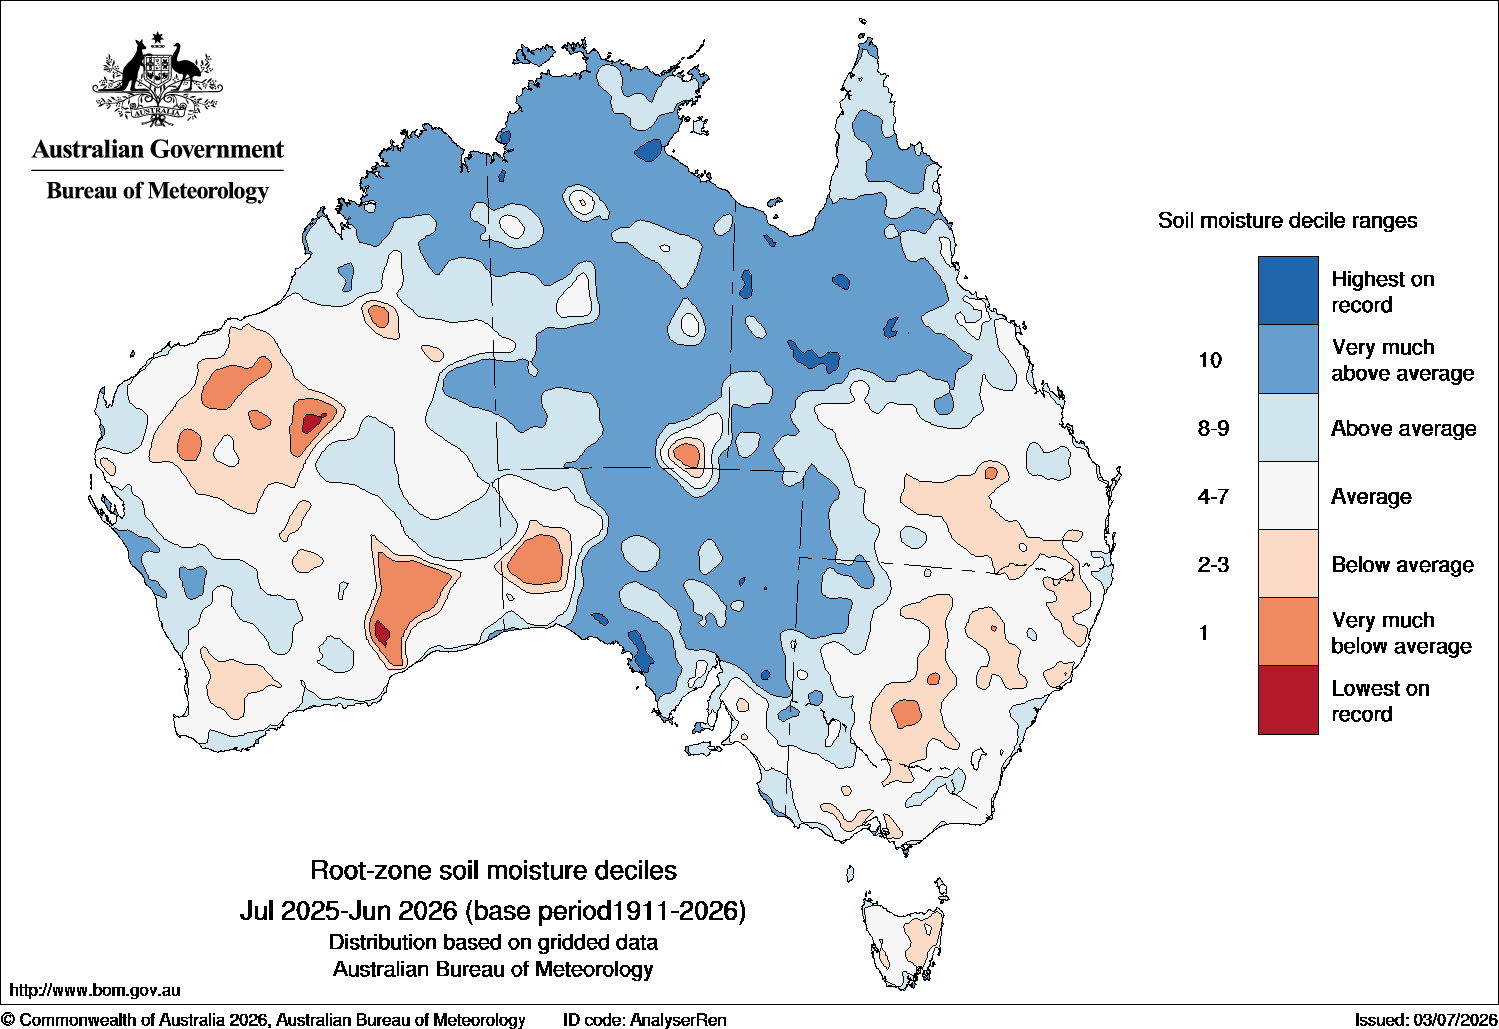
July to December 2025
At the start of the 2025–26 financial year, root zone soil moisture was above to very much above average in areas of northern Australia and along coastal New South Wales. From July to December, northern Australia experienced wetter-than-average conditions, including the wettest December on record for parts of Queensland from the Gulf Country into the Central West. In contrast, southern inland parts of New South Wales and northern Victoria experienced drier-than-average conditions for the second half of 2025, along with much of South Australia. Consequently, by the end of December, soil moisture was high across much of the country, while soil moisture was very much below average in scattered pockets across southern parts of the mainland.
January to June 2026
Rainfall in February and March 2026 was above average for most of country, except for north-east New South Wales, Tasmania and an area in the west of Western Australia. A large part of the country extending from the Kimberley and Top End, through central Australia to South Australia and eastern parts of Queensland, New South Wales and Victoria had very much above average rainfall (rainfall in the wettest 10% of all February–March periods since 1900). As a result, root zone soil moisture for March 2026 was very much above average for those parts, and in many places the highest on record. However, soil moisture remained below average throughout the financial year across southern parts of Western Australia, south-west Victoria and Tasmania. This was largely due to drier-than-average conditions and rainfall deficiencies that have persisted in these regions since April 2023.
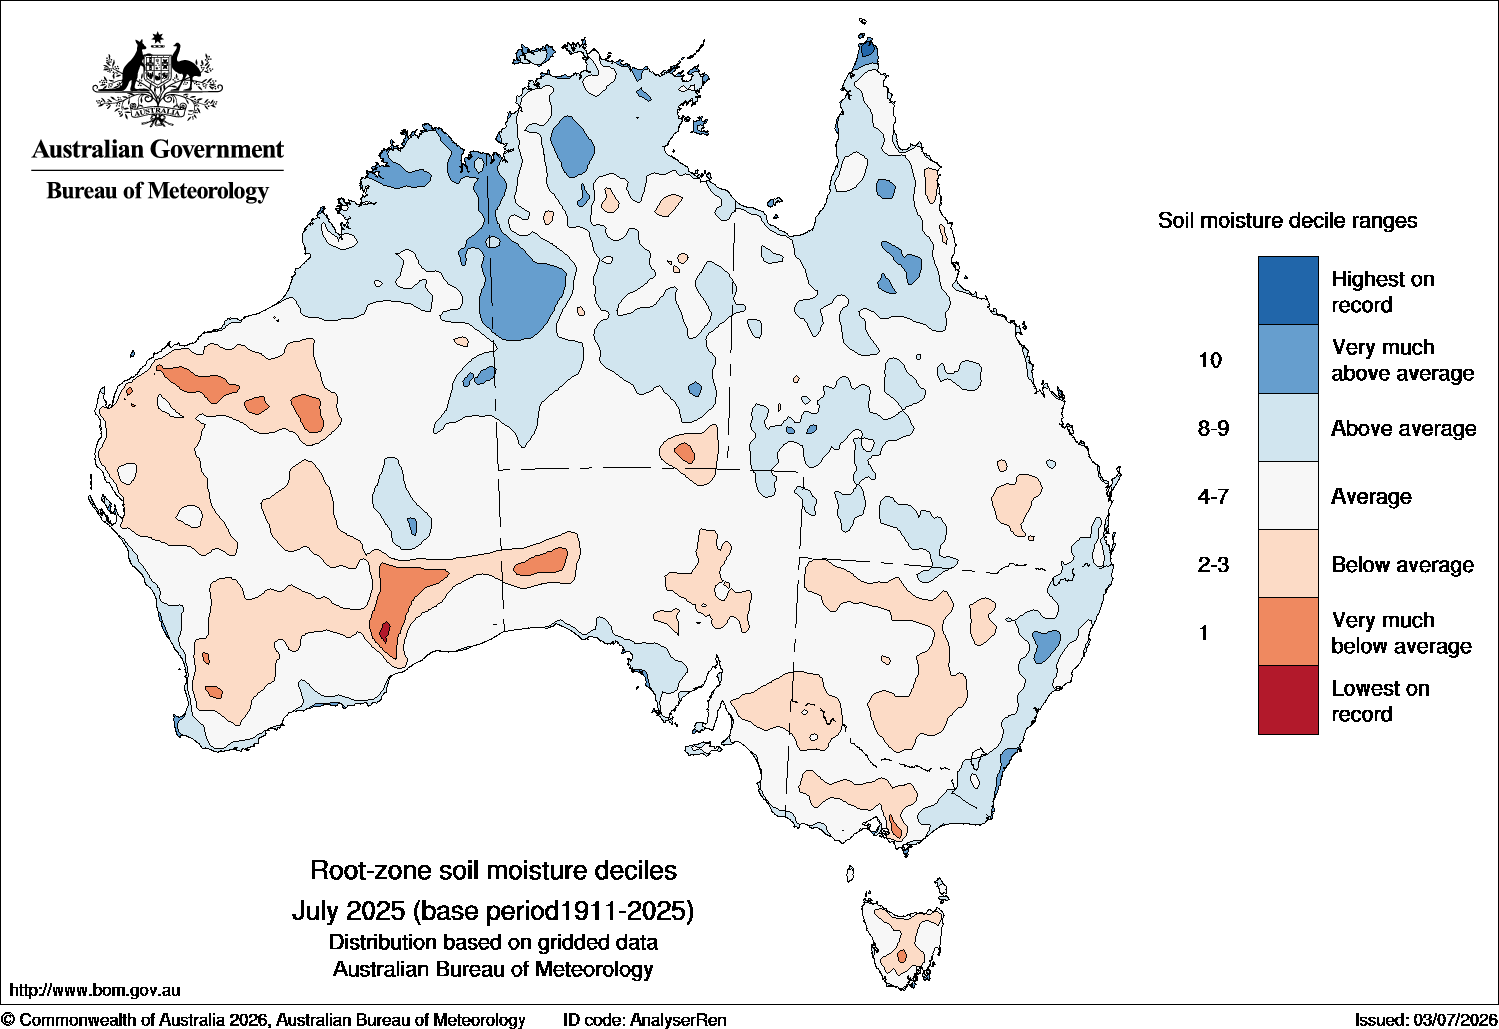
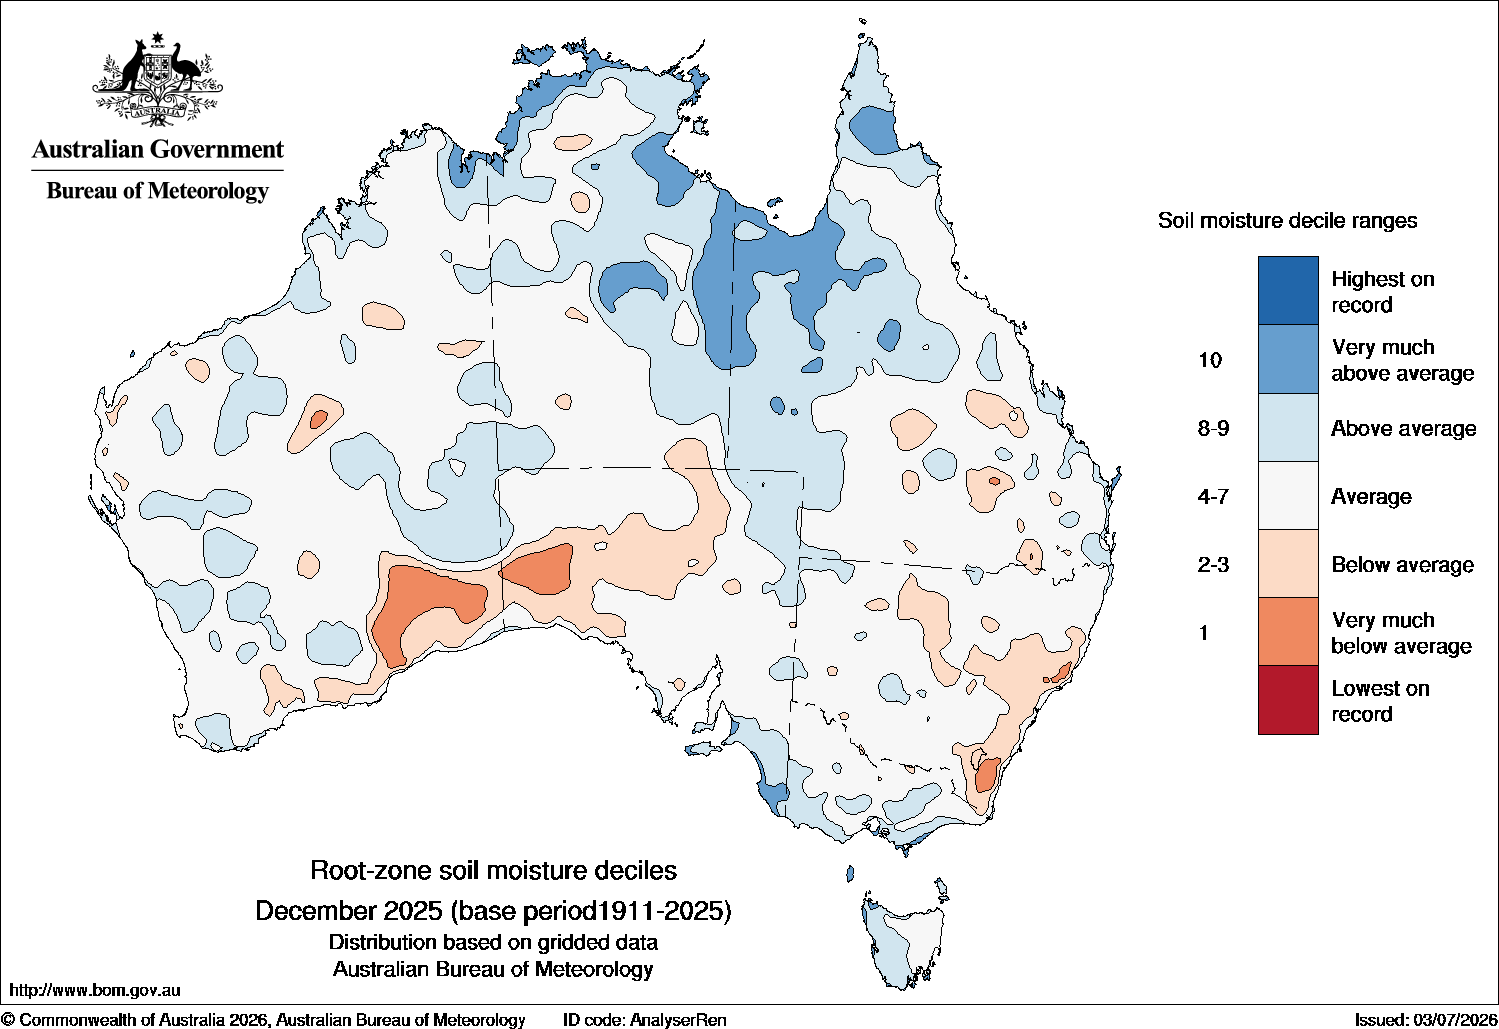
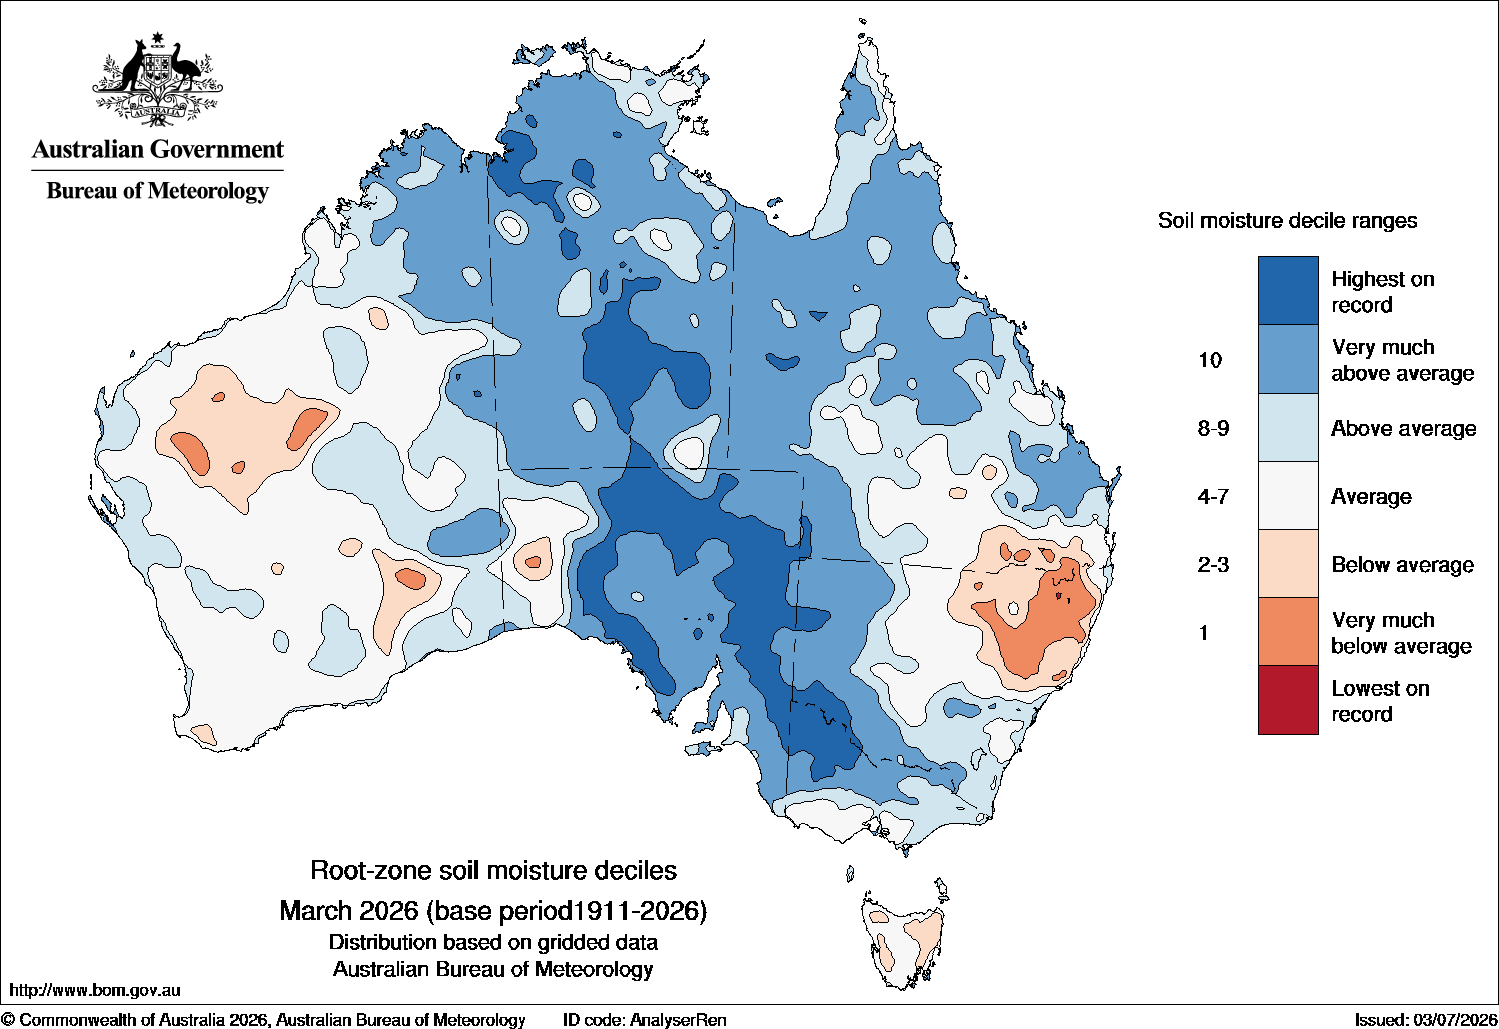
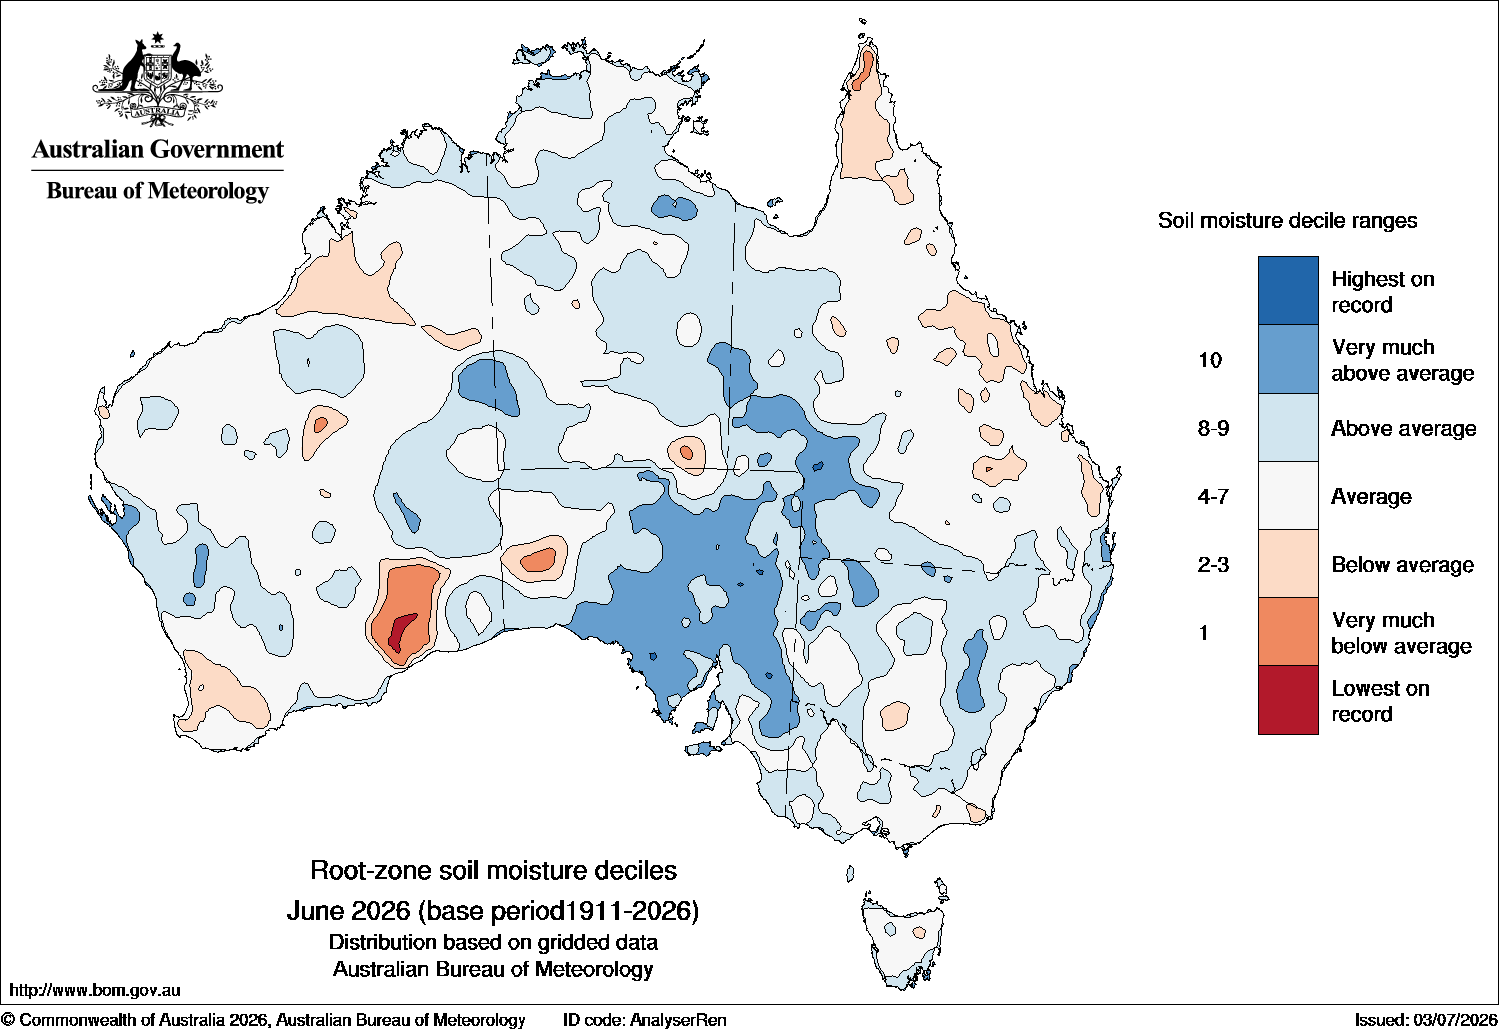
Throughout the 2025–26 financial year, streamflow was above average in northern, central and western Queensland, the Northern Territory, northern Western Australia and south-eastern areas of South Australia. Parts of these regions had major riverine flooding. Streamflow was below to very much below average in parts of the Murray–Darling basin, southern Victoria, south-eastern South Australia and eastern Tasmania.
Streamflow
Overall
In the 2025–26 financial year, streamflow was around average (relative to all July to June periods since 1975–76) at 45% of sites (of the 933 surveyed), across:
- much of south-east Queensland
- central and coastal New South Wales
- eastern Victoria
- northern Tasmania
- much of south-west Western Australia.
Streamflow was below to very much below average (lowest 10% of all July to June periods since 1975–76) at 28% of sites, across:
- south-western Queensland
- parts of northern and southern New South Wales
- north, central and south-western Victoria
- eastern Tasmania
- most sites in South Australia
- parts of the Lower West and Pilbara regions in Western Australia.
These areas had below average rainfall for much of the financial year.
Streamflow was above to very much above average (highest 10% of all July to June periods since 1975–76) at 27% of sites, across:
- much of Queensland away from the south
- all Northern Territory sites
- several sites across Western Australia.
This included highest on record streamflow at 2% of sites. In the north, the elevated flows were due to the impact of monsoon rains, inland troughs and tropical cyclones across the wet season, from October 2025 to April 2026.
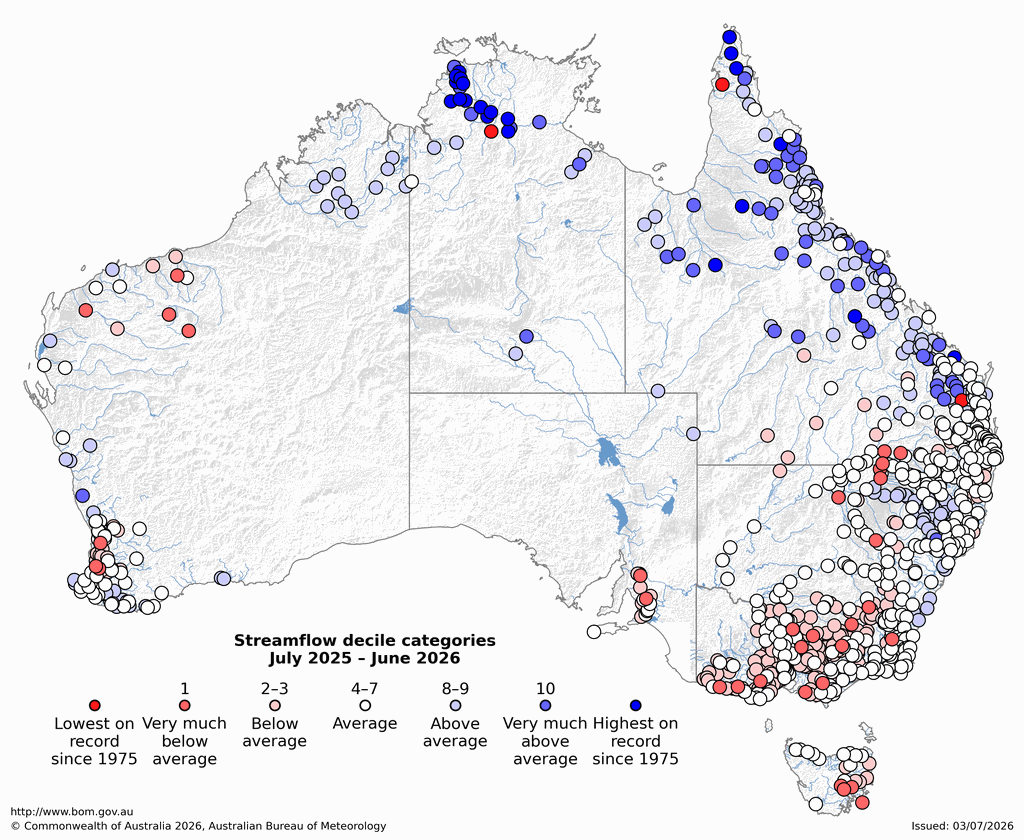
| Streamflow decile category | No of sites | Percentage of sites (%) |
|---|---|---|
| Highest on record | 22 | 2 |
| Very much above average | 49 | 5 |
| Above average | 180 | 19 |
| Average | 421 | 45 |
| Below average | 225 | 24 |
| Very much below average | 32 | 3 |
| Lowest on record | 4 | 0 |
Nationally, the total surface water storage volume remained stable across the 2025–26 financial year, with wet conditions in the north balancing dry conditions in the south. However water levels continued to decline in major storages in the Murray-Darling Basin.
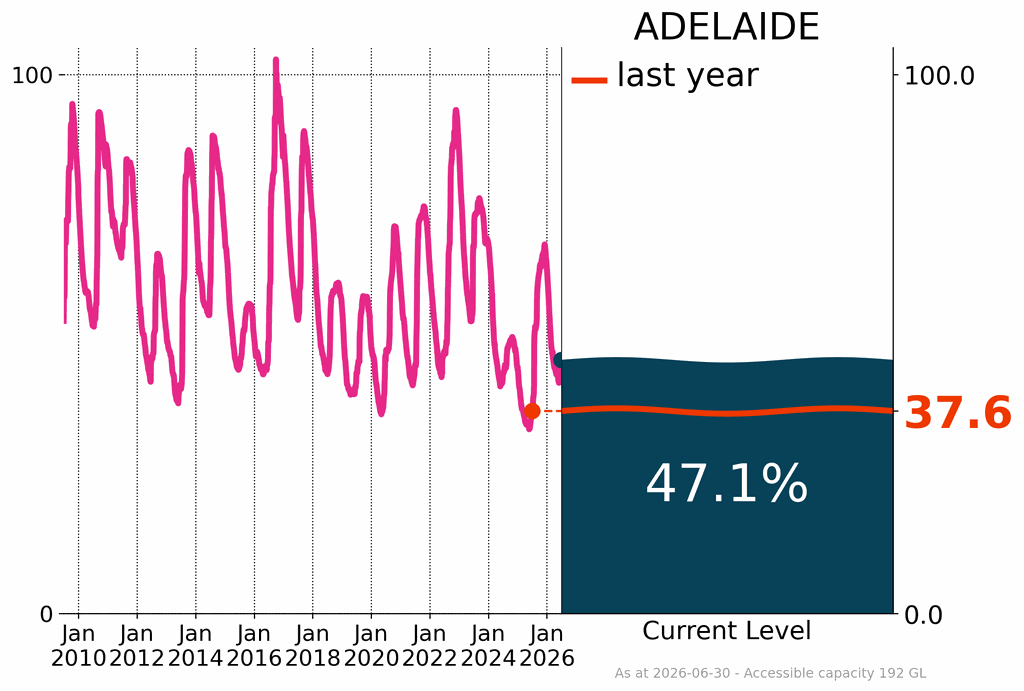
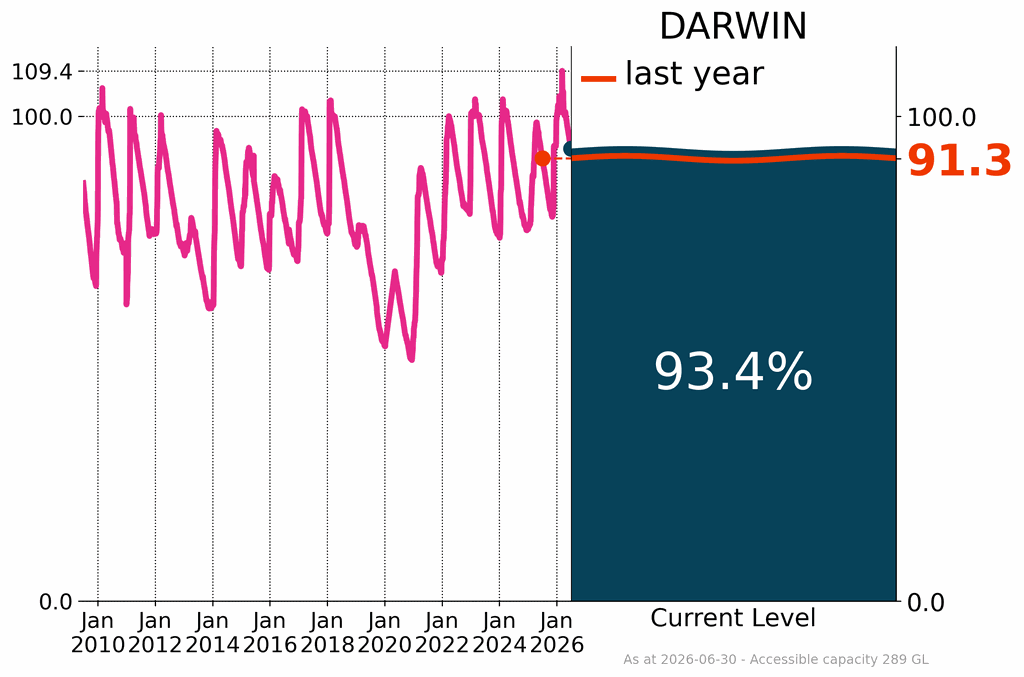
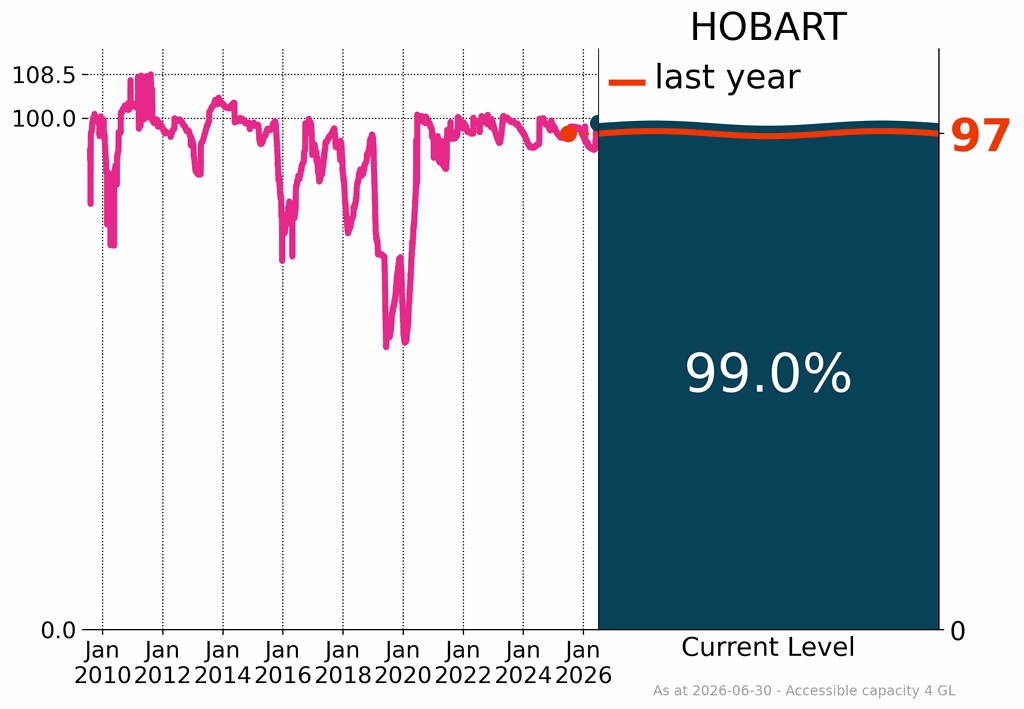
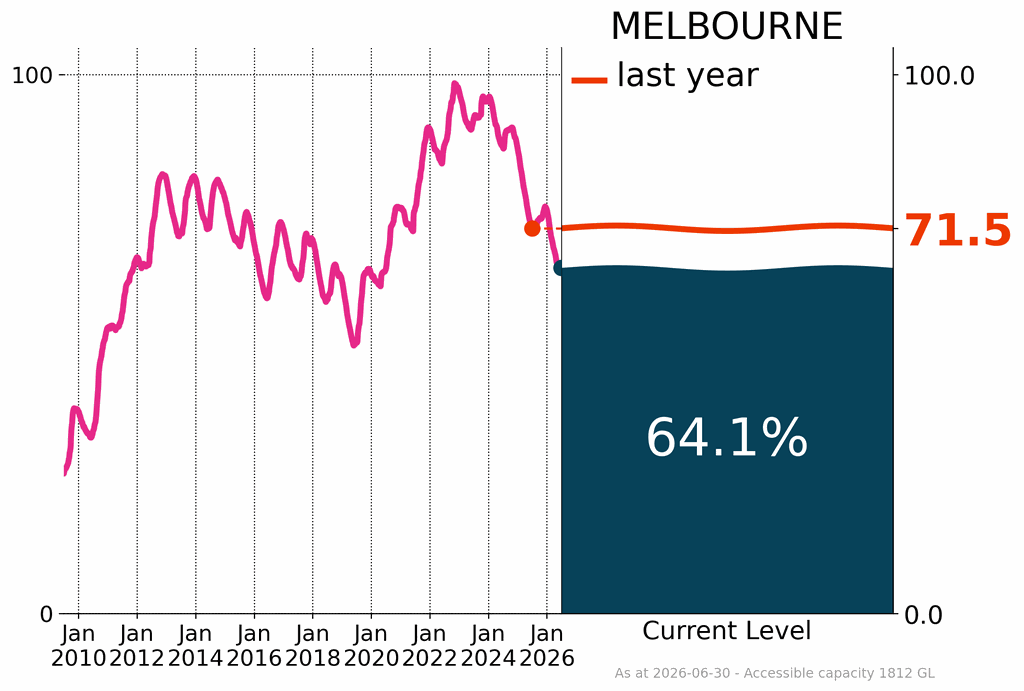
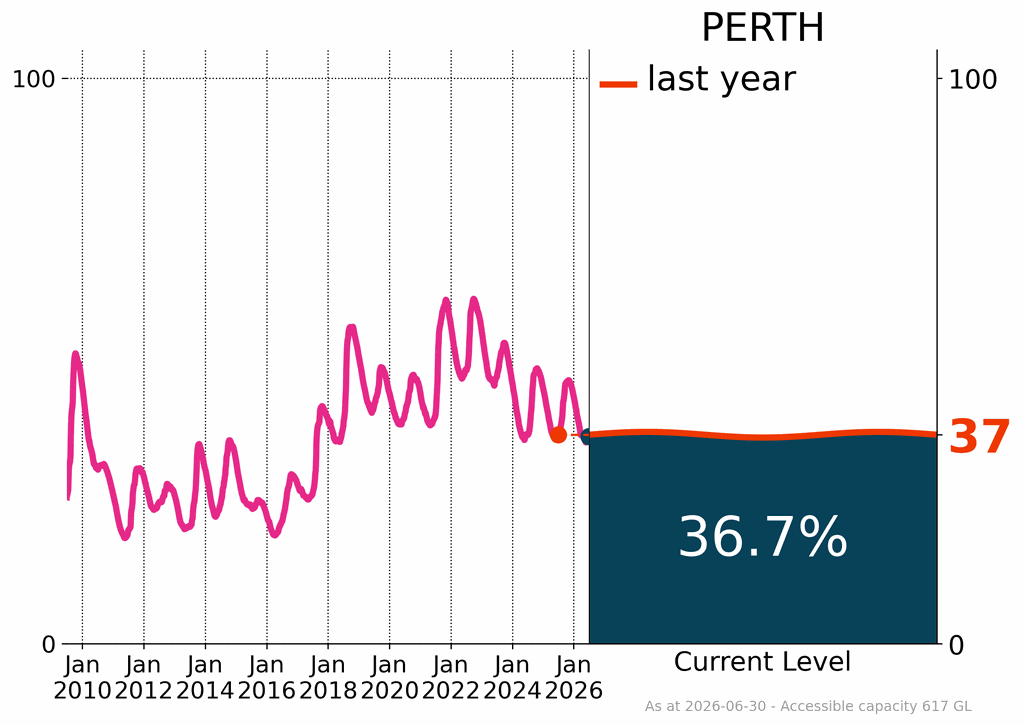
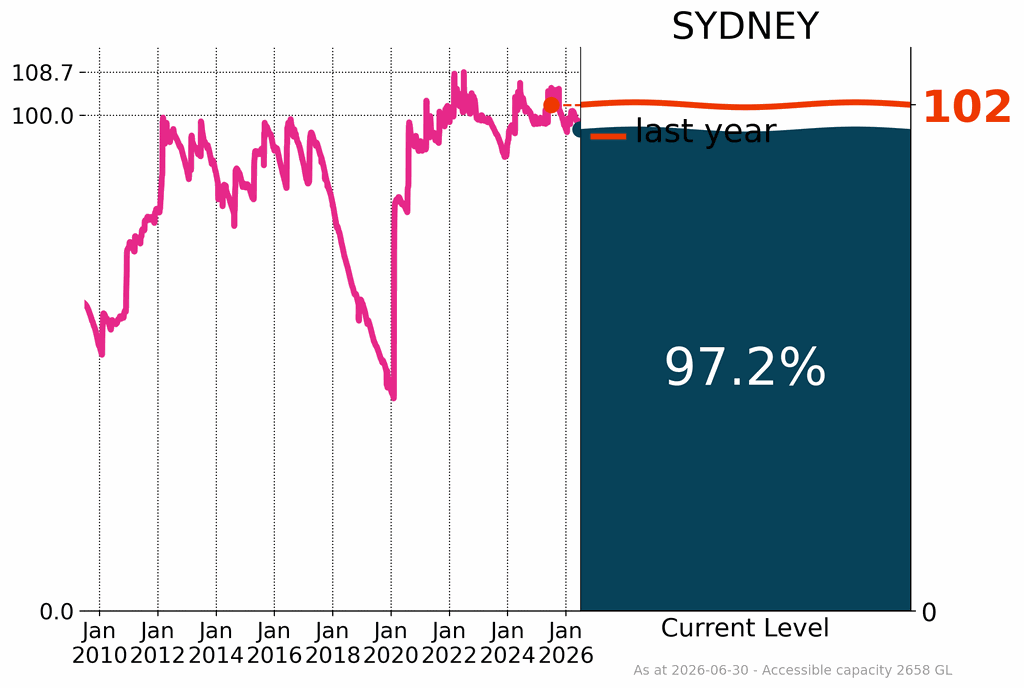
Melbourne, Adelaide and Perth water storages ended the financial year below 65% of accessible capacity, reflecting persistent dry conditions across southern Australia. Melbourne's water level decreased from 87% of accessible volume to 64% in the past two years.
Water storages
Overall
Overall, total surface water storage volume across Australia was 65% of available capacity at the end of the 2025–26 financial year, compared with 66% at the end of the 2024–25 financial year. At the national scale, dry conditions in the south were offset by wet conditions in the north. As a result, the decline across the major water storages in southern Australia was balanced by increases in storages in the north.
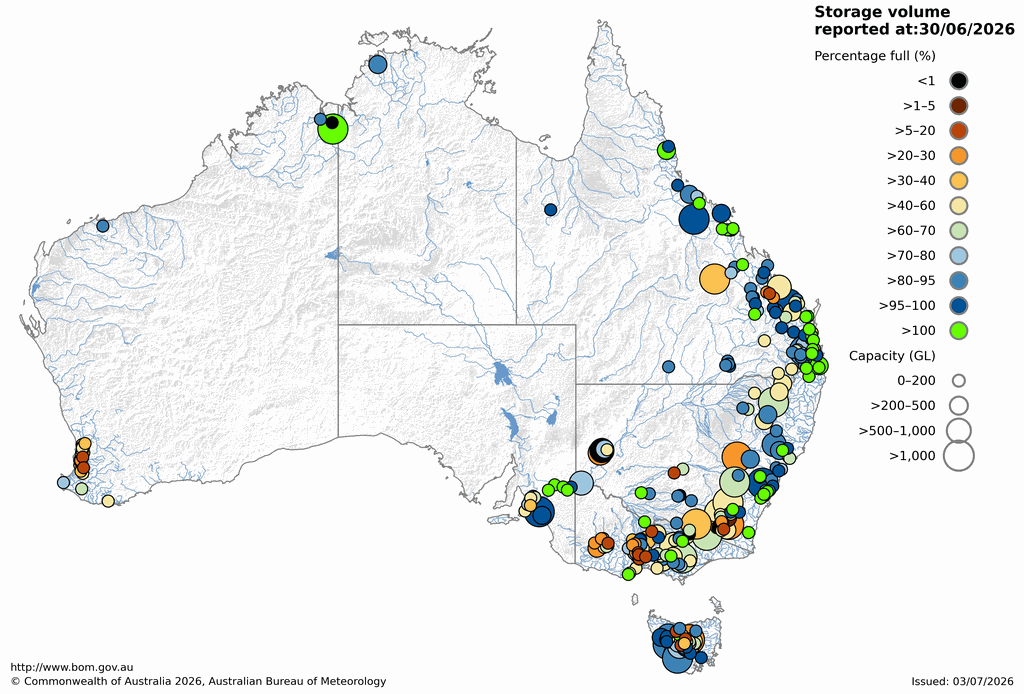
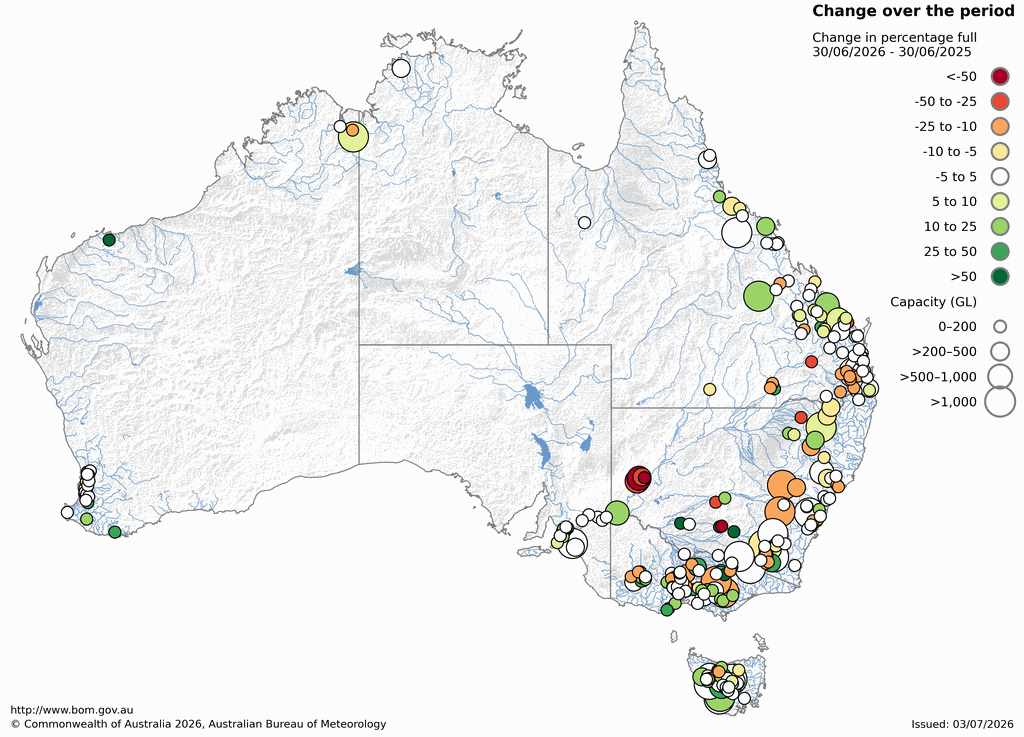
Murray–Darling Basin
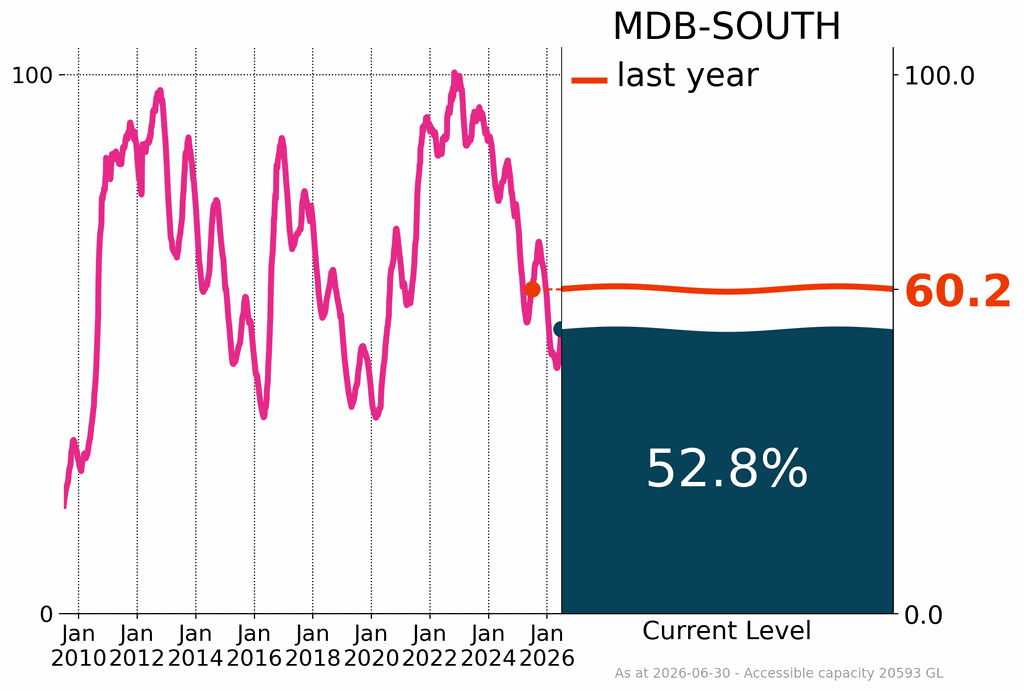
The water volume in major storages in the Murray–Darling Basin continued to decline in 2025–26, continuing the downward trend that began in late 2022. Collectively, major storages across the Murray–Darling Basin ended the financial year with a total volume of 53% of accessible capacity. This is down from 61% at the start of 2025–26, from 78% at the start of 2024–25 and 93% at the start of 2023–24. Compared to the previous financial year, the volume in major storages decreased in the northern Basin from 63% to 56%, and in the southern Basin from 60% to 53%.
Menindee Lakes
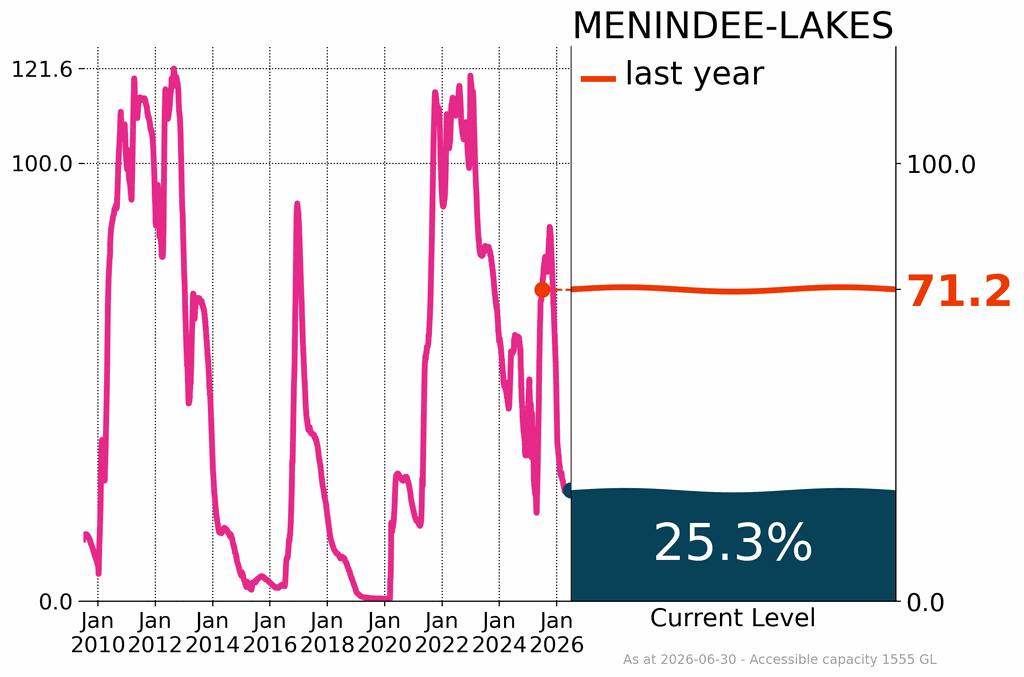
Below average rainfall in the Darling River catchment along with water extraction contributed to water storage levels in the Menindee Lakes decreasing from 71% to 25% of accessible capacity over the financial year. Storage levels rose in July, August and September 2025 as water from autumn rains moved down the Darling River, but storage levels fell steadily after that until the end of 2025–26.
South East and Central Queensland
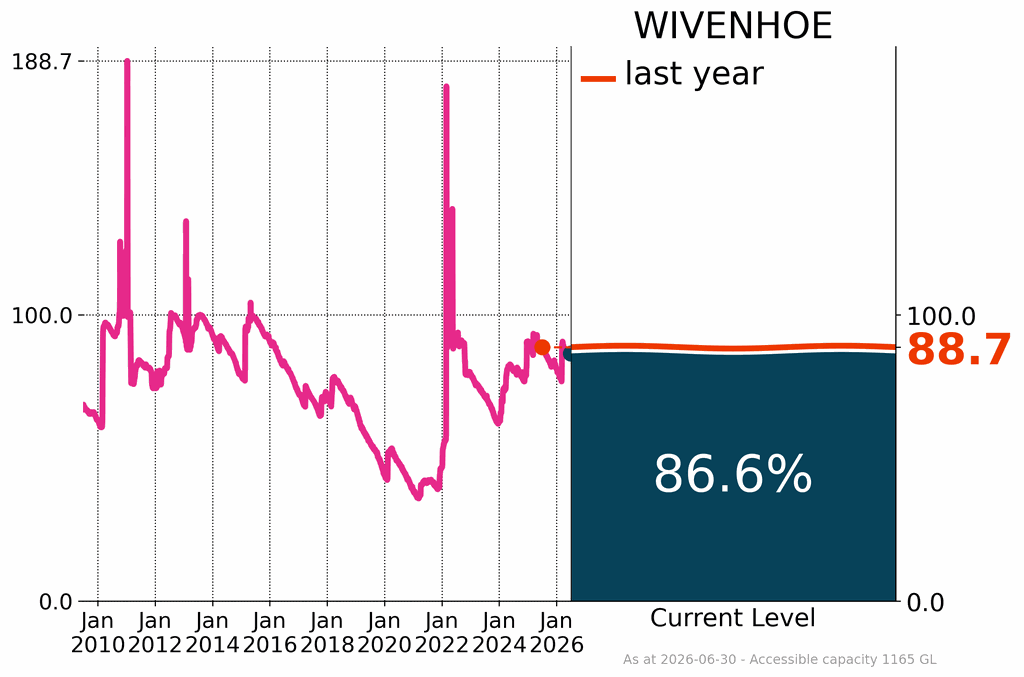
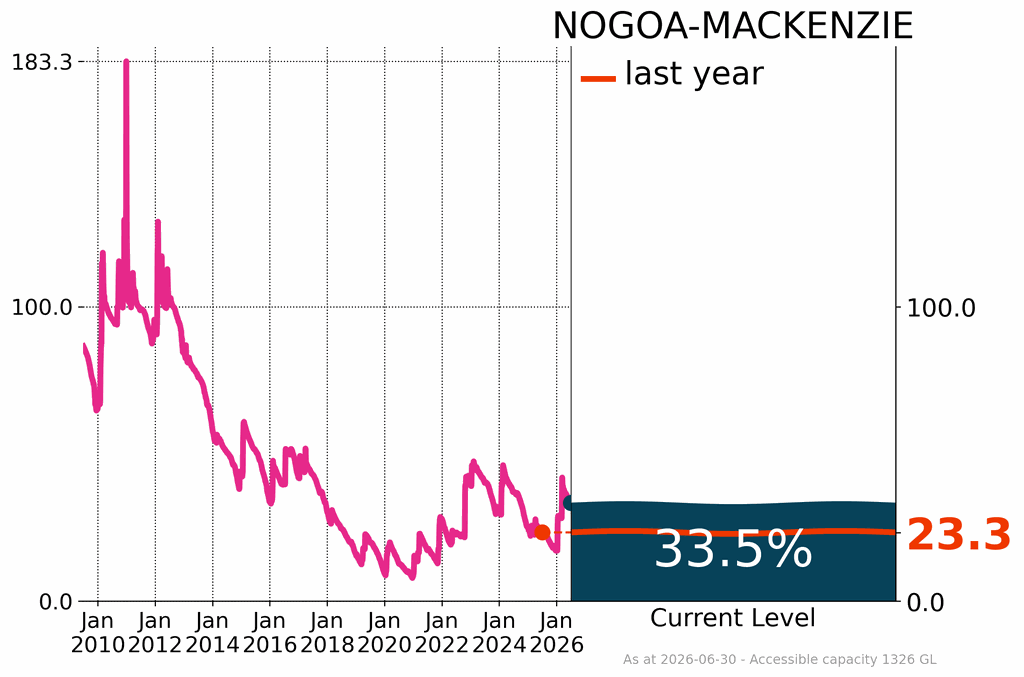
By the end of the 2025–26 financial year, water levels in most storages across south-east and central Queensland exceeded 80% of accessible capacity. Above average rainfall in spring 2025 and below average rainfall in summer 2025–26 contributed to storages being at similar levels to last year. Lake Wivenhoe, the largest storage in south-east Queensland, began the financial year with 89% of accessible capacity, saw its level rise and fall and end the financial year at 87%. The Nogoa Mackenzie rural supply system in central Queensland saw its water storages increase in accessible capacity from just 23% to 34% at the end of financial year.
Northern Australia
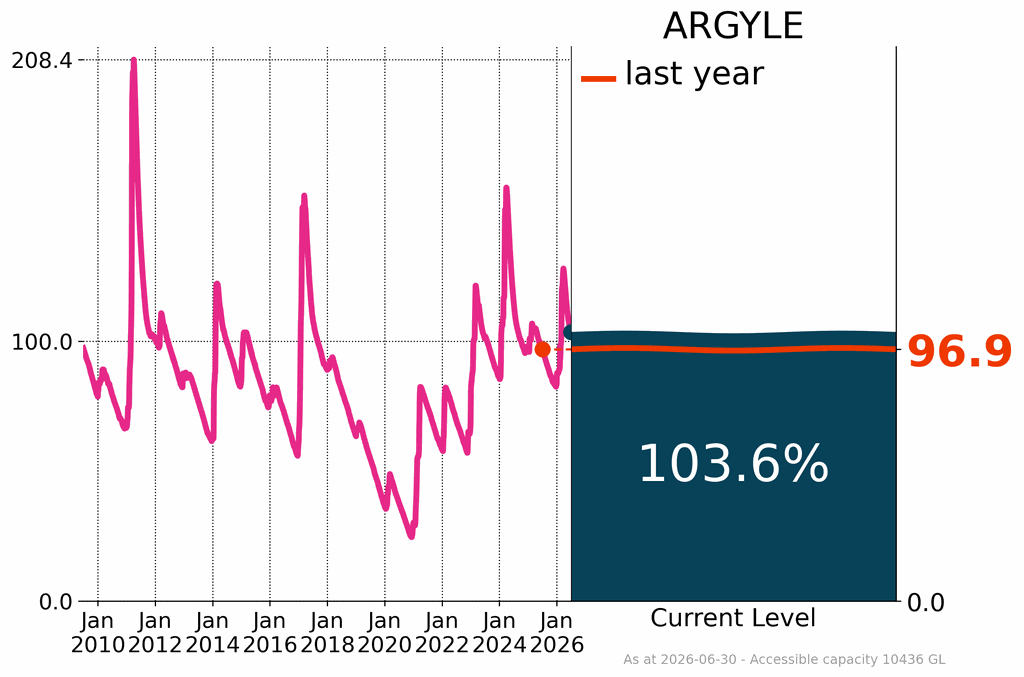
In northern Australia, above to very much above average rainfall particularly in February and March 2026 resulted in high soil moisture and significant inflows to Lake Argyle, the country's largest water supply storage. Storage volume at the start of the financial year was at 97% of accessible capacity, and declined to 83% by mid-December 2025. From February to April, above average rainfall across the Top End, associated with monsoonal activity, contributed to significant inflows to water storages. By late March 2026, storage volume in Lake Argyle reached at 128% of accessible capacity, before gradually declining to 104% by the end of the financial year.
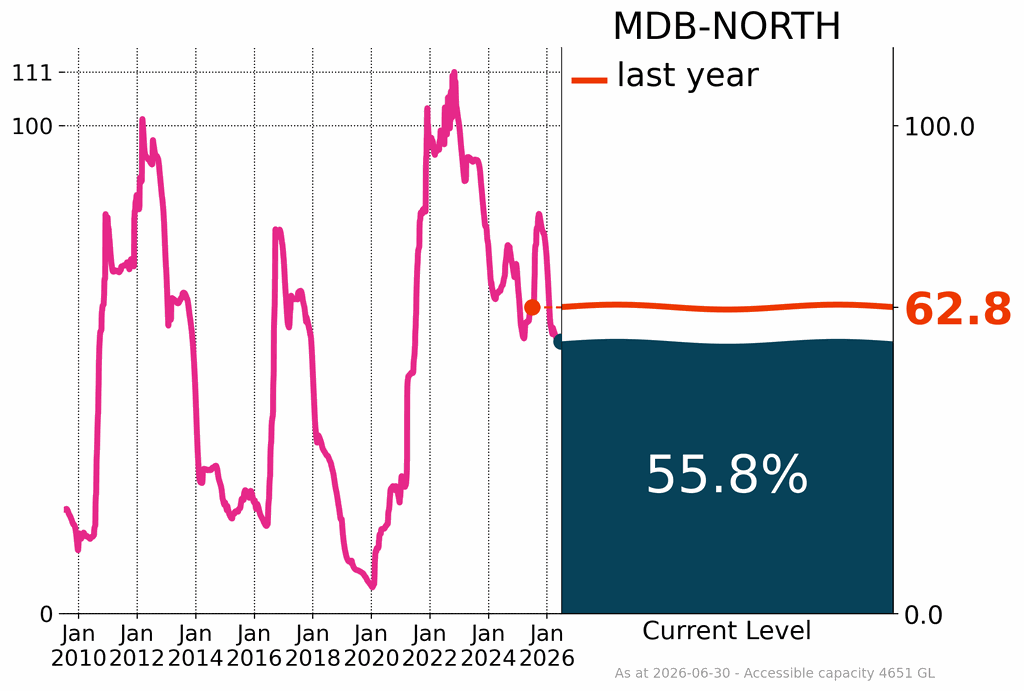
Capital cities
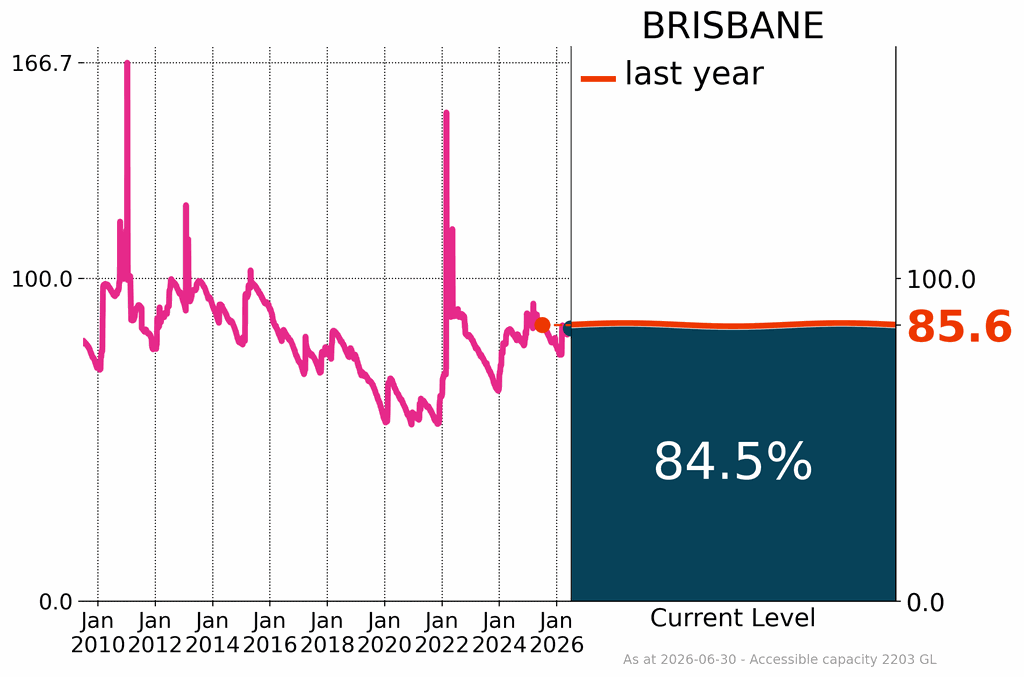
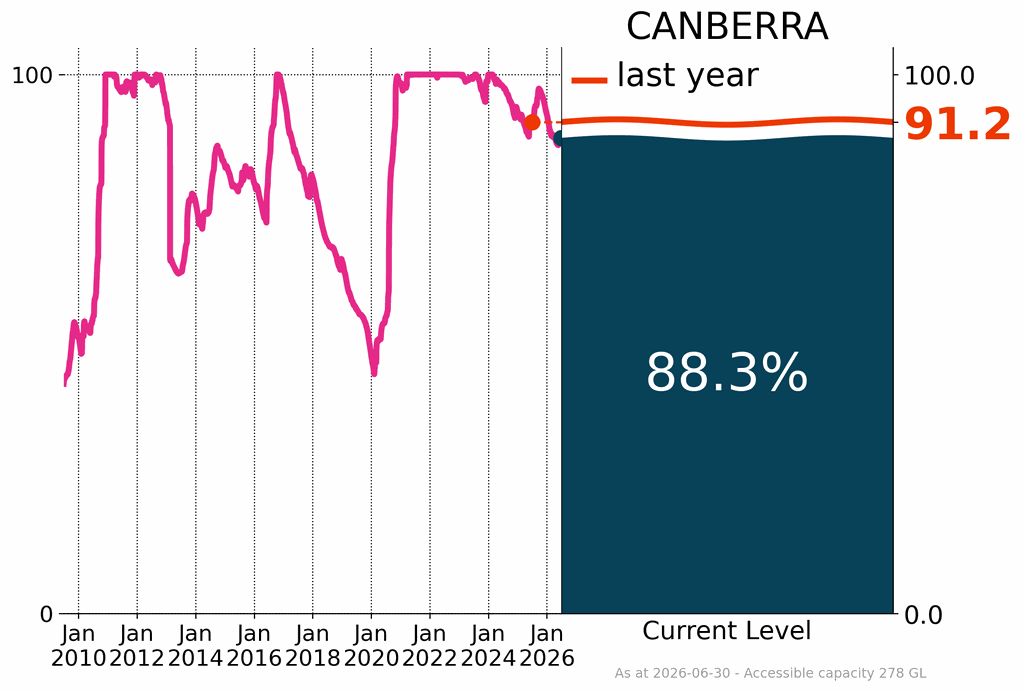
In Australia's major capital cities, water availability is influenced by surface water storage and groundwater levels. Where storage volumes are not adequate, alternative sources such as desalinated water or recycled water are used. By the end of the 2025–26 financial year, surface water storages that supply the major capital cities had volumes greater than 80% of accessible capacity, with the exceptions of Melbourne, Adelaide and Perth. The volume of water in storages remained relatively stable in most capital cities over the financial year, except for Adelaide, where storage volumes increased, and Melbourne, where storage volumes decreased.
Adelaide's storage volumes increased from 38% to 47% of accessible capacity. Adelaide's water supply needs are augmented by alternative sources, mostly from water transfers from the Murray River, with some supply from desalinated water and groundwater.
Perth's surface water storages ended the 2025–26 financial year at 37% of accessible capacity, which is similar to the end of 2024–25 and the end of 2023–24. Perth's water supply relies more heavily on desalinated water and groundwater than surface water. The city's water supply strategy involves 'banking' desalinated and groundwater water in its surface water storages during low demand periods to support supply requirements during peak periods.
Rainfall around Melbourne was close to average throughout 2025–26. However, storage volumes declined to 64% of available capacity by the end of the financial year. This compares with 72% at the end of 2024–25 and 87% at the end of 2023–24.
Further information
For more information on individual rainfall and flooding events, see the Events section. For more information on monthly storage levels see the Drought update.
There were more groundwater bores with above average levels at the end of the 2025–26 financial year than at the end of the previous financial year. This reflected significant rainfall across northern, central and parts of eastern Australia. Groundwater levels declined in the Murray–Darling Basin, south-eastern South Australia, western and southern Victoria, eastern Tasmania and south-west Western Australia, due to persistent dry conditions and long-term extraction.
Groundwater
Overall
Groundwater levels across Australia varied widely in 2025–26, with 30% of bores below average (down from 36% in 2024-25), 30% at average levels (unchanged from 2024-25) and 40% above average (up from 34% in 2024-25). This indicates an overall improvement in groundwater conditions compared to the previous financial year.
Long-term trends in groundwater levels in 2025–26, calculated over 5-, 10- and 20-year periods, were broadly similar to those observed in 2024–25. Over the 5-year period to June 2026, 31% of bores showed a rising trend (down 7% from 2024–25), with rising trends concentrated in northern Australia, north-east Queensland and parts of northern Murray–Darling Basin. Another 25% of bores showed a declining 5-year trend (up 8% 2024–25), reflecting the dry conditions in south-west Western Australia, south-east South Australia, southern Victoria and north -western Tasmania during the 5 years. Over the 10- and 20-year periods to June 2026, most bores had stable trends (57% and 72%, respectively), similar to June 2025.
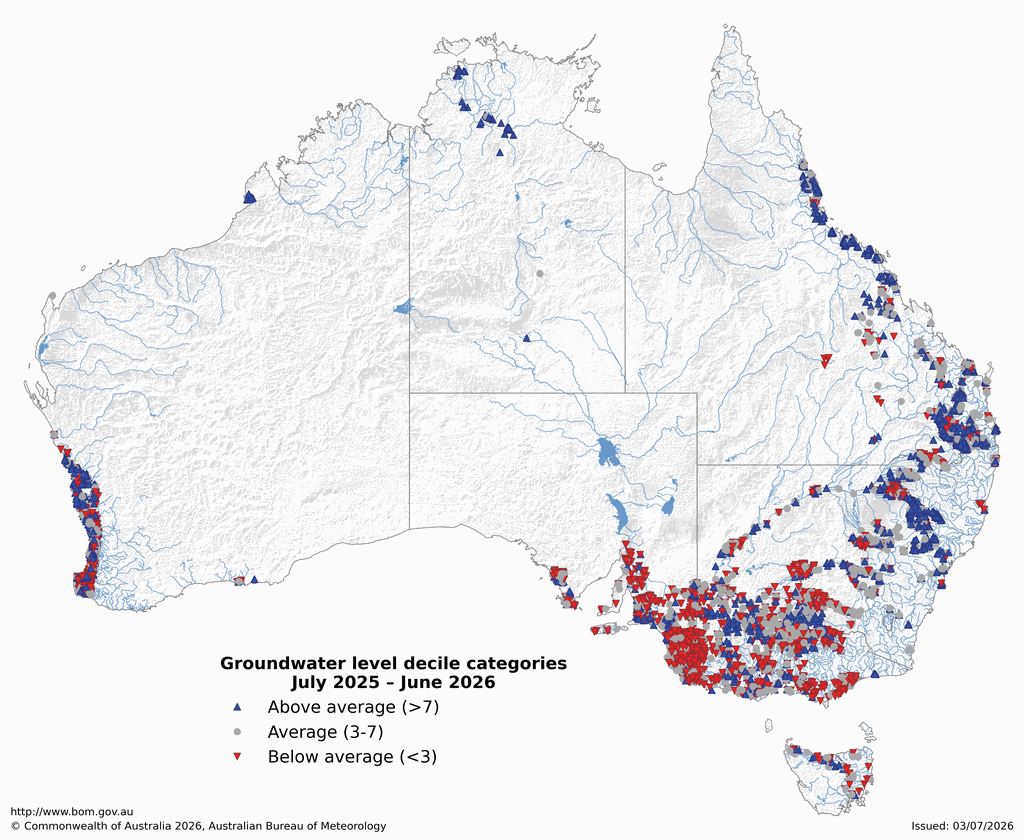
Data are from 9143 bores where groundwater level is measured.
| Trend category | 5-year trend | 10-year trend | 20-year trend |
|---|---|---|---|
| Rising | 31% | 31% | 18% |
| Stable | 44% | 57% | 72% |
| Declining | 25% | 12% | 10% |
Murray–Darling Basin and the Victoria–South Australia border region
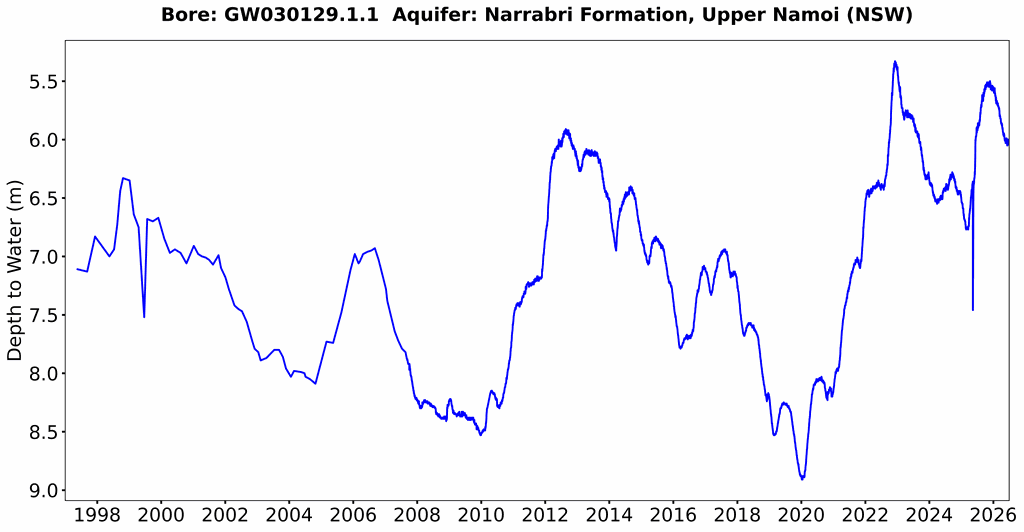
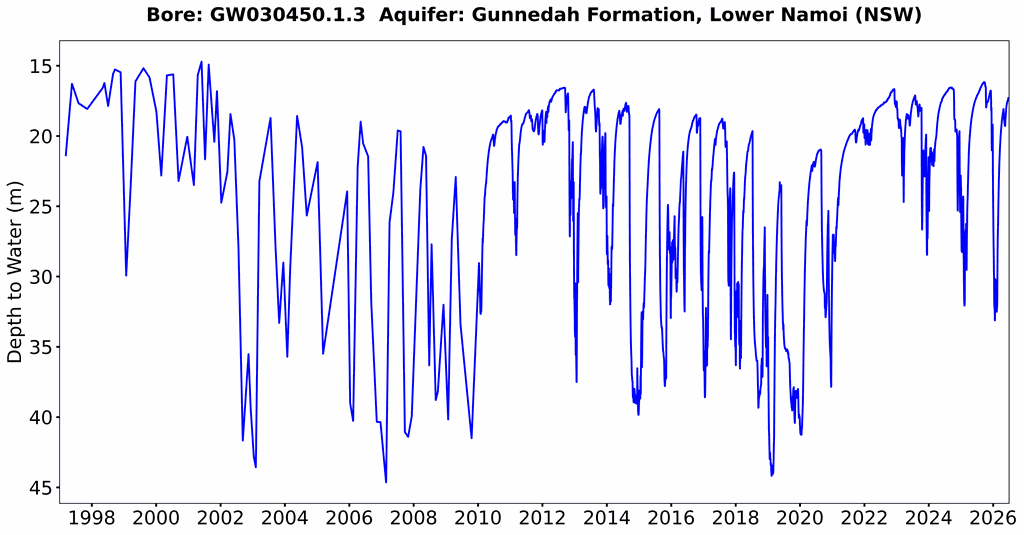
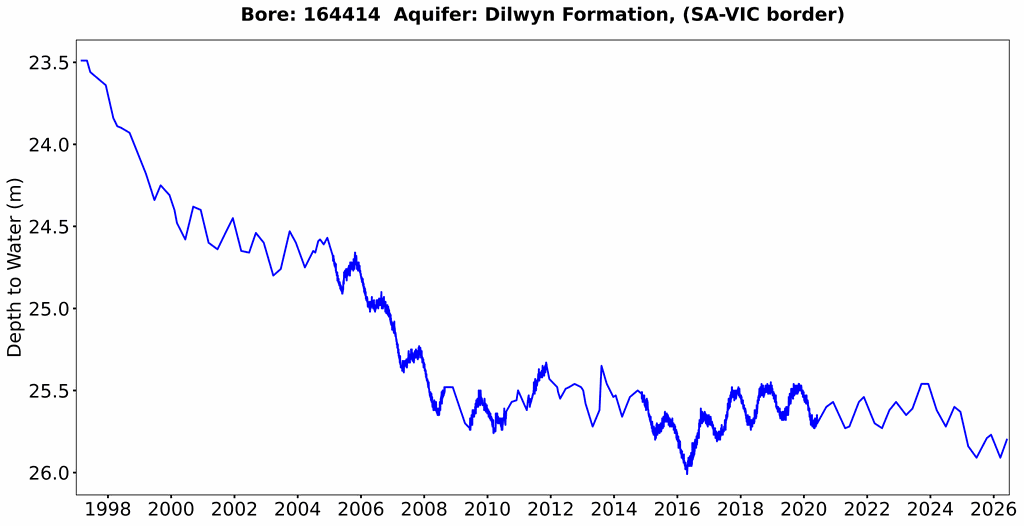
In the northern Murray–Darling Basin and south-eastern Queensland, groundwater levels in June 2026 were broadly similar to those in June 2025, with many bores remaining at average to above average levels, despite 12 months of average to below average rainfall and strong groundwater demand. Groundwater levels in many bores along the Victoria–South Australia border and in south-eastern South Australia remained at average to below-average levels, reflecting the combined impacts of ongoing rainfall deficiencies in recent years and the long-term effects of groundwater extraction.
South-west Western Australia
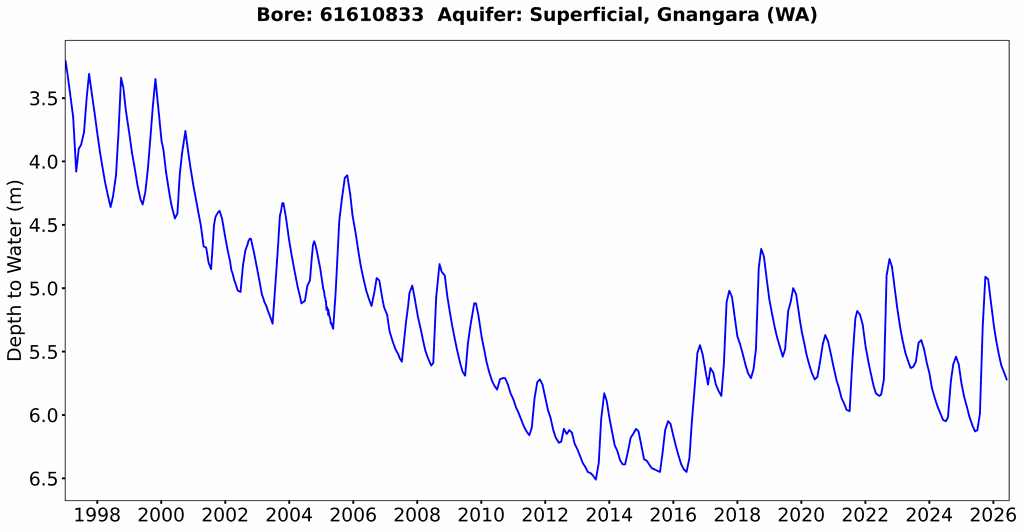
Groundwater levels in south-west Western Australia have generally declined over the past 40 years due to low rainfall and high groundwater demand. Some signs of stabilisation, however, have been evident since around 2015, following the implementation of managed aquifer recharge and increased use of desalinated water. Rainfall in the Lower West district of Western Australia was close to average during the financial year, resulting in relatively strong recharge to the surficial aquifers of the Gnangara Mound. In parts of the region, groundwater levels in June 2026 were higher than in June 2025.
Northern Territory
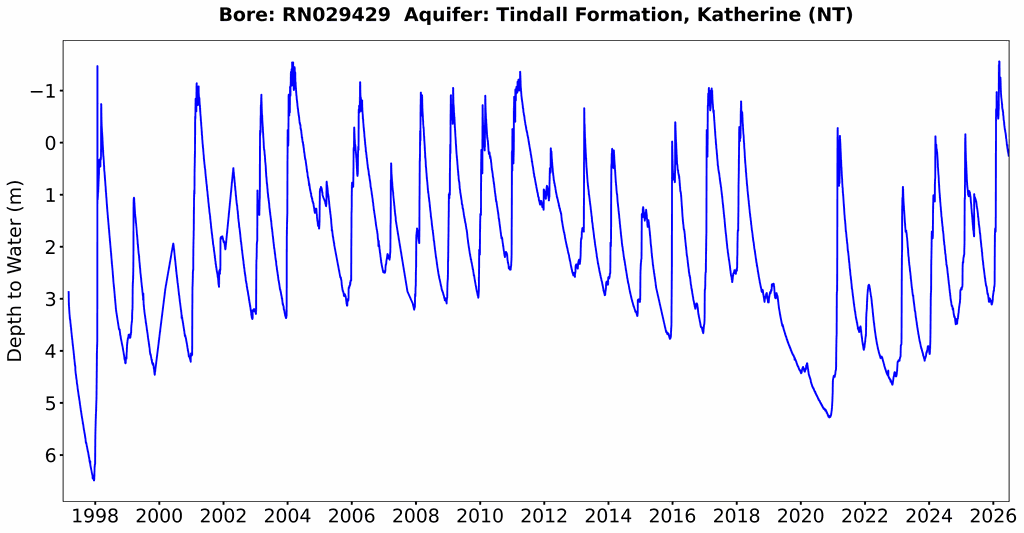
In the Northern Territory Top End, where groundwater recharge depends on wet season rainfall and streamflow, groundwater levels showed strong recovery. Above-average wet season rainfall in 2025–26 resulted in 98% of assessed groundwater bores in the Northern Territory (42 of 43 bores) recording above average levels in June 2026, compared with only 7% in June 2025. Despite significant extraction during the dry season, aquifers across the Top End were well recharged in June 2026 compared with June 2025.
Tasmania
In Tasmania, below average rainfall in the east led to falling groundwater levels, with 50% of bores recording below average levels, up from 21% in 2024–25. By June 2026, dry conditions and drawdown meant that just 8% of Tasmanian bores had above average groundwater levels.
Sea surface temperatures for the Australian region were the second-warmest on record at 0.75 °C above average. A weak La Niña developed in the Pacific Ocean in late October 2025 and continued until March 2026, followed by the onset of an El Niño in mid-June. The Indian Ocean Dipole was in a negative phase between July and December and was neutral between January and June.
Sea surface temperatures
Australian region
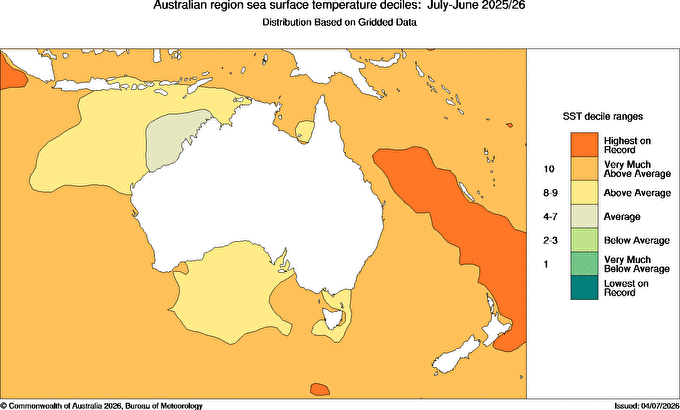
Data: NOAA Extended Reconstructed Sea Surface Temperature dataset, ERSST v5. About sea surface temperature regions.
Averaged across the 2025–26 financial year, sea surface temperatures (SSTs) in the Australian region (4° S to 46° S and 94° E to 174° E) were 0.75 °C above the 1961–1990 average. This was the second-warmest financial year on record since 1900–01, behind 2024–25. SSTs were above to very much above average (in the warmest 10% of years since 1900–01) across most of the Australian region and warmest on record for parts of the Coral Sea.
Monthly mean SSTs from July to December 2025 ranked among the 3 warmest on record for their respective months since 1900. From January 2026, SSTs were closer to the average over recent decades (1991–2020), particularly across the northern half of the region. Relatively warmer SSTs returned from May 2026, with temperatures off southern New South Wales and eastern Tasmania up to 2 to 3 °C above average.
The black line shows the 11-year moving average. The value for the 11-year average is positioned over the middle year of each 11-year block.
Global
In the 2025–26 financial year global SSTs were 0.74 °C above the 1961–1990 average. This was the equal second-warmest on record since 1900–01, tied with 2024–25 and behind only 2023–24. This indicates the continuing impacts of climate change, with the last financial years, from 2014–15 to 2025–26, the 12 warmest on record.
Global SSTs have warmed on average by around 1 °C since 1900. The warming in the Australian region is slightly higher, estimated to be 1.16 ± 0.11 °C between 1900 and 2025.
SSTs were very much above average or warmest on record for most of the globe, except for the central tropical Pacific Ocean, where a La Niña persisted for much of the year, and parts of the North Atlantic and Southern Oceans.
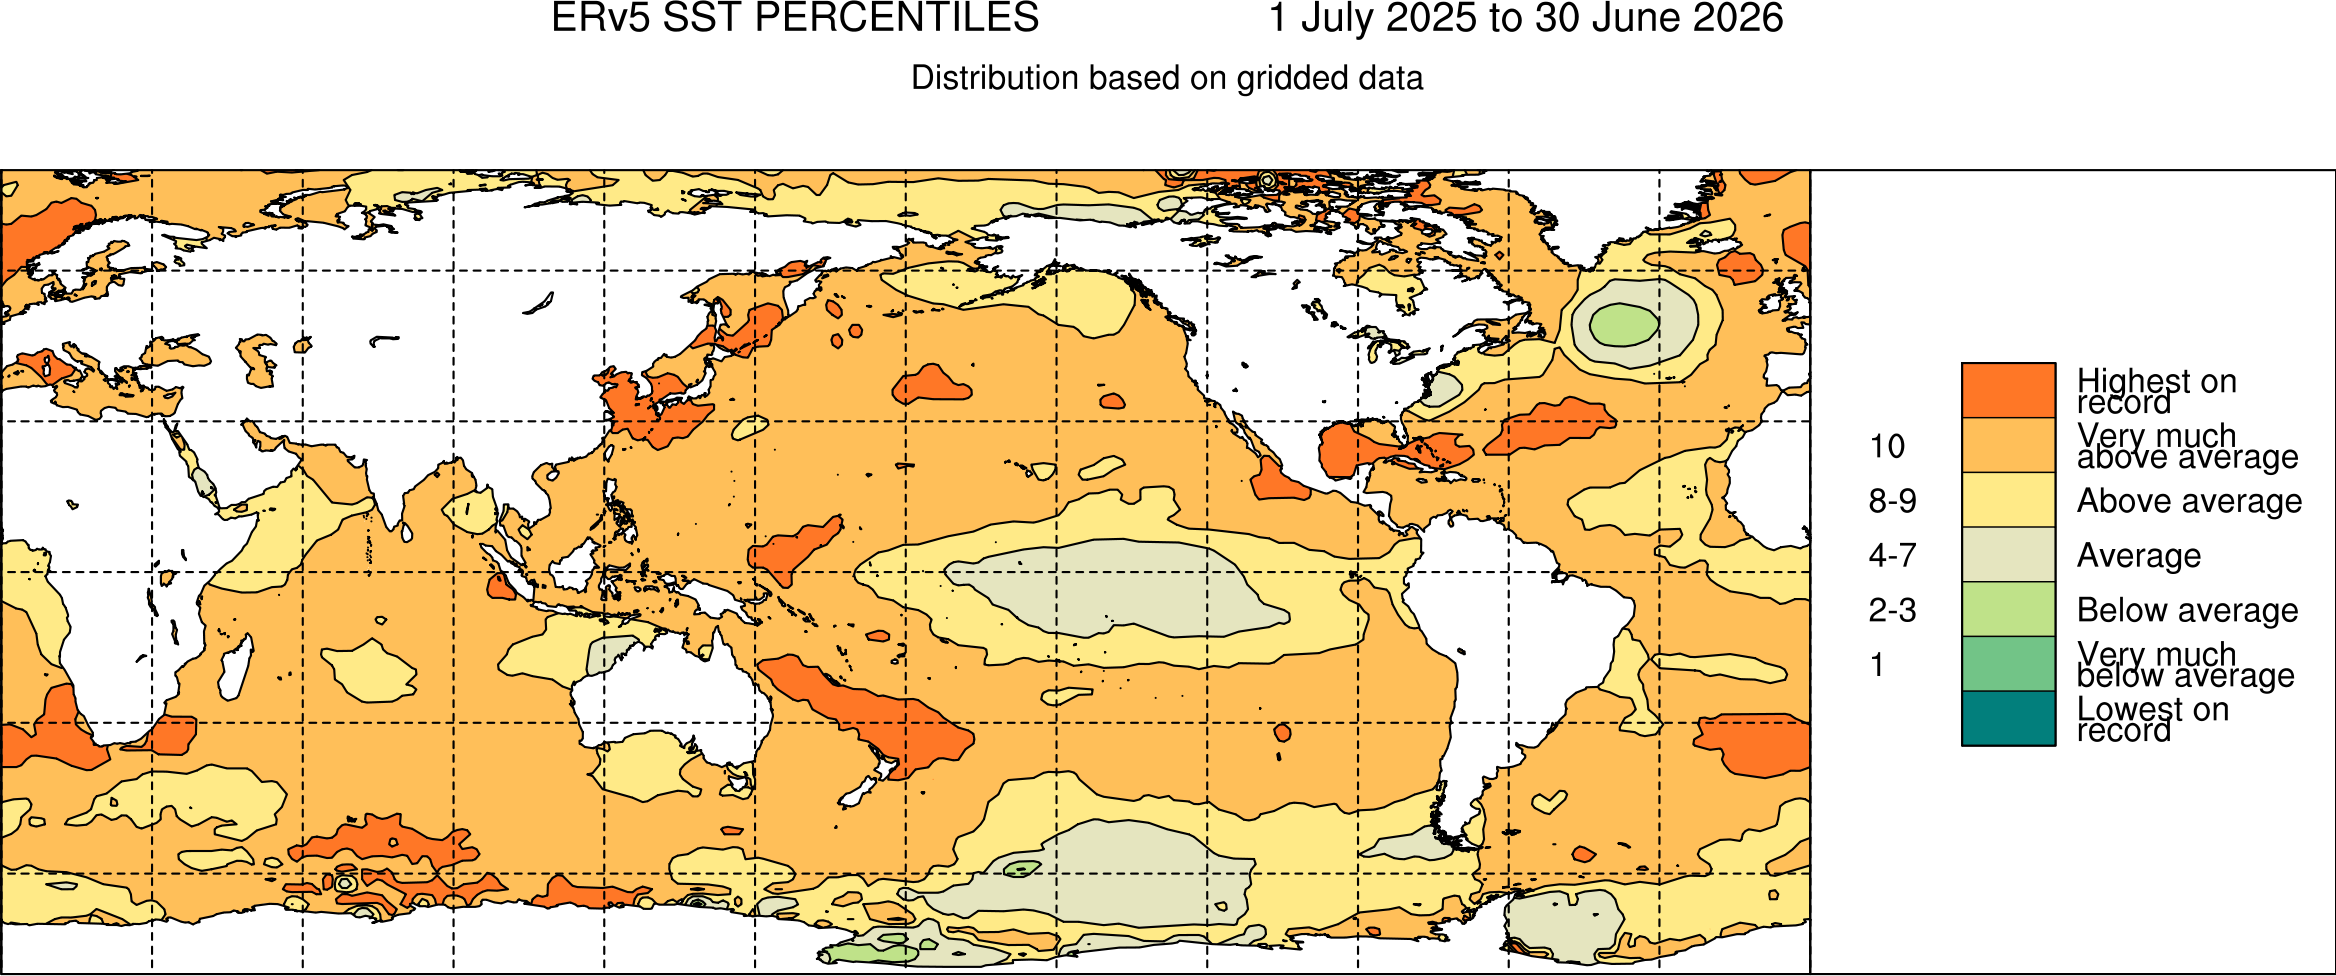
Data: NOAA Extended Reconstructed Sea Surface Temperature dataset, ERSST v5. About sea surface temperature regions.
Pacific Ocean
In the Pacific Ocean, SSTs progressively cooled across equatorial regions from July 2025, with La Niña conditions established in October. The La Niña event peaked in late 2025 before returning to El Niño-Southern Oscillation (ENSO) neutral conditions in early March 2026. Rapid warming followed in the central and eastern tropical Pacific from March and by early June the weekly relative Niño3.4 index surpassed the El Niño threshold (+0.80 °C). The atmosphere over the tropical Pacific, as measured by trade winds, cloudiness and mean sea level pressure, responded to the warming ocean temperatures by mid-June. This coupling effect of conditions in the oceans–and atmosphere reinforcing each other, signalled the onset of an El Niño.
Indian Ocean
In the tropical Indian Ocean, a negative Indian Ocean Dipole (IOD) emerged in late July 2025, and persisted until mid-December, characterised by warmer-than-average waters in the eastern tropical Indian Ocean, and cooler than average waters in the west. Although the IOD index exceeded the positive threshold (+0.4 °C) from late January to early March 2026, this was largely driven by tropical activity in the eastern basin. This was not a positive IOD event, and the pattern had limited influence on Australian weather. Instead, sea surface temperatures reflected neutral IOD conditions during the first half of 2026 and were generally above average across the tropical Indian Ocean.
The monsoon arrived at Darwin for the 2025–26 wet season in late December, close to the long-term average onset date. Monsoonal conditions persisted through to March 2026. Combined with several active phases of the Madden–Julian Oscillation, these conditions contributed to widespread rainfall and multiple significant flooding events. Across southern Australia, low pressure systems were dominant during late 2025 leading to frequent cold fronts crossing the south-east, and high pressure systems were dominant from April to June 2026, bringing drier and settled conditions.
Atmospheric circulation
Australian region
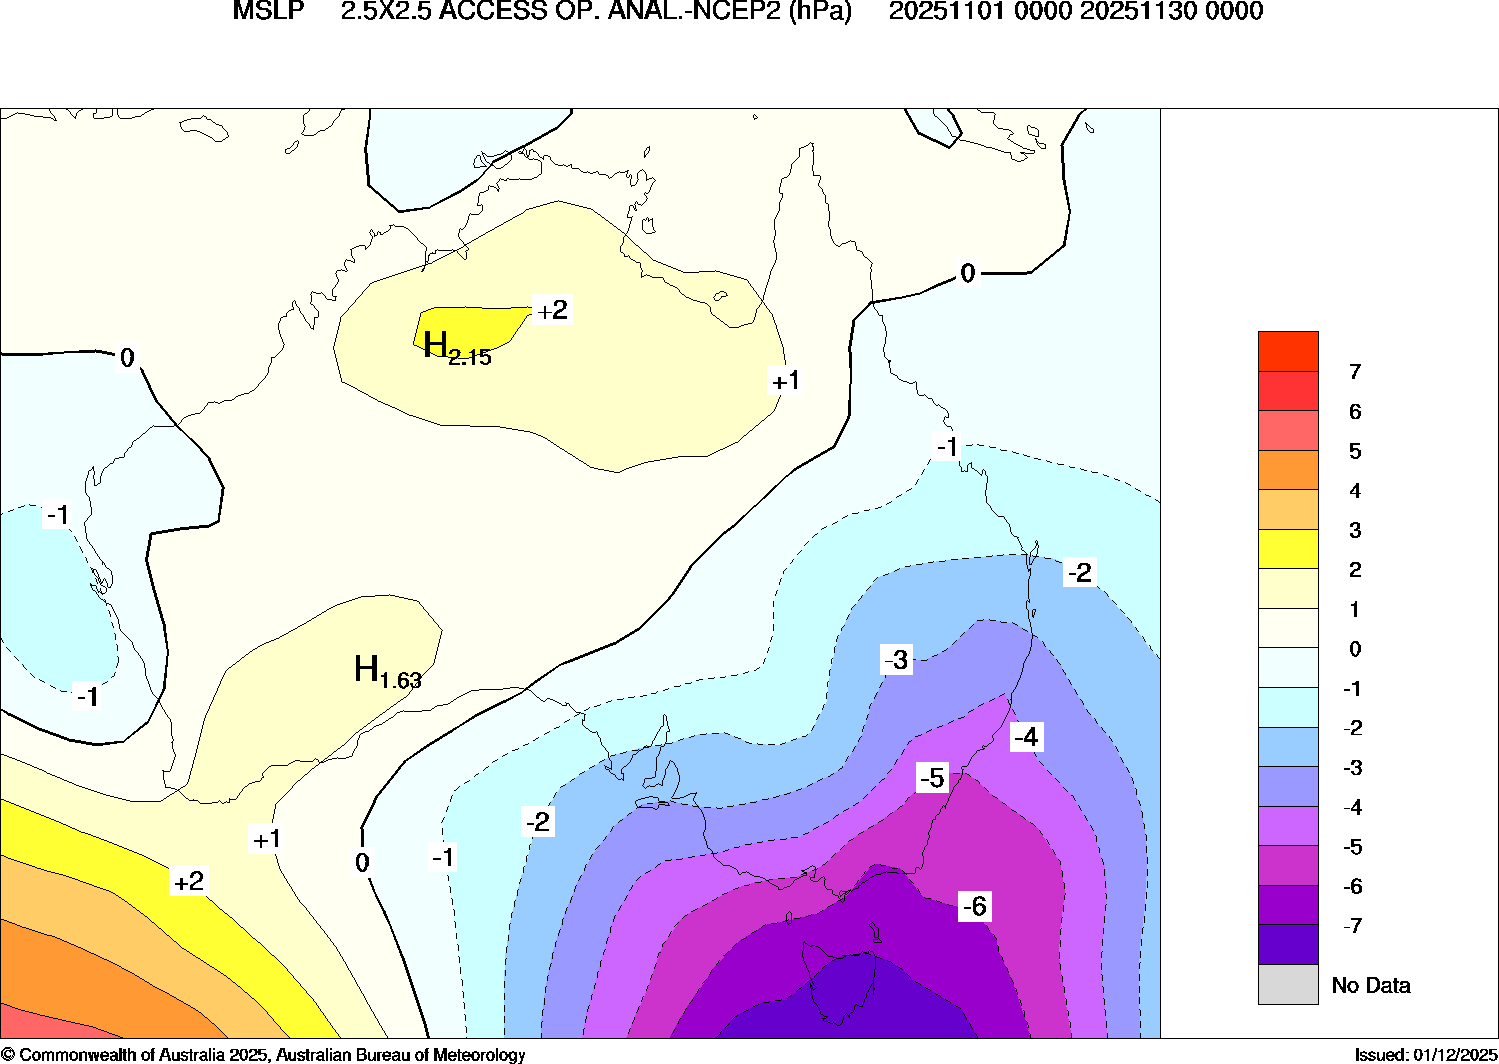
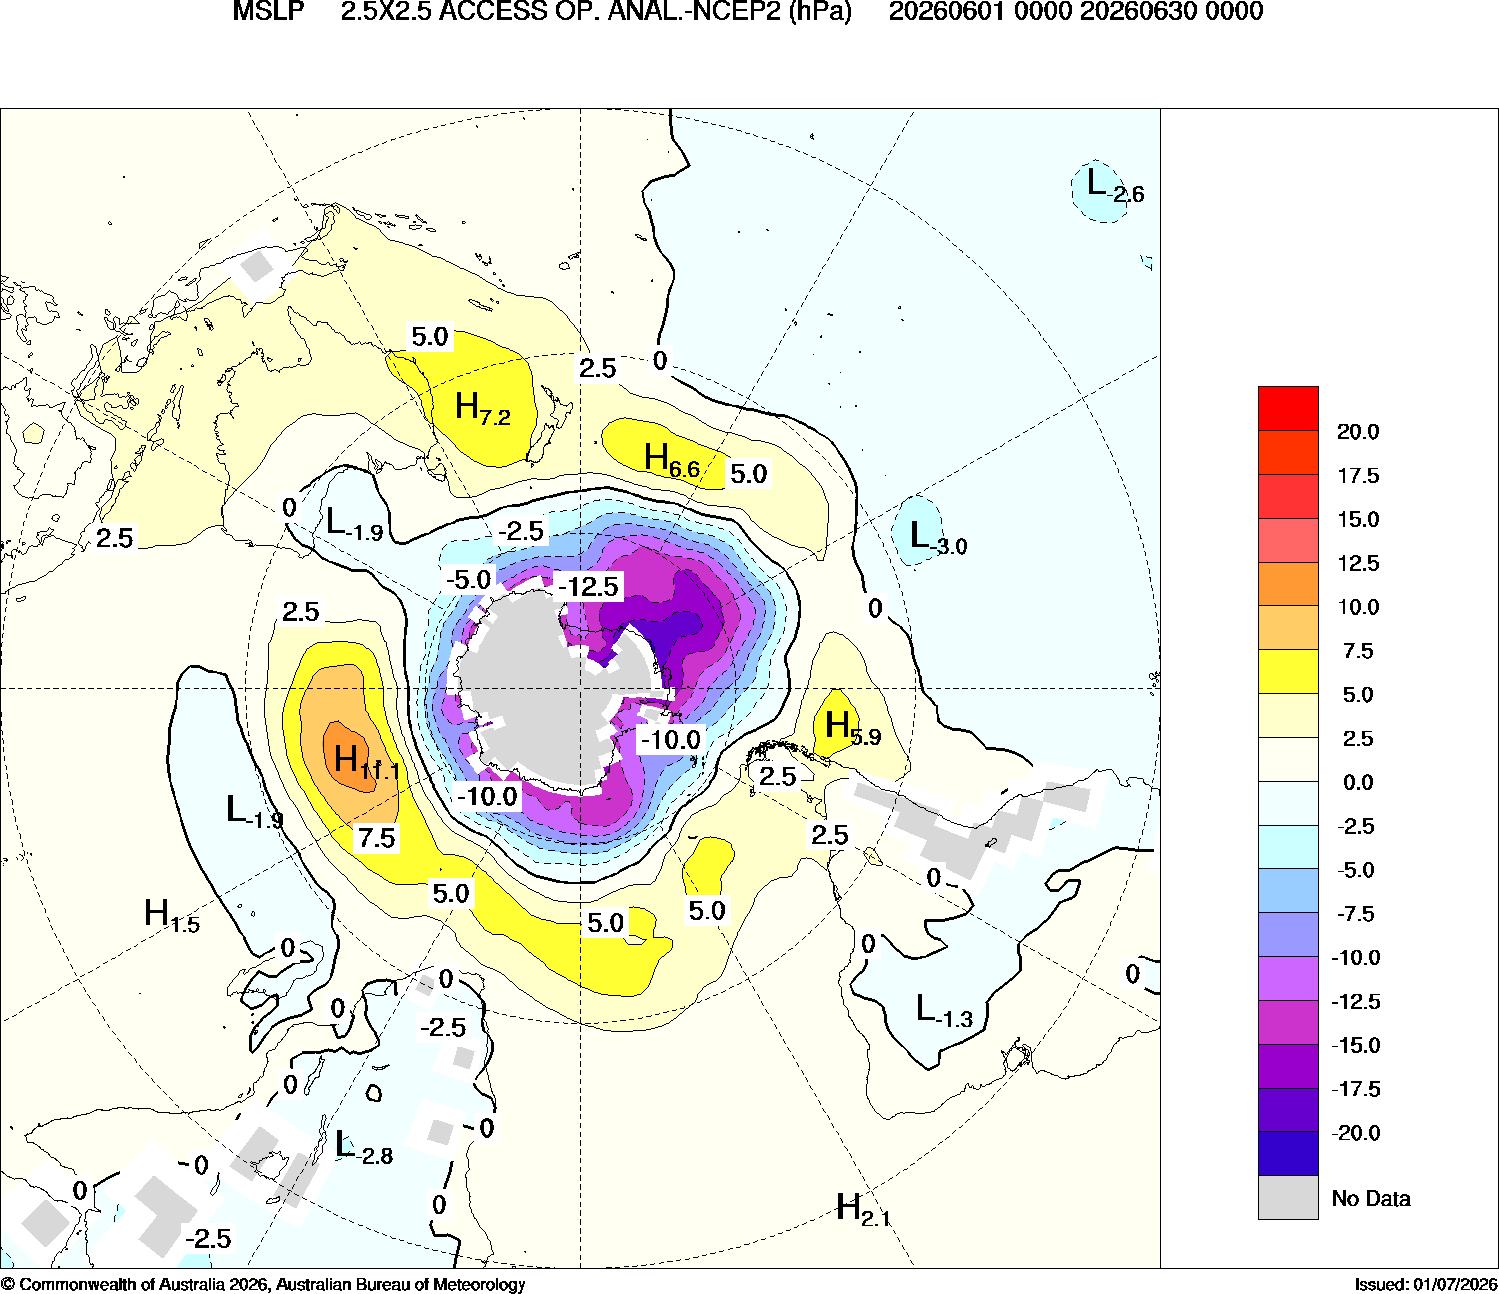
Monthly Mean Sea Level Pressure (MSLP) anomalies influenced rainfall and temperature patterns across the Australian region during the 2025–26 financial year. In November 2025, the monthly MSLP was up to 7 hPa below average over mainland south-eastern Australia and Tasmania. Frequent cold fronts and low pressure systems during the month resulted in below average temperatures and above rainfall across Tasmania, most of Victoria and south-eastern South Australia.
In January 2026, monthly MSLP was up to 3 hPa above average in the south Tasman Sea and to the south of Tasmania, and up to 3 hPa below average across mainland Australia. At the end of the month, persistent high pressure systems to the south and east of Australia trapped large volumes of air over the south-east inland of the Dividing Range. This caused extreme heatwave conditions, with many temperature records being set over the region. Similar weather patterns from late February to early March saw a slow-moving low pressure trough bring extended periods of heavy rain to the same region.

Southern Ocean
Southern Annular Mode
The Southern Annular Mode (SAM) indicates the north–south movement of weather systems across the Southern Ocean, compared to their usual seasonal position.
Daily SAM index values greater than 1.0 indicate a positive phase of SAM, with weather systems shifting southward (toward the pole). In the 2025–26 financial year, positive phases of SAM occurred during:
- early July and at times in August 2025
- from early January to early February 2026
- from late May to the end of June 2026.
Daily SAM index values less than -1.0 indicate a negative phase of SAM, with weather systems shifting northward (toward the equator). Negative phases of SAM occurred during October 2025 and from late November to mid-December 2025.
The impact of SAM on southern and eastern Australia depends on the time of year, as weather systems move north and south, and on the complex relationship with other large-scale climate factors.
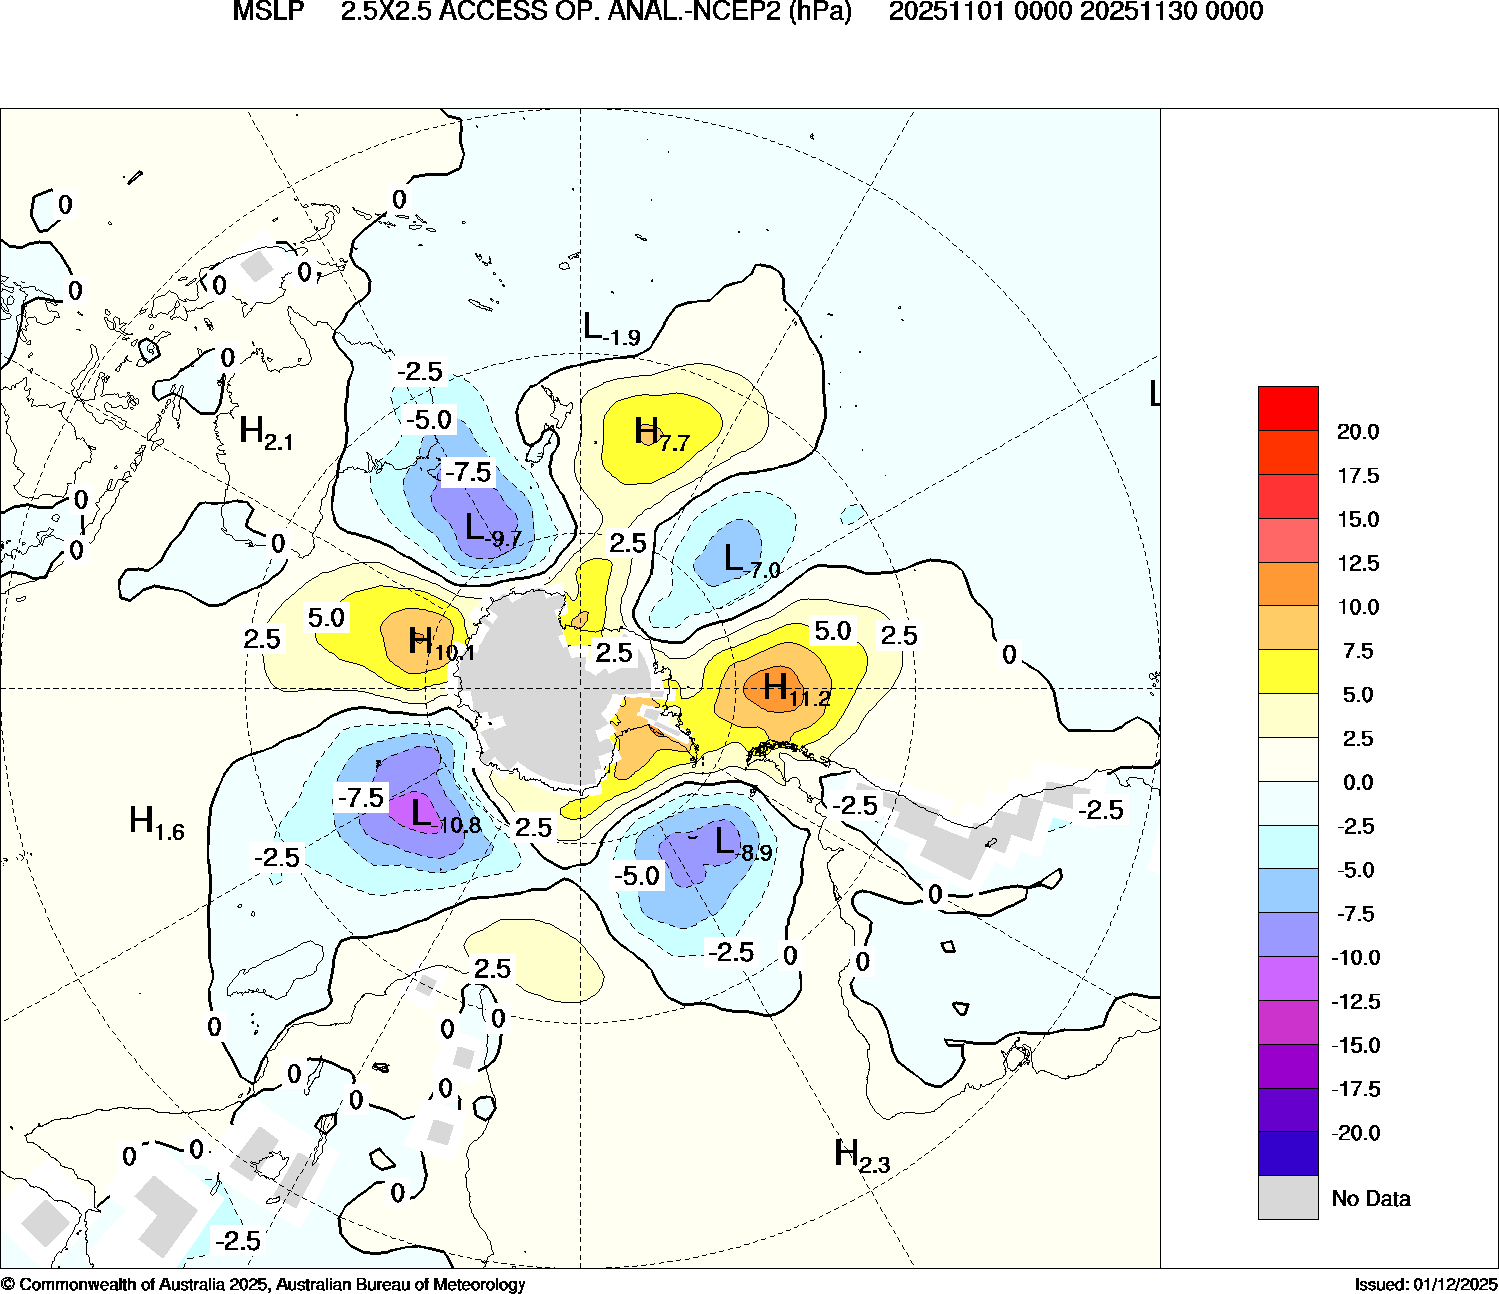
The predominantly negative phase of SAM between October and December was likely due to an unusually weak stratospheric polar vortex. It is possible that this contributed to the below average rainfall and above average temperatures in inland New South Wales and southern Queensland. In November, negative phase SAM may also have contributed to cold fronts pushing further northwards over south-eastern Australia than is typical for that time of year.
June 2026 saw an exceptionally strong positive phase of SAM. The daily SAM index value on 27 June was the second-highest index value for any month on record at +5.03. In the NOAA monthly SAM index, which commenced in 1979, June 2026 is the fourth-highest value for any month. The significant southward shift of weather systems saw monthly mean MSLP up to 7 hPa above average in the Tasman Sea. This drove an extended period of unseasonably warm conditions over south-eastern Australia, when New South Wales had its second-warmest June on record.
Climate change
State of the Climate 2024 reported that there has been a trend towards higher MSLP over southern Australia. A shift of high pressure systems further south is consistent with the broad atmospheric response to a globally warmer climate. With that shift, there have been more highs, fewer lows and a reduction in the number of rain producing lows and cold fronts in the Australian region, particularly during the cool season (April to October) period. SAM is also more likely to be in a positive phase in a globally warmer climate.
Tropics
Madden–Julian Oscillation
During the northern Australian wet season (October 2025 to April 2026), the Madden–Julian Oscillation (MJO) was active in the Australian region several times, contributing to enhanced tropical activity over much of northern Australia. This included the most active start to the tropical cyclone season since 1998–99, with 8 systems having been active in the Australian region by the end of January 2026.
A moderate to strong MJO pulse from late October to early December 2025, brought heavy rainfall to parts of tropical northern Australia, associated with inland troughs over northern Queensland.
In mid-to-late January 2026, another moderate to strong MJO pulse in the Western Pacific coincided with enhanced monsoonal conditions, and widespread heavy rain and flooding, particularly through Queensland and in the Katherine River region of the Northern Territory.
Weaker MJO pulses in late February to early March 2026 coincided with monsoonal conditions and tropical lows. There was less tropical activity with another weak MJO pulse in early April 2026, as the monsoon circulation had begun to retreat.
Monsoon
The monsoon onset at Darwin for the 2025–26 wet season was observed on 23 December 2025. This was close to the average onset date over all seasons since 1957–58, which is 29 December.
Monsoonal conditions began developing from around 20 December across the southern Indian Ocean and Australian longitudes. Very heavy rain across western Queensland in late December resulted in major to minor flooding across many river systems, some of which persisted into February as waters moved downstream.
Monsoon conditions continued across northern Australia for long periods until March, enhanced at times by the MJO and tropical systems.
Notable events
On 30 June, a coastal trough developed off the northern New South Wales and south-eastern Queensland coast. The trough moved southwards while intensifying to a low pressure system off the Illawarra coast of New South Wales coast on 1 July. This system generated several days of moderate to heavy rainfall and gale force to damaging wind gusts to coastal areas. In the three days to 9 am on the 3rd, up to 50 mm of rainfall was recorded across an area extending from the South Gippsland district of Victoria to the Hunter district of New South Wales, with falls greater than 100 mm in the East Gippsland district of Victoria and the South Coast and Illawarra districts of New South Wales. The highest daily rainfall total occurred in the 24 hours to 9 am on the 2nd, where Ulladulla recorded 224.0 mm (32 years of data) and Narooma (Marine Rescue) had 140.0 mm (101 years of data), the highest July daily rainfall on record for each station. This system also generated strong to damaging wind gusts with some coastal sites recording maximum daily wind gusts over 100 km/h, including 122 km/h at Port Botany (Molineux Point AWS). Large waves ranging from 5 to 7 m were recorded along the southern and central New South Wales coasts. The Sydney Buoy had a significant wave height of 5.4 m on the 1st and Batemans Buoy had a significant wave height of 6.6 m on the 2nd. The large seas and swells led to some coastal erosion.
On 2 July, a cold front and low pressure system crossed southern parts of Western Australia, generating widespread rainfall across the southern and central west coast. There were daily rainfall totals of 10 to 25 mm recorded across the southern and central coast of Western Australia in the 24 hours to 9 am on 3 July, with higher falls of 50 mm in the South West district. Several sites had their highest daily July rainfall on record, including 104.5 mm at Busselton Shire (145 years of data), and some stations had their highest daily annual rainfall on record including 107.8 mm at Ludlow (29 years of data).
From 8 to 10 July, a strong cold front brought widespread rainfall, strong to damaging winds and below average temperatures to south-eastern Australia. Rainfall totals greater than 25 mm were recorded in the 24 hours to 9 am on the 10th, for large parts of south-eastern South Australia, Victoria's south-west and northern parts of Tasmania. In South Australia, rainfall totals of 25 to 50 mm were recorded in the Mount Lofty Ranges and the Mid North districts, and some sites had their highest daily rainfall on record for July, including:
- 73.4 mm at Piccadilly (Woodhouse) (25 years of data)
- 67.0 mm at Uraidla (135 years of data)
The cold air mass behind this system also led to 10 to 50 cm of snow in elevated areas of Victoria, New South Wales and Tasmania.
On the afternoon of 18 July, a surface trough combined with an upper-level trough triggering severe thunderstorms in south-eastern and central parts of Queensland. This system brought moderate rainfall totals, with 10 to 15 mm in areas of the Southeast Coast, and Wide Bay and Burnet districts in the 24 hours to 9 am on the 19th. Hail was reported across parts of the south-east, including 2 to 3 cm hail in southern areas of Brisbane.
On the afternoon of 23 July, thunderstorms impacted parts of south-west Western Australia, ahead of a cold front that crossed the west coast. This system was associated with isolated heavy rainfall and gusty winds. Daily rainfall totals of 10 to 25 mm were recorded across the south-west in the 24 hours to 9 am on the 24th, with 25 to 50 mm recorded along southern and central coast areas. The highest daily rainfall total was 58.4 mm at Karragullen North in the Lower West district. On the 23rd, there was a confirmed cool season tornado in the Perth suburb of City Beach with reports of property damage.
From 24 to 27 July, a large cold front with a strong feed of tropical moisture from the Indian Ocean, brought widespread rainfall across a broad area of Australia. In the 72 hours to 9 am on the 27th, rainfall totals greater than 10 mm were recorded across Western Australia's south-west and interior, southern parts of the Northern Territory, large parts of South Australia, Tasmania, Victoria, New South Wales and Queensland. The highest three-day rainfall total was recorded in South Australia's Yorke Peninsula district at Picadilly (Woodhouse) at 112.6 mm. Several sites in South Australia, Victoria and Tasmania also had their highest daily rainfall for July, including:
- 23.2 mm at Keith (Munkora) in South Australia on the 26th (25 years of data)
- 28.4 mm at Nhill Aerodrome in Victoria on the 26th (23 years of data)
- 87.2 mm at Longley (River Ben Road) in Tasmania on the 27th (21 years of data)
From 24 to 31 July, a cold air mass behind a series of cold fronts, combined with a ridge of high pressure led to daytime and nighttime temperatures that were 2 to 6 °C below average across much of Western Australia. Many stations had their lowest July daily maximum temperature on record on the 24th, including 11.6 °C at Jurien Bay, which was also the station's lowest daily maximum temperature ever recorded (56 years of data). Minimum temperatures on the 25th were up to 6 °C below average in the south-west of the state, and several sites had their lowest nighttime temperatures for July, including 3.9 °C at Mandurah. This was also the station's lowest minimum temperature ever recorded (24 years of data). Perth Metro station recorded 0.3 °C, the lowest minimum temperature for the site since 2010. Reports of snow in the Stirling Ranges included snow settling on Bluff Knoll and falling there three times in 8 days.
On 1 August, a coastal trough developed off the Queensland coast and moved south. The trough developed into a complex low pressure system off the northern New South Wales coast on 2 August. This system generated several days of rainfall across eastern and adjacent inland areas of New South Wales, and strong to damaging winds and large swells. Over the 3 days to 9 am on the 4th, greater than 50 mm was recorded across coastal areas of New South Wales and falls of 25 to 50 mm further inland. Totals between 100 and 150 mm were observed across the Mid North Coast and Hunter districts. The highest multi-day rainfall total was 233.6 mm at Careys Peak (Barrington Tops). Many sites had their highest daily rainfall total in the 24 hours to 9 am, including:
- 125.0 mm at Crawford River (Crawford) (23 years of data)
- 101.8 mm at Cessnock Airport AWS (37 years of data)
- 75.6 mm at Taree Airport AWS (29 years of data)
The heavy rainfall resulted in minor to major flooding across some catchments in northern New South Wales. There was major flooding along the Namoi River at Gunnedah, with levels peaking above the major flood level of 7.90 m, at around 8.5 m on the morning of the 5th.
The system generated damaging winds and large swells, with a hazardous surf warning issued for the New South Wales to south-eastern Queensland coastline. Nobbys Head at Newcastle record a maximum wind gust of 104 km/h on the 2nd, its strongest wind gust in August since 2012.
The system gradually moved away from the coast on the 3rd, with damaging winds and heavy rain at Lord Howe Island. Lord Howe Island Aero recorded a maximum wind gust of 107 km/h on the 3rd, and a 2-day rainfall total to 9am on the 4th of 123.1 mm.
On 2 August, the coastal low that had developed off the Queensland coast combined with a high pressure system in the south Tasman Sea, and a mass of cold air, to direct cooler air over northern Australia. Daytime temperatures were 8 to 10 °C below average on the 2nd, and Armidale (Tree Group Nursey) in north-eastern New South Wales had its coldest day on record at 2.5 °C (29 years of data). Much of northern Australia had minimum temperatures on the 3rd and 4th from 6 to 12 °C below average. Some sites in northern Queensland and the Northern Territory had their lowest August minimum temperature on record, including:
- 0.7 °C at Winton Airport (Queensland) on the 3rd (23 years of data).
- 4.1 °C at Tennant Creek Airport (Northern Territory) on the 4th, also an annual record (57 years of data).
In the New South Wales Northern Tablelands the rain fell as snow, with widespread reports of falls up to 50 cm in depth, including at Guyra, Walcha and Armidale. This was the most significant snow event for the region since July 1984. The snow blocked roads, disrupted transport and brought down power lines. In south-eastern Queensland there were snow flurries in the Darling Downs and Granite Belt districts.
Between 18 and 20 August a cold airmass behind a cold front brought low temperatures to large parts of northern, eastern and southern Australia. Clear skies and light winds resulted in night-time temperatures between 2 and 10 °C below average. Thredbo AWS in New South Wales recorded a minimum temperature of -13.2 °C on the 18th, the station’s 3rd lowest August minimum temperature on record (59 years of data) and the lowest recorded anywhere in New South Wales since August 2018.
On 25 August, a cold airmass behind a strong cold front, brought cooler than average daytime temperatures to large parts of Western Australia. Daytime temperatures were 6 to 8 °C below average for parts of the Lower West, Central West and Central Wheat Belt districts, and 2 to 6 °C below average for much of the rest of the state. Several sites had their lowest August daily maximum temperature on record, including:
- 11.4 °C at Perth Metro, the coldest day on record for the current site (32 years of data) and coldest day since July 1975 in the composite record
- 8.7 °C at Bickley (32 years of data)
- 10.7 °C at Cunderdin Airfield (29 years of data).
Snow flurries were reported across the Stirling Ranges including at Bluff Knoll.
On 29 August, a strong cold front associated with a low pressure system moved across south-eastern Australia, generating strong to damaging winds across South Australia's Eyre Peninsula and south-east, much of Victoria and south-eastern areas of New South Wales. The cold front was also associated with showers, isolated thunderstorms, below average temperatures and snow down to low levels. On the 29th, wind gusts exceeded 80 km/h across parts of southern and south-eastern South Australia, southern New South Wales and most of Victoria. Wind gusts over 100 km/h were record at alpine or coastal sites, including 117 km/h at Cape Nelson Lighthouse (Victoria) an August record for the site (23 years of data) in. The highest wind gust recorded was 128 km/h at Mount Hotham in Victoria. In the northern suburbs of Adelaide on the morning of the 29th, there were likely two small and fast-moving tornadoes as the front moved through.
Maximum temperatures on the 29th were 2 to 6 °C below average for southern parts of Australia and extended to large parts of the country on the 30th. There were reports of snow across New South Wales and Victorian alpine regions as well as snow flurries in the Mount Lofty Ranges in South Australia, Mount Macedon in Victoria, and locations in the Central, Southern and Northern Tablelands districts of New South Wales and the Brindabella Range in the Australian Capital Territory.
Between 1 and 4 September, a high pressure system centred over the mainland directed a dry and cool south-easterly airmass towards central and northern parts of the country. Daytime temperatures were 2 to 6 °C below average, while night-time temperatures were 2 to 8 °C below average with some areas in the Northern Territory, Queensland and Western Australia recording minimum temperatures between 3 and 10 °C. Several sites had their coldest September mornings on record, including:
- 3.6 °C at Birdsville Airport in Queensland on the 1st (26 years of data)
- 8.7 °C at Kununurra Aero in Western Australia on the 4th (40 years of data)
On 5 September, a strong cold front moved across parts of western and southern Western Australia triggering widespread rainfall and damaging winds. In the 24 hours to 9 am on 6 September, greater than 10 mm of rainfall was recorded across the state's south-west, with coastal areas receiving between 25 and 50 mm. Several sites had their highest September daily rainfall on record, including the highest daily rainfall at Windy Harbour of 73.2 mm (41 years of data). Daily maximum wind gusts exceeded 60 km/h across the state's south and west, with some coastal sites recording wind gusts over 80 km/h. Shark Bay Airport recorded a maximum daily wind gust of 81 km/h, the station's highest daily wind gust on record for September (23 years of data).
On 8 September, a cloud band associated with a low pressure trough developed across northern and central areas of the country. This system drew in tropical moisture from the Indian Ocean and triggered isolated thunderstorms across parts of southern Northern Territory, northern New South Wales and eastern South Australia with rainfall totals of 10 to 25 mm recorded in the 24 hours to 9 am on the 9th. The trough was pushed eastwards over South Australia on the 9th, by a cold front associated with a low pressure system. This system interacted with tropical moisture and brought rainfall to an area extending from south-eastern South Australia and towards the east coast of New South Wales. This system was also associated with severe thunderstorms, and two confirmed tornadoes reported in paddocks near Young and Caragabal in New South Wales on the afternoon of the 10th. The highest rainfall totals occurred across much of New South Wales in the 48 hours to 9 am on the 11th, with falls of 25 to 50 mm across large parts of the state, and totals greater than 100 mm for the Sydney Metropolitan and Illawarra districts. Most of the rainfall fell in the 24 hours to 9 am on the 11th, with many sites, especially in the Sydney Metropolitan district, recording daily falls over 100 mm, which exceeded the monthly average rainfall total of 50 to 100 mm. Sydney Observatory Hill had its 2nd-wettest September day on record at 122.0 m to 9 am on the 11th, and its highest daily September rainfall since 1879. Many sites also had their highest September daily rainfall on record from this event on the 11th, including 145.8 mm recorded at Randwick (Randwick St) (118 years of data). The low pressure system moved off the New South Wales southern coast on the evening of the 10th and into the Tasman Sea.
Between 13 and 18 September, Queensland's North Tropical Coast had persistent showers and isolated thunderstorms, from moist onshore easterly flow. Weekly rainfall totals, to 9 am on the 18th, of greater than 100 mm were record in the North Tropical Coast and Tablelands, and Herbert and Lower Burdekin districts, with isolated falls greater than 200 mm in the North Tropical Coast and Tablelands district. The average monthly rainfall for the area is between 25 and 100 mm.
The heaviest falls occurred around Innisfail and the Johnstone River catchment on the 15th and 16th. Daily rainfall totals over 100 mm were reported with some sites having their highest September daily rainfall on record. Topaz, in the upper Johnstone River, record 376.0 mm in the 24 hours to 9 am on the 17th. This is the highest September daily rainfall total ever recorded in Queensland, and the second-highest anywhere in Australia in September. The heavy rain around the North Tropical Coast led to flash flooding and river level rises.
On 15 and 16 September, a strong cold front crossed the south-east of Australia bringing strong to damaging winds. Many sites across south-eastern South Australia, much of southern Victoria, Tasmania and southern New South Wales, recorded wind gusts exceeding 80 km/h, including:
- 144 km/h at Kunanyi / Mount Wellington (Tasmania) on the 15th
- 133 km/h at Mount Hotham in Victoria on the 15th
- 104 km/h at Melbourne Airport in Victoria on the 15th, the station's highest September gust since 2002.
On the afternoon of 2 October, an upper trough that moved across southern Queensland, supported the formation of a supercell thunderstorm in Queensland's Wide Bay and Burnett district. This system was associated with large hailstones around Maryborough, including hailstones up to 8 cm at Tinana and 5 to 6 cm at Oakhurst. Additionally, isolated rainfall totals of 25 to 50 mm were recorded in the 24 hours to 9 am on the 3rd across the Wide Bay and Burnett district.
Between 8 and 10 October, a series of cold fronts and low pressure systems crossed Tasmania bringing strong to damaging wind gusts, days of rain and scattered thunderstorms, some severe. On the 10th, a severe weather warning for widespread damaging winds was issued across Tasmania, and daily wind gusts over 100 km/h were recorded across many sites with some setting their highest daily October maximum wind gusts on record, including 163 km/h at Maatsuyker Island Lighthouse (27 years of data) and 109 km/h at Launceston Airport (22 years of data). In the 72 hours to 9 am on the 11th, up to 25 mm of rainfall was recorded across much of Tasmania, with 50 to 100 mm in western and central parts of the state. Several days of rainfall led to flood watches issued for large parts of Tasmania, with minor flood warnings for the Meander, North Esk and Huon Rivers and moderate flood warnings for the River Derwent.
Between 10 and 18 October, a series of low pressure troughs generated unstable conditions and led to severe thunderstorm activity across areas of Queensland and north-eastern New South Wales, including:
- On the 10th, a maximum wind gust of 100 km/h was recorded at Glen Innes Airport AWS in New South Wales, the station's highest wind gust on record for October (23 years of data).
- On the 12th, reports of large hail (2 to 5 cm) north of Goondiwindi, giant hail (> 6 cm) near Bellthorpe in Queensland, and large hail (4 to 5 cm) at Stanmore in New South Wales.
- On the 17th, large hail (> 2cm) was observed at many locations in New South Wales including Coonabarabran, Dubbo, Morlong and Gilgandra and giant hail (> 5cm) at Blaxlands Creek and Gulgong.
- On the17th, damaging wind gusts were observed across New South Wales, including 91 km/h at Williamtown RAAF, and 83 km/h at Paterson (Tocal AWS) which was also the highest wind gust on record for the station (24 years of data).
- On the 18th, giant hail (> 5cm) at Caboolture and Samford in Queensland.
- On the 18th, maximum wind gusts of 80 km/h at Amberly Aero and 83 km/h at Dalby Airport in Queensland.
During the second half of the month, dominant high pressure systems allowed a hot dry airmass to develop across much of the country, leading to low-intensity to severe heatwave conditions across parts of northern, central and eastern Australia. Daytime temperatures were generally 2 to 10 °C above average with some instances of temperatures greater than 12 °C above average. Many sites had their highest October maximum temperature on record including:
- 44.3 °C at Telfer Aero in Western Australia on the 18th (50 years of data).
- 43.9 °C at Tarcoola Aero in South Australia on the 19th (37 years of data).
- 46 1 °C at Birdsville Airport in Queensland on the 21st (26 years of data), an October state record and the eighth-highest on record nationally.
- 44.9 °C at Wanaaring in New South Wales on the 21st (35 years of data), an October state record.
- 39.8 °C at Williamtown in New South Wales on the 22nd (77 years of data).
- 44.0 °C at Longreach in Queensland on the 26th (60 years of data).
- 39.1 °C at Brisbane Airport in Queensland on the 27th (32 years of data).
Night-time temperatures were generally 2 to 8 °C above average with some instances of temperatures greater than 8 °C above average. Many sites had their highest October maximum temperature on record including:
- 32.0 °C at Carnegie in Western Australia on the 19th, the third-highest national and the state's highest October minimum temperature on record (38 years of data).
- 31.7 °C at Telfer Aero in Western Australia on the 19th, the fourth-highest national and the state's highest October minimum temperature on record (50 years of data).
- 30.1 °C at Brewon AWS in New South Wales on the 22nd, and a state record for October.
- 27.1 °C at Willis Island (Coral Sea) on the 22nd (98 years of data).
On 22 October, strong winds impacted Victoria as a low pressure system and cold front moved across the south-east of the country. Maximum wind gusts exceeded 80 km/h for most of the state, with the highest gusts recorded in elevated and coastal areas including:
- 130 km/h at Wilsons Promontory Lighthouse
- 120 km/h at Colac (Mount Gellibrand)
- 91 km/h at Stawell Aerodrome, an October record for the site (23 years of data).
On 26 October, a cold front and low pressure trough triggered thunderstorms, strong winds and moderate to high rainfall across Victoria and southern inland New South Wales. In the 24 hours to 9 am on the 27th, 15 to 25 mm was recorded in large parts of Victoria with falls of 25 to 50 mm in central, northern and eastern Victoria, including 35.4 mm at Melbourne Olympic Park, the site's wettest October day since 2010. There was evidence of a likely tornado in Melbourne's western suburbs on the afternoon of the 26th.
Between 26 and 28 October, widespread thunderstorms impacted an area extending from central Queensland to northern New South Wales as a series of low pressure troughs moved across the region, with impacts including:
- On the 26th, a wind gust of 109 km/h at Gayndah Airport, the second-highest October wind gust on record behind 180 km/h in 2007 (23 years of data).
- On the 26th, a wind gust of 96 km/h at Archerfield Airport, its second-highest October wind gust on record behind 102 km/h in 1941.
- On the 26th, giant hail was reported at numerous locations in southern Queensland including at Yengarie in Fraser Coast region, Goonda, Ipswich and St Lucia.
- On the 28th, hail was reported at several sites across central Queensland including giant hail (7 cm) at Rockhampton and large hail (3 to 4 cm) at Gladstone.
- In the 24 hours to 9 am on the 29th, daily rainfall totals greater than 50 mm were recorded in isolated areas of the Northern Rivers district of New South Wales and the Southeast Coast district of Queensland, including 109.2 mm at Tweeds Head Golf Club, and 53.8 mm recorded at Brisbane, its highest October daily rainfall since 2020.
On 1 November, multiple severe thunderstorms occurred in south-eastern Queensland and north-eastern New South Wales. These storms generated intense rainfall and strong to damaging winds. Several areas experienced intense rainfall, including:
- 60 mm in 30 minutes at Glenreagh (New South Wales)
- 84 mm in 1 hour at Grafton Airport (New South Wales)
- 60 mm in less than 1 hour at O'Conner (Queensland).
Daily rainfall totals in the 24 hours to 9 am on the 2nd, of greater than 10 mm were recorded extending from north-eastern New South Wales to central Queensland, with isolated daily totals of 25 to 100 mm.
These storms were also associated with strong to damaging winds across the region, with many sites recording wind gusts over 50 km/h. The highest observed wind gusts included:
- 104 km/h at Dalby Airport (Queensland)
- 89 km/h at Grafton Airport (New South Wales).
On 12 November, minimum temperatures were 4 to 12 °C below average across south-eastern Australia, following a cold front that crossed the region and a high pressure system that settled behind it producing clear skies and light winds. Many sites in South Australia, Victoria and New South Wales had their lowest on record minimum temperature for November, including;
- -2.3 °C at Canberra Airport in the Australian Capital Territory (86 years of composite data)
- -0.5 °C at Orange Agricultural Institute in New South Wales (50 years of data).
- -0.4 °C at Yarrawonga in Victoria (33 years of data).
- 1.9 °C at Renmark Aero in South Australia (31 years of data).
Between 10 and 16 November tropical moisture interacted with deepening surface troughs that moved eastward over the mainland, generating widespread rain and thunderstorms, some severe, across much of central and northern Australia. From the 14th, unsettled conditions formed a thick cloud band leading to severe storms with localised heavy rain and giant hail (up to 7 cm) affecting parts of Queensland, New South Wales, Northern Territory, South Australia and Western Australia. Weekly rainfall totals, to 9 am on the 17th, exceeding 50 mm were recorded across large areas of the north and east. Several stations in south-east Queensland recorded their highest November rainfall record on the 16th, including 101.0 mm at Bellbird Creek TM (26 years of data).
On 15 November tropical low 02U formed in the Indian Ocean north of the Kimberley region of Western Australia. The system reached tropical cyclone intensity on the 18th and was named Tropical Cyclone Fina when around 260 kilometres north of Darwin. Fina reached Category 2 intensity shortly before crossing the Cobourg Peninsula in the Northern Territory on the evening of the 21st. On the 22nd Fina strengthened further to Category 3 (Severe) intensity as it tracked west south-westwards across the Van Diemen Gulf, making a second landfall over the southern part of Melville Island, causing significant damage to local communities.
The greater Darwin region experienced damaging winds on the 22nd, with a strongest observed wind gust of 107 km/h at Darwin Airport. Fina was the strongest system to pass close to Darwin since Tropical Cyclone Marcus in March 2018. However, its very destructive core passed to the north. Fina also brought heavy rainfall to the greater Darwin region, with daily rainfall totals exceeding 150 mm in the 24 hours to 9 am on the 23rd. Several sites had their highest November daily rainfall on record, including:
- 168.6 mm at Darwin Airport (85 years of data)
- 203.8 mm at Humpty Doo Collard Road (45 years of data)
- 430.0 mm at Middle Point (25 years of data), also the highest daily rainfall ever recorded in the Northern Territory in November, and the fourth-highest in Australia.
Fina strengthened further in the Bonaparte Gulf, reaching a peak intensity as a high-end Category 4 system as it approached the north-eastern Kimberley coast of Western Australia. Fina crossed the coast near the mouth of the Berkeley River around 9:30 pm AWST on the 24th as a Category 3 system before rapidly weakening.
Fina is the strongest tropical cyclone on record, since 1980, to have occurred in November in the Australian region. It also made the equal earliest landfall on record, since reliable track information began in 1970.
Between 22 and 27 November, thunderstorms, some severe, impacted large parts of Queensland and New South Wales, driven by surface troughs and a hot, humid, unstable airmass. These storms were associated with several days of low to moderate rainfall totals, large to giant hail, and damaging to destructive winds, including:
- On the 24th, giant hail up to 14 cm at Chandler in Brisbane and 10 to 12 cm at Alexandra Hills
- On the 24th, a wind gust of 96 km/h at Brisbane Aero, the 2nd highest in November for the station (26 years of data)
- On the 26th, a wind gust of 80 km/h at Inverell Research Centre, its highest on record for November (23 years of data)
- On the 26th, wind gusts over 70 km/h across Greater Sydney, including 83 km/h at Manly (North Head).
Between 27 and 30 November low intensity to severe heatwave conditions impacted large parts of Queensland. Maximum and minimum temperatures were 2 to 6 °C above average, as a trough moved across the state dragging northerly winds inland towards the coast. Many coastal sites had their warmest November night on record, including:
- 26.0 °C at Rockhampton Aero on the 27th (87 years of data)
- 27.9 °C at Townsville Aero on the 29th (86 years of data)
- 27.2 °C at Mackay Aero on the 30th (40 years of data)
On 30 November, a cold front with a cold air mass behind it moved across south-eastern Australia, bringing cooler conditions. Maximum temperatures on 1 December were 6 to 10 °C below average for much of mainland south-eastern Australia, and for several alpine areas in Victoria and New South Wales they were below 0 °C. Following the passage of the cold front, minimum temperatures on the 2nd were 6 to 10 °C below average in New South Wales, and below 0 °C in elevated areas of the south-east. Canberra Airport had its coldest December minimum temperature on record at -0.3 °C on the 2nd (86 years of composite data). There were reports of several centimetres of snow in alpine areas of Victoria, New South Wales and Tasmania.
Between 4 and 6 December, a slow moving high pressure trough dragged hot north-westerly winds across the south-east of the country ahead of a cold front. Daytime temperatures on the 4th across southern parts of South Australia, Victoria, and Tasmania were 2 to 10 °C above average. In Tasmania, strong to damaging winds developed ahead of the trough, with many sites on the east coast recording wind gusts over 90 km/h, including:
- 102 km/h at Hobart (Ellerslie Road)
- 93 km/h at Friendly Beaches, a December record for the station (23 years of data).
The strong winds, combined with recent dry conditions, saw a number of bushfires starting on the 4th across Tasmania, most significantly at Dolphin Sands near Swansea.
The hot conditions moved into New South Wales on the 5th and 6th with low-intensity to severe heatwave conditions developing. Daytime temperature were 6 to 10 °C above average for much of the state. At many sites in Sydney and the Hunter Valley, maximum temperatures on the 6th were above 40 °C, including 41.9 °C at Badgerys Creek AWS and 40.2 °C at Williamtown RAAF.
Increasing winds on 6th elevated Fire Danger ratings to Extreme across much of New South Wales, with Total Fire Bans declared. By the afternoon of the 6th, many bushfires were burning across central and eastern New South Wales. Major bushfires impacted some areas of the Mid-North and Central Coast districts for several days, including:
- a fire south of Bulahdelah which burned more than 4,000 hectares
- at Milsons Gully a fire burnt over 12,000 hectares
- a fire impacted communities around Koolewong, with disruptions to communications and infrastructure.
Smoke from the fires also led to poor air quality around the Newcastle and the Central Coast area.
Between 10 and 16 December, a series of inland troughs combined with a warm and unstable airmass triggering thunderstorms, some severe, across New South Wales, Queensland and Victoria. Notable impacts included:
- On the 11th, there were strong wind gusts across northern New South Wales, including 100 km/h at Burke Airport, its highest daily wind gust on record for December (24 years).
- In the 24 hours to 9 am on the 13th, heavy rainfall totals of 50 to 100 mm were recorded around the Lake Macquarie region of New South Wales.
- In the 24 hours to 9 am on the 14th, rainfall totals of 15 to 25 mm around Ballart (Victoria), locally intense at times.
- On the 14th, wind gusts of 91/km/h at New May Downs and Mount Isa in Queensland, and at Walgett in northern New South Wales.
- In the 24 hours to 9 am on the 16th, 169.8 mm was recorded at Tewantin RSL Park (Queensland), a December daily rainfall record (30 years of data) This included 96 mm in 2 hours, with flash flooding in parts of the Wide Bay and Burnett district.
Between 14 and 21 December, hot conditions impacted large parts of southern Australia. A west coast trough that developed on 14 December, directed hot and unstable air from the interior of the continent towards south-western Western Australia. In the following days, low-intensity to severe heatwave conditions, under a high pressure system, moved across southern parts of Western Australia to South Australia, southern Northern Territory, Victoria, Tasmania, New South Wales and south-western Queensland, pushed by an approaching cold front. Maximum temperatures were up to 12 °C above average, and minimum temperatures up to 10 °C above average. Notable December daily maximum temperature records included:
- 47.5 °C at Eyre (Western Australia) on the 17th (42 years of data)
- 42.2 °C at Sydney (Observatory Hill) (New South Wales) on the 19th, equal-highest in December in the composite record (starting in 1859).
Notable December daily minimum temperature records included:
- 22.2 °C at Moruya Heads Pilot Station (New South Wales) on the 20th (115 years of data)
- 29.9 °C at Lightning Ridge Visitor Information Centre (New South Wales) on the 21st (29 years of data)
- 25.7 °C at Williamtown RAAF (New South Wales) on the 22nd (77 years of data).
On 21 December, a cold front interacted with a trough extending from north-west to the south-east Australia generating widespread rainfall and triggering thunderstorms, some severe. Daily rainfall totals for the 24 hours to 9 am on the 22nd between 10 and 50 mm were recorded in a band from western Tasmania, through central and eastern Victoria and parts of the south-west of the state, and into inland areas of New South Wales. The highest daily rainfall totals were recorded in north-eastern Victoria, including 186.8 mm at Dartmouth Reservoir. Thunderstorms brought strong winds to eastern Victoria and inland New South Wales, including:
- 115 km/h at Mount Buller (Victoria)
- 91 km/h at West Wyalong Airport AWS (New South Wales), its highest daily December wind gust on record (23 years of data).
In Tasmania, daytime temperatures on the 24th and 25th were 6 to 8 °C below average, including:
- -0.1 °C at Kunanyi / Mount Wellington, its equal lowest December daily maximum temperature on record (45 years of data)
- 14.7 °C at Hobart (Ellerslie Road), its lowest December daily maximum temperature since 1964.
There were reports of snow fall at elevated areas in Tasmania including at Kunanyi / Mount Wellington.
On 15 December, tropical low 07U formed along a weak trough in the northern Arafura Sea. 07U turned south on the 18th and moved along the east coast of the Northern Territory on the 19th and 20th, bringing several days of rainfall. In the 48 hours to 9 am on the 21st, 50 to 150 mm was recorded in parts of the southern Gulf coast and adjacent inland areas of the Northern Territory. The highest daily rainfall totals in the Northern Territory in this period included:
- 148.0 mm at Centre Island on the 20th, a December daily rainfall record (58 years of data)
- 107.0 mm at McArthur River Mine Airport on the 21st, the station's third-highest December daily rainfall (57 years of data).
From 21 December, tropical low 07U moved onto the mainland and became embedded in the developing monsoon trough. From 22 December to 2 January the system moved slowly from the eastern Northern Territory through north-western Queensland, generating widespread heavy rainfall. Seven-day rainfall totals for 25–31 December exceeded 200 mm for parts of the Gulf Country in north-western Queensland and were up to 600 mm to the north of Julia Creek and Cloncurry. A number of sites in the region had their highest December daily rainfall on record, including:
- 117.6 mm at Cloncurry Airport on the 26th (34 years of data)
- 123.6 mm at Normanton Airport on the 29th (25 years of data)
- 151.8 mm at Julia Creek on the 30th (composite observations began in 1912)
- 240.0 mm at Millungera Station on 30th, also an annual record (119 years of data).
Prolonged cloud cover during the period, resulted in daytime temperatures up to 12 °C below average for a large area of northern and western Queensland, particularly on the 28th and 29th. Many stations had their lowest December daily maximum temperature on record, including:
- 26.4 °C at Burketown Airport on the 28th (25 years of data)
- 22.6 °C at Cloncurry Airport on the 29th (33 years of data).
On the 30th the Flinders River at Julia Creek peaked above the major flood level of 4.5 metres at around 4.88 metres, slightly lower than in February 2019. By the 31st, moderate flooding was also occurring along the Norman, Cloncurry and Western Rivers, and minor flooding along the Georgina River. In the Northern Territory, the McArthur River reached the level of the Borroloola Bridge deck. The heavy rainfall and flooding caused prolonged closures of major roads and rail lines, cut access to many communities and cause major stock losses. Further rain in January caused renewed river level rises, with the lower Flinders River remaining at major flood levels until early February.
Between 28 and 31 December, a low pressure system, embedded into a monsoon trough, combined with enhanced onshore winds to bring heavy to intense rainfall across north-eastern Queensland. Daily rainfall totals exceeded 100 mm each day in areas along the North Tropical Coast from Townsville to Cairns, including:
- 405.6 mm at Bingil Bay on the 31st, a December daily rainfall record (101 years of data)
- 414.0 mm at Innisfail Wharf Alert on the 31st, an annual record (26 years of data).
Rainfall totals for the 4-day period to 9 am on the 31st exceeded 150 mm across the region, with coastal and surrounding areas recording 200 to 400 mm, and localised falls greater than 600 mm. The highest 4-day rainfall total was 1114.2 mm at Bingil Bay, an annual record for the site (101 years of data).
On 27 December, tropical low 08U formed in the Indian Ocean about 700 km north north-east of Broome (Western Australia). On the 28th the system intensified to a tropical cyclone and was named Tropical Cyclone Hayley. As Hayley tracked towards the Kimberley coast it rapidly intensified to Category 4 (severe) strength by late on the 29th. Hayley made landfall around 5 pm AWST on the 30th as a Category 3 system, near the communities of Djarindjin and Lombadina on the Dampier Peninsula. As it crossed the Dampier Peninsula, Hayley reportedly caused damage to property and infrastructure and downed trees and power lines. The highest observed wind gusts were:
- 157 km/h at Lombadina Airstrip (a third-party AWS) on the 30th
- 137 km/h at Yampi Sound (Defence) on the 31st.
The system weakened to a tropical low while moving across the inland Kimberley, bringing widespread rain to the region. Four-day rainfall totals, to 9 am on 2 January, of 50 to 200 mm were recorded along its path. The highest daily rainfall totals included:
- 108.0 mm at Cygnet Bay on the 31st
- 182.2 mm at Landsdowne the 1st, a January daily rainfall record (45 years of data).
On 3 January, tropical low 11U developed to the north-west of the Cocos (Keeling) Islands. The system intensified on the 5th and was named Tropical Cyclone Jenna, generating strong winds and heavy rainfall to the region. Jenna intensified to a Category 4 system on the 6th and then rapidly weakened below tropical cyclone strength on the 8th just prior to exiting the Australian region. Cocos Island Airport observed a maximum wind gust of 91 km/h on the 5th and 70.2 mm of rainfall in the 24 hours to 9 am on the 6th. This was the first time since reliable track records began in 1970 that the Cocos (Keeling) Islands have been impacted by two tropical cyclones in one season, following the passage of Tropical Cyclone Grant in December.
Between 4 and 10 January, widespread low to severe-intensity heatwaves impacted large parts of the country, with locally extreme heatwave conditions observed in parts of Western Australia, eastern Victoria and south-eastern New South Wales. Maximum and minimum temperatures were 6 to 12 °C above average as a high pressure system in the Tasman Sea directed hot northerly winds towards the south-east of the country. Maximum temperatures exceeded 45.0 °C at many stations, including:
- 49.0 °C at Onslow Airport (Western Australia) on 7 January
- 48.2 °C at Tarcoola Aero and Kyancutta (both in South Australia) on 8 January
- 46.5 °C at Walpeup Research (Victoria) on 9 January.
On the 7th, Paraburdoo Aero in Western Australia had its highest annual daily minimum temperature on record at 35.8 °C. This was also the highest minimum temperature ever recorded in Western Australia, surpassing the previous record of 35.5 °C set on 21 January 2003 at Wittenoom, and the sixth-highest ever recorded nationally.
On 9 January, most of Victoria, southern parts of South Australia and New South Wales experienced extreme to catastrophic fire danger due to hot temperatures and strong winds. Daytime temperatures were more than 12 °C above average across the region, and temperatures were over 45 °C in an area, extending across north-western Victoria and south-western New South Wales. A state-wide Total Fire Ban was declared for Victoria on the 9th, as damaging wind gusts exceeding 90 km/h were recorded across large parts of the state. The Victorian SES reported that over 200 fires started on the 9th, and the most significant fires, at Walwa and Longwood, intensified under the extreme conditions.
On 7 January, tropical low 12U formed within a monsoon trough north of Willis Island and tracked south-westwards towards Queensland's north-east coast. The system intensified on the 10 and was named Tropical Cyclone Koji, reaching Category 2. Koji brought strong wind gusts to Willis Island, with a maximum daily wind gust of 133 km/h recorded on the 11th, the 2nd highest on record for January (83 years of data). The system began to weaken on the morning of the 11th before making landfall between Ayr and Bowen below tropical cyclone intensity. Maximum wind gusts exceeded 80 km/h between Bowen and Mackay, with Hamilton Island recording a peak wind gust of 117 km/h. After crossing the coast, ex-Tropical Cyclone Koji tracked inland in a westerly direction for several days, producing widespread rainfall along its path. Over the four days 12 to 15 January, 200 to 400 mm of rain was recorded across the Queensland central coast and tablelands. Mt Jukes recorded the highest 4-day rainfall total (at a Bureau gauge) of 464.0 mm. The heavy rainfall on already saturated soils led to riverine and flash flooding, including major flooding along the Pioneer River at Mackay. Further inland, falls of 25 to 100 mm were recorded across western districts and the Gulf Country, resulting in renewed rises in some rivers flooded by heavy rains at the end of December.
On 15 January, tropical low 14U formed in the Coral Sea to the north-west of New Caledonia before tracking south-east. On the 21st, the system passed close to Norfolk Island generating strong winds and heavy rainfall. Norfolk Island Aero observed a maximum daily wind gust was 78 km/h on the 21st. In the 2-day period to 9 am on the 21st, Norfolk Island Aero recorded 260.0 mm, the highest 2-day rainfall total for the station in January, surpassing the previous record set in 1959 (with observations starting in 1891). This included 166.4 mm in the 24 hours to 9 am on the 21st, its second-highest January daily rainfall on record.
On 15 January, a deepening low pressure system interacted with a moist east to south-easterly flow and brought severe storms with heavy rain to many locations in south-western Victoria. In the 24 hours to 9 am on the 16th Lorne (Mount Cowley) recorded a daily rainfall total of 186.2 mm, the highest ever recorded in the town (composite observations started in 1882). Flash flooding occurred along the Wye River, Kennett River, Cumberland River and at Lorne, inundating roads and campsites and washing some cars out to sea.
On 17 January, a low pressure trough combined with moist onshore flow generating high to intense rainfall with severe thunderstorms in the Sydney Metropolitan, Hunter, Central Tablelands and Illawarra districts of New South Wales. Daily rainfall totals in the 24 hours to 9 am on the 18th were greater than 50 mm for the region and with falls greater than 100 mm across much of Sydney and the Illawarra. Several sites had their highest January daily rainfall on the 18th including:
- 100.0 mm at Parramatta North (Masons Drive) (61 years of data)
- 140.2 mm at Camden Airport AWS (54 years of data)
- 179.6 mm at Terrey Hills AWS (22 years of data), also an annual record
- 219.8 mm at Katoomba (Farnells Rd) (140 years of data)
- 259.0 mm at Wattamolla (Griffiths) (31 years of data).
Sydney (Observatory Hill) recorded 126.8 mm, its highest January daily rainfall since 1988. The heavy rainfall brought flash flooding to parts of the Sydney Metropolitan area, disrupting road and train transport on some routes.
On 21 January, tropical low 16U developed over the Indian Ocean, north-west of Australia and moved eastwards towards the Kimberley coast. The system intensified to Category 1 early on the 24th and was named Luana. Tropical cyclone Luana intensified to a Category 2 system before making landfall near Beagle Bay on the northern Dampier Peninsula, north of Broome in the afternoon of the 24th. After making landfall the system weakened and was downgraded to a tropical low on the afternoon of the 25th and continued to move southwards. The maximum observed wind gusts on the 24th were 106 km/h at Curtin Aero and Lombadina Airstrip and 98 km/h at Derby Aero. The Kimberley coast and adjacent inland areas recorded over 50 mm of rainfall in the 48 hours to 9 am on the 26th, with the highest falls of over 200 mm between Derby and Cape Leveque. The highest daily rainfall totals in the 24 hours to 9 am on the 25th were 231.8 mm at Curtin Aero (34 years of data) and 187.4 mm at Derby Main Roads (27 years of data), annual records for both sites. Luana impacted almost the same region as Tropical Cyclone Hayley at the end of December. There were reports of minor damage, road closures and tide levels exceeded the highest tides of the year at Derby causing inundation to the port area.
Between 20 and 31 January, widespread heatwave conditions impacted central and southern parts of the country, as a build-up of a large mass of hot air over the interior became trapped for nearly a week by high pressure systems and dragging hot northerly winds across central and south-eastern Australia. This heatwave was associated with very hot temperatures, as large areas of mainland south-eastern Australia experienced maximum temperatures of 10 to 15 °C above average between the 25th and 31st. Large areas saw extended periods of temperatures of more than 40 °C and many stations had temperatures above 45 °C. 60 sites set or equalled their January or annual daytime temperature records including:
- 49.7 °C at Pooncarie in New South Wales on the 27th, the equal second-highest temperature ever recorded in the state
- 48.9 °C at Walpeup and Hopetoun in Victoria on the 27th, a new state record
- 50.0 °C at Andamooka in South Australia on the 29th and at Port Augusta Aero on 30th, the eighth and ninth instances of 50 °C ever recorded in the standard Bureau surface observations network.
A number of sites set records for consecutive days above temperature thresholds including:
- Maree Aero and Roxby Downs (Olympic Dam Aerodrome) (South Australia) recorded at least 49.0 °C on consecutive days, the 29th and 30th. This has only previously occurred twice in Australia.
- Maree Aero (South Australia) and Smithville AWS (New South Wales) experienced 5 consecutive days of 48.0 °C or above, from the 27th to the 31st, a national record.
- 24 sites across South Australia, western New South Wales and south-western Queensland set their record for consecutive days of 45.0 °C or above.
Overall, in January 2026 daily maximum temperatures of 49.0 °C or above were recorded 19 times. The previous record for a single month was 6 times in January 2019.
The heatwave conditions in January dried the landscape across the south of the country, elevating the risk of bushfires. Several major bushfires started in January and February, including:
- On 22 January thunderstorms ahead of a west coast trough generating dry lightning that ignited fires near Boddington and Wandering in south-west Western Australia.
- Extreme to Catastrophic Fire Danger ratings between 27 and 29 January intensified existing fires in Victoria and ignited new ones. By the end of February, the Victorian SES reported that around 440,000 hectares had been burnt, more than in the Black Saturday 2009 fires, and around 450 homes destroyed.
- On 1 February, strong coastal winds drove a bushfire at Deep Creek on the Fleurieu Peninsula in South Australia, which was not declared contained until the 8th. The South Australia CFS estimated it burnt around 4,500 hectares and threatened local communities.
On 29 January, tropical low 21U developed west of the Gulf of Carpentaria and travelled westwards over the Northern Territory. As it did, the system produced multiple days of widespread rainfall over northern and central regions with heavy falls and localised thunderstorms. Daily rainfall totals exceeded 100 mm in some areas each day, including:
- 107.6 mm at Old Delamere on the 1st
- 183.0 mm at Gilnockie on the 2nd, an annual record (38 years of data)
- 144.2 mm at Cattle Creek on the 3rd, a February record (38 years of data)
- 154.8 mm at Lajamanu Airport on the 4th.
Weekly rainfall totals from 30 January to 5 February between 50 and 300 mm, locally higher, were recorded across the Top End and some central areas. The ongoing heavy rainfall led to widespread flooding. At the Daly River Community the river peaked on the 11th above its Major flood level of 14.2 m, with the community being evacuated. Minor flood warnings were also issued for the Katherine and Waterhouse rivers.
On 4 and 5 February tropical low 21U continued to track across the Kimberley region in Western Australia bringing. Daily rainfall totals greater than 25 mm were widespread across the region, 85.0 mm at Halls Creek Airport to 9 am on the 5th and 60.4 mm at Broome Airport to 9 am on the 6th. On the 6th the system intensified over waters to the north-east of Port Hedland and was named Tropical Cyclone Mitchell. Mitchell moved west south-west parallel to the Pilbara coastline, with rainfall impacting coastal areas between Broome and Port Hedland. The system intensified to Category 3 (Severe) offshore near Dampier on the 7th before beginning to weaken as it turned southwards parallel to the Western Australian coast. Mitchell generated damaging wind gusts along the Pilbara coast for several days, including:
- 169 km/h at Legendre Island on the 7th
- 100 km/h at Karratha Airport on the 7th
- 148 km/h at Barrow Island Airport on the 8th
- 113 km/h at Learmonth Airport on the 9th.
Mitchell weakened below tropical cyclone intensity prior to crossing the coast near Shark Bay around 12:00 am AWST on 10 February, before continuing inland and bringing widespread rain, showers and thunderstorms to large parts of the south-west of Western Australia. Shark Bay Airport recorded 103.6 mm in the 24 hours to 9 am on the 10th. Weekly rainfall totals between 50 and 300 mm, locally higher, were recorded in parts of northern and south-western Western Australia between 5 and 11 February.
Tropical Cyclone Mitchell was the ninth tropical cyclone to form in the Australian region in the 2025-26 season. This was the most active start to the Australian tropical cyclone season since 1996-97.
Between 5 and 13 February, showers and thunderstorms developed over broad areas of central Australia as tropical moisture drawn southwards by a series of inland troughs. Daily rainfall totals greater than 25 mm were across large areas of central Australia across this period. Alice Springs Airport recorded 9 consecutive days with at least 1.0 mm of rainfall from the 5th to the 13th, its equal second-longest run (the record is 13 days in January 1974). The heaviest rainfall occurred around the Alice Springs area early on the 12th, with up to 75 mm to 100 mm recorded in 3 hours at several stations. The heavy rain resulted in the Todd River at Alice Springs reaching its Major Flood level of 3.5 m. With ongoing rain across central Australia, the Todd River continued to flow for several months.
On 11 and 12 February, a cold front crossed south-eastern Australia bringing light to moderate rain and thunderstorms. The southerly winds behind the cold front led to daily maximum and minimum temperatures up to 4 to 8 °C below average across large parts of New South Wales, Victoria and Tasmania. The lowest maximum temperature during this period was 4.5 °C at Mount Baw Baw in Victoria on the 12th, and the lowest minimum temperature was -2.4 °C at Dinner Plain (Mt Hotham Aerodrome) in Victoria on the13th (a February record for the site). A light dusting of snow was observed in elevated areas of Tasmania, including Kunanyi / Mount Wellington and around Miena in the Central Highlands.
Between 12 and 17 February, surface troughs combined with a very moist atmosphere to generate widespread rainfall and localised thunderstorms across most of Queensland. Rain initially developed over northern New South Wales, before moving into southern and inland Queensland, then into the state's north where a deepening low pressure trough helped enhance the rainfall. Intense rainfall was observed each day, including 104.0 mm in 1 hour in Taroom on the 13th and 93.6 mm in 2 hours at Palmerville on the 16th. Surbiton Station recorded a daily rainfall total of 190.0 mm in the 24 hours to 9 am on the 13th, its highest on record (139 years of data). Six-day rainfall totals, for 13-18 February, were 100 to 200 mm over much of the state, and more than 200 mm at some stations in the North Tropical Coast and Tablelands and Herbert and Lower Burdekin districts. The highest 6-day rainfall total (at a Bureau gauge) was 374.0 mm at Mount Jukes. The widespread and persistent heavy rainfall resulted in flash and riverine flooding, with major flooding along the Western and Bulloo Rivers. There were road closures across much of western and central Queensland, isolating some communities.
Between 21 and 27 February, tropical low 26U and associated low pressure trough became near-stationary over eastern Northern Territory, before eventually moving slowly to the south-east. The system transported tropical moisture across central Australia, producing several days of widespread heavy to locally intense rainfall. Several sites set February daily rainfall records including:
- 106.6 mm at The Garden (Northern Territory) to 9 am on the 23rd (73 years of data)
- 196.0 mm at Cluny (Queensland) to 9 am on the 26th, also an annual record (85 years of data)
- 93.2 mm at Birdsville Airport (Queensland) to 9 am on the 26th (26 years of data).
Accumulated rainfall totals from this system were 50 to 200 mm across the region. For February overall, the Lake Eyre Basin (the Drainage Division for Kati Thanda-Lake Eyre) received between 100 to 300 mm of rainfall. The area-average rainfall for the Lake Eyre Basin for February 2026 was 164.4 mm, over 3.5 times the monthly average. It was the third-wettest month on record since 1900, equivalent to January 1984 and February 1976, but well below the record rainfall in January 1974.
Many stations in central Australia had a record number of rain days (more than 0 mm) for February, including:
- Tennant Creek Airport (Northern Territory) with 23 days
- Cloncurry Airport (Queensland) with 21 days
- Mount Isa Aero (Queensland) with 21 days
- Alice Springs Airport (Northern Territory) with 18 days.
Flash and riverine flooding impacted large parts of the Northern Territory, Queensland, northern South Australia and western New South Wales, closing hundreds of roads, damaging critical infrastructure including rail lines, and isolating communities. Flood waters moved slowly down Cooper Creek for several months, bringing water to Kati Thanda-Lake Eyre for the second consecutive year.
Between 22 and 28 February, several cold fronts that moved over south-eastern Australia interacted with the near-stationary inland trough over central Australia. This brought moist, unstable, air over South Australia, Victoria and southern New South Wales generating showers and thunderstorms, some of them severe.
The first cold front crossed on the 22nd, with daily rainfall totals, to 9 am on the 23rd, between 50 and 100 mm, across central and eastern South Australia including the Flinders Ranges, north-eastern Victoria and south-eastern New South Wales. Heavy rainfall around Port Augusta in South Australia resulted in the temporary closure of the East West rail line as sections of track (north-west of Port Augusta) were washed away. A second cold front on the 24th impacted parts of eastern South Australia, western New South Wales and much of Victoria including Greater Melbourne. Daily rainfall totals, to 9 am on the 25th, between 10 and 50 mm were recorded across the region. Severe thunderstorms brought heavy rainfall including 43.9 mm in one hour near Gisborne and 22 mm in 30 minutes at Melbourne Airport (Victoria). Flash flooding was observed across large areas of the northern and eastern suburbs of Greater Melbourne. On the 27th, a low pressure trough over central Australia moved south-east over the Eyre Peninsula in South Australia and into western Victoria. In the 24 hours to 9 am on the 28th several sites along South Australia's west coast had their highest daily rainfall on record, including:
- 121.0 mm at Wirrulla (103 years of data)
- 103.0 mm at Minnipa PIRSA (29 years of data)
- 75.2 mm at Ceduna AMO (87 years of data).
In Victoria, Horsham Airport had a February daily record of 96.4 mm to 9 am on the 28th (30 years of data). This included 35.4 mm in 10 minutes (7.00 pm to 7.10 pm on the 27th), an Annual Exceedance Probability (AEP) of much less than 1%, and likely one of the most intense rain events ever recorded in the state.
Between 1 and 3 March, the low pressure trough that had persisted over central Australia dissipated as it moved slowly eastwards over New South Wales. As it did so, the system continued to bring widespread heavy rain and thunderstorms to large parts of northern and eastern South Australia and, in combination with a cold front, across most of New South Wales and Victoria. Many stations had their record highest daily rainfall total for March, including:
- 149.0 mm at Braemar (South Australia)on the 1st, also an annual record (62 years of data)
- 70.0 mm at Alawoona (South Australia)on the 2nd, also an annual record (105 years of data)
- 110.0 mm at Quambatook South (Victoria) on the 2nd (133 years of data)
- 80.6 mm at Cowra Airport AWS (New South Wales) on the 3rd, also an annual record (22 years of data).
Three-day rainfall totals, from 1 to 3 March, over 25 mm were recorded across Victoria north of the Dividing Range, southern and western New South Wales, northern and western Tasmania and eastern South Australia. Three-day rainfall totals between 100 and 200 mm were recorded in parts of north-central and north-western Victoria, the far west of New South Wales, and in the Flinders Ranges in South Australia. The average March rainfall in these regions is less than 25 mm. The 2-day total for 1-2 March at Mildura Airport of 148.8 mm was the second-highest on record for the site.
Between 7 and 10 March, large parts of Queensland had several days of rainfall due to the remnants of tropical low 29U centred over the north-west of the state, which drew in deep tropical moisture into a trough extending from central and south-eastern regions. Four-day rainfall totals for 7 to 10 March exceeded 200 mm in parts of central, northern and south-eastern Queensland, with the highest totals recorded in the Wide Bay and Burnett district. The heaviest rainfall occurred on the 8th highest falls across parts of the south-east, central and west. Daily rainfall totals, to 9 am on the 9th, exceeded 100 mm, with localised daily totals greater than 150 mm. Some sites had their highest annual daily rainfall on record, including:
- 252.6 mm at Dunollie (76 years of data)
- 181.2 mm at Somerby (102 years of data)
- 166.0 mm at Gue (87 years of data).
The heavy rainfall resulted in flooding and extensive road closures across Queensland, particularly across central and eastern areas.
On 3 March, tropical low 31U formed over the Gulf of Carpentaria as the monsoon trough strengthened across northern Australia, and tracked north-westward. 31U persisted for several days over the Top End of the Northern Territory and along with the monsoon trough brought widespread shows, thunderstorms and heavy rainfall to the region. Daily rainfall totals in areas across the Top End and further inland exceeded 100 mm between the 4th and 7th and with some isolated areas recording totals greater than 200 mm including:
- 243.0 mm at Port Keats Airport (Wadeye Community) on the 6th, a March record (26 years of data)
- 230.2 mm at Edith Falls Ridge on the 7th, a March record (21 years of data).
The heavy rainfall led to flash and riverine flooding along the Daly and Katherine Rivers. On the 7th, the Katherine River at Katherine peaked at 19.2 m, above its Major flood level of 17.50 m and similar to the level reached in April 2006. In the following days, persistent intense showers and thunderstorms across the western Top End, due to a slow-moving tropical low (33U) and a low pressure trough. The Daly River levels rose again, with the gauge at the Daly River Community peaking on the 14th at around 16.4 m, above the previous record of 16.25 m set in 1998. Several communities were evacuated across the Daly and Katherine River catchments, with residents impacted by inundated homes, power outages and school closures.
On 13 March, a coastal low pressure trough moved slowly northwards across north-eastern New South Wales and south-eastern Queensland bringing thunderstorms and heavy rainfall to the region. As the thunderstorms were slow-moving, they brought intense rainfall to some areas. Including:
- 52.0 mm in 30 minutes at Repentance (Coopers Creek) (New South Wales), an Annual Exceedance Probability (AEP) of less than 5%
- 65.0 mm in 30 minutes at Jingle Downs Alert (Queensland), an AEP of around 1%.
Daily rainfall totals, in the 24 hours to 9 am on the 14th, of 50 to 100 mm were recorded across the region, including:
- 90.4 mm at Ballina Airport AWS (New South Wales)
- 54.0 mm at Murwillumbah (Bray Park) (New South Wales)
- 97.4 mm at Greenbank (Defence) (Queensland)
- 95.0 mm at Jingle Downs Alert (Queensland).
The heavy rainfall resulted in flash flooding, with reported inundation of streets and properties.
Between 15 and 17 March, a surface trough combined with tropical moisture brought several days widespread rainfall across central Australia. The heaviest falls occurred across the southern Northern Territory, central and north-eastern South Australia and north-western New South Wales. Alice Springs Airport recorded 71.8 mm in the 24 hours to 9 am on the 17th, its highest daily rainfall total since January 2023. Many stations in the region had their record highest daily rainfall totals for March including:
- 89.0 mm at Pine Hill (Northern Territory) to 9 am on the 17th (45 years of data)
- 119.4 mm at Marree Aero (South Australia) to 9 am on the 17th, also an annual record (28 years of data)
- 99.5 mm at Tibooburra (Fort Grey) (New South Wales) to 9 am on the 18th (88 years of data).
Three-day rainfall totals, for 16-18 March, were between 50 and 200 mm for much of the region, compared to the average March monthly rainfall of 5 to 25 mm. Yulara Airport (Northern Territory) had a two-day rainfall total, to 9 am on the 17th, of 149.8 mm, its highest in March since 1988.
The rain fell on areas already impacted by heavy rain in February and at the start of March. The Bureau issued Flood Watches for large parts of Queensland, including Major Flood Warnings for the Stuart and Boyne Rivers. The flash and riverine flooding prolonged the closure of many roads and isolation of communities.
On 15 March, tropical low 34U formed in the Coral Sea south of the Solomon Islands and travelled westwards into the Australian region. The system reached tropical cyclone strength on the 17th the system was named Tropical Cyclone Narelle. Narelle rapidly strengthened reaching Category 5 intensity by the morning of the 19th. Narelle crossed the Cape York Peninsula coast around 7am AEST on 20 March as a high-end Category 4 system, about 60 km north-east of Coen. As Narelle crossed the Peninsula it weakened to Category 2 intensity. The maximum observed wind gusts were 115 km/h at Lockhart River Airport and 109 km/h at Weipa Airport. However, the core of the system passed between Coen and Lockhart River and damage to those communities was relatively minor. Two-day rainfall totals, to 9 am on the 21st, exceeded 200 mm across the region, including:
- 345.8 mm at Scherger RAAF
- 293.2 mm at Weipa Aero
- 280.3 mm at Moreton Telegraph Station, its highest March 2-day rainfall total on record (107 years of data).
Late on 20 March, Tropical Cyclone Narelle emerged into the Gulf of Carpentaria near Aurukun, south of Weipa, at Category 2 intensity. Narelle redeveloped to a severe tropical cyclone (Category 3) as it tracked westwards across the Gulf. Narelle crossed the eastern Northern Territory coast around 3.30am ACST on the 22nd as a Category 3 system in a sparsely populated area about 70km north-west of Groote Eylandt. The strongest observed wind gusts were 91 km/h at Ngayawili and 83 km/h at Groote Eylandt Airport. Reports of wind damage were mostly related to downed trees, branches and power outages. Narelle weakened to a tropical low as it tracked across the Top End. However, it brought significant rain to regions impacted by earlier events, most notably the Daly River. Two-day rainfall totals, to 9 am on the 23rd, exceeded 50 mm across much of the Top End, including:
- 206.0 mm at Adelaide River Post Office
- 204.0 mm at Central Arnhem Plateau
- 128.0 mm at Cooinda Airstrip.
On 23 March ex-tropical cyclone Narelle continued to track across the Joseph Bonaparte Gulf and moved over the north-eastern Kimberley coast in Western Australia. This brought over 100 mm of rain to the region, with daily rainfall to 9 am on the 24th of 166.0 mm at Truscott at 146.2 mm at Kalumburu. The system moved offshore on the 24th and redeveloped to a tropical cyclone north-west of Broome early on the 25th. Narelle intensified to a Category 3 (Severe) system later on the 25th as it tracked parallel to the Pilbara coast. The large circulation brought gale- to storm-force winds to coastal areas before it turned south near the Dampier Peninsula early on the 27th. The strongest observed wind gusts included:
- 200 km/h at Learmonth Airport on the 27th, second-highest on record
- 185 km/h at Varanus Island on the 26th, an annual record
- 170 km/h at Barrow Island Airport on the 26th, an annual record
- 150 km/h at Onslow Airport on the 27th.
Narelle crossed the Western Australia coast around 2.00pm AWST on the 27th as a Category 3 system near Coral Bay and passed to the east of Carnarvon while weakening. Narelle brought very heavy rain to coastal areas of the Pilbara and Gascoyne regions, with 2-day totals, to 9 am on the 28th, exceeding 200 mm in some areas. Notable daily rainfall totals included:
- 208.0 mm at Barrow Island to 9 am on the 27th, March record (28 years of data)
- 231.4 mm at Learmonth Airport to 9 am on the 27th, second-highest for March (82 years of data)
- 328.0 mm at Winning to 9 am on the 28th, annual record (129 years of data)
- 208.0 mm at Williamburry to 9 am on the 28th, second-highest for March (139 years of data)
Exmouth, on the North West Cape, suffered widespread, substantial damage as Narelle passed about 35 km to the west on the 27th. The stretch of coast to the east of Exmouth experienced a large storm surge, measuring up to 3m, inundating coastal areas. Pastoral stations in the west Pilbara and Gascoyne experienced significant flooding, building and infrastructure damage, and livestock losses. As ex-Tropical Cyclone Narelle moved south south-eastwards over southern Western Australia it continued to bring heavy rain and damaging winds along its path, with daily rainfall totals up to 25 mm in inland areas of the Gascoyne and Central Wheat Belt districts.
Severe Tropical Cyclone Narelle was only the third system to make landfall in all of Queensland, the Northern Territory and Western Australia at tropical cyclone intensity, since reliable records began in 1980. It is also only the second system to have made landfall three times at Severe intensity (Category 3 or higher). Although it is not the longest-lived system on record within the Australian region, its relatively long lifespan and strong intensity means that March 2026 saw the longest continuous period on record where the Bureau issued Tropical Cyclone Advice.
On 27 March, moist tropical air from ex-Tropical Cyclone Narelle moved over the south-west of Western Australia, bringing widespread rainfall and thunderstorms. Daily rainfall totals, to 9 am on the 28th, between 25 and 100 mm were recorded across the region. The heaviest rainfall occurred around Perth, with a number of sites reporting their highest March daily rainfall on record, including:
- 62.8 mm at Perth Metro (34 years of data at the current site)
- 47.8 mm at Perth Airport (82 years of data)
- 91.4 mm at Dwellingup (93 years of data)
- 102.8 mm at Mandurah (120 years of composite data).
On 26 March, a cold front and low pressure trough crossed south-eastern Australia followed by a strong southerly airflow with gusty winds. A number of stations in Victoria and New South Wales observed wind gusts of more than 80 km/h on the 26th, including:
- 100 km/h at Grampians (Mount William) (Victoria)
- 115 km/h at Dubbo Airport AWS (New South Wales).
On the 27th, a deep low pressure system developed off the New South Wales coast. The cold air resulted in maximum and minimum temperatures between 4 and 12 °C below average for much of the south-eastern mainland and central Australia from the 26th to the 30th. Many stations across New South Wales observed record low March daily maximum temperatures on the 27th, including:
- 13.3 °C at Coonabarabran (Showgrounds) (68 years of data)
- 9.0 °C at Katoomba (Farnells Rd) (63 years of data)
- 9.7 °C at Cooma Airport AWS (36 years of data)
- 15.1 °C at Wellington (61 years of data).
As the cold air pushed northwards on the 28th and 29th, many stations in northern New South Wales, south-eastern and western Queensland and in the Northern Territory observed record low March daily minimum temperatures, including:
- 10.3 °C at Murwillumbah (New South Wales) on the 28th (53 years of data)
- 6.2 °C at Amberley AMO (Queensland) on the 28th (85 years of data)
- 12.4 °C at Mount Isa Aero (Queensland) on the 29th (60 years of data)
- 9.6 °C at Camooweal Township (Queensland) on the 29th (84 years of data)
- 14.1 °C at Tennant Creek Airport (Northern Territory) on the 29th (57 years of data).
The system brought daily rainfall totals of 25 to 50 mm on the 27th and 28th to eastern Victoria and south-eastern New South Wales, but only light rainfall was recorded elsewhere. The first snow of the year was reported in alpine areas of Victoria and New South Wales, with 10 to 20 cm of snow observed, and dustings of snow were reported in the New South Wales Central Tablelands.
As the deep low pressure system sat off the New South Wales coast it generated significant waves, up to 5.7 m in height, along the Illawarra and Sydney coasts. There were reports of coastal erosion and beachside property damage.
Between 2 and 5 April, low pressure troughs moved across central and southern Western Australia triggering showers, some severe thunderstorms with heavy rainfall, hail and strong winds. Several stations observed daily rainfall totals of more than 40.0 mm, including 47.6 mm at Edjudina in the 24 hours to 9 am on the 4th, its fourth-highest April daily rainfall total April (126 years of data). Three-day rainfall totals to 9 am on the 5th between 15 and 50 mm, and locally up to 100 mm, were recorded in parts of the Goldfields and South East Coastal districts.
On 1 April tropical low 37U in the Solomon Sea south of Honiara and tracked north-westwards while slowly intensifying. The system reached tropical cyclone intensity on the 4th and was named Tropical Cyclone Maila by the Papua New Guinea National Weather Service, the first time a tropical cyclone has formed in the Papua New Guinea region since November 2007. Maila intensified rapidly, reaching Category 3 (Severe) on the 5th and Category 5 on the 6th when entering the Australian region. Maila began to weaken from the 9th and fell to below tropical cyclone intensity by the 11th. As ex-Tropical Cyclone Maila crossed over Papua New Guinea strong winds, heavy rainfall and high waves caused significant damage to infrastructure, disrupted supply chains, and led to landslides, including in Milne Bay Province and Bougainville.
Ex-Tropical Cyclone Maila tracked westwards through the Coral Sea as a weak tropical low. Its remnants, combined with a surface low pressure trough, crossed far north Queensland early on the 15th. As it continued westwards, the system brought showers, rain and thunderstorms to northern and central Queensland and northern parts of the Northern Territory. Some stations observed their record highest daily rainfall for April, including 171.6 mm at Groote Eylandt Airport (Northern Territory) in the 24 hours to 9 am on the 17th.
Maila was the 11th, and final, tropical cyclone in the Australian Region in the 2025-26 season and the 7th to reach Severe intensity within the Region. Maila is likely to have been the strongest tropical cyclone on record in the Solomon Sea.
Between 8 and 11 April a high pressure system in the Tasman Sea directed hot and dry north-westerly winds ahead of a cold front and trough across eastern Australia. Daytime temperatures were 8 to 12 °C above average across inland parts of the country and most of New South Wales and Queensland. Many sites in south-east Queensland and north-east New South Wales observed April daily maximum temperature records including:
- 32.5 °C at Inverell (New South Wales) on the 8th (32 years of data)
- 39.0 °C at Brewarrina Hospital (New South Wales) on the 10th (116 years of data)
- 37.6 °C at Cunnamulla Post Office (Queensland) on the 10th (68 years of data)
- 36.3 °C at Injune Post Office (Queensland) on the 11th (59 years of data).
Nights were also warmer than average, particularly in eastern New South Wales on the 10th and the 11th. Some stations had their record highest daily minimum temperature for April, including:
- 22.0 °C at Narooma on the 10th (39 years of data)
- 17.7°C at Nullo Mountain AWS on the 10th (36 years of data)
- 21.8 °C at Gunnedah Resource Centre on the 11th (76 years of data).
Between 9 and 11 April, a series of cold fronts and troughs moved across south-eastern Australia bringing strong winds, below average temperatures and widespread rainfall. A cold air mass behind these fronts brought cooler than average temperatures to the south-east. Daytime temperatures on the 11th and 12th were up to 4 °C below average and for much of Tasmania and alpine areas of north-eastern Victoria extending into south-eastern New South Wales were up to 6 °C below average. Notable low maximum temperatures included:
- 11.5 °C at Hobart (Ellerslie Road), its coldest April day since 2021
- -0.1 °C at Kunanyi / Mount Wellington, its coldest April day since 2012
- -0.6 °C at Mount Hotham (Victoria), its coldest April day since 2021.
Snow settled on mountain peaks across the south-east, including at Mount Mawson and Kunanyi / Mount Wellington in Tasmania as well as at the Victorian and New South Wales Alps. The cold fronts also brought several days of strong winds to exposed parts of Victoria, Tasmania and southern New South Wales. Wind gusts over 80 km/h at were recorded at many stations, with the strongest observed wind gust of 135 km/h at Hogan Island (Bass Strait) on the 11th.
Between 18 and 20 April, following a cold front a low-moving high pressure system directed persistent cold southerly airflow across the south-east of the country. Cloudless skies and light winds under the high pressure system resulted in daily minimum temperatures up to 10 °C below average across south-eastern South Australia, Victoria, Tasmania, New South Wales and southern Queensland, with minimum temperatures below 0 °C across large areas. Some stations had their record low minimum temperatures for April, or early season record on the 19th, including:
- -0.5 °C at Yarrawonga (Victoria), an April record (33 years of data)
- 0.0 °C at Grenell (Manganese Rd) (New South Wales), an April record (59 years of data).
On 20 and 21 April a strong cold front crossed southern Western Australia, bringing strong winds, showers, isolated thunderstorms and below average temperatures. Daily rainfall totals to 9 am on the 21st of 5 to 15 mm were recorded across the south-west, with up to 40 mm in parts of the far south-west coast. Behind the cold front, daily maximum and minimum temperatures were 4 °C to 8 °C below the April average. Damaging wind gusts were observed across the south-west of the state from the evening of the 20th to the morning of the 21st with gusts exceeding 60 km/h along coastal and inland areas. The strongest wind gusts occurred in the early hours of the 21st with:
- 124 km/h at Busselton Jetty, an annual record (23 years of data)
- 115 km/h at Cape Leeuwin, an April record (33 years of data)
Large waves and swell impacted the south-west coastline, with waves up to 5 m. There were reports of structural damage to properties around Bunbury.
Between 18 April and 2 May, slow moving high pressure systems brought warmer than average conditions across large parts of south-eastern Australia. Daytime temperatures were generally 4 to 8 °C above average for southern and south-eastern South Australia, Victoria, Tasmania and southern New South Wales as northerly winds were directed from central Australia towards the south. On the 1st and 2nd, maximum temperatures were 8 to 12 °C above average across large parts of the south-east. Tasmania and Victoria had their hottest May days on record on the 1st, averaging 21.6 °C and 26.7 °C respectively and exceeding their previous records by around 1 °C. A large number of sites had their highest May maximum temperature on record, including:
- 27.5 °C at Hobart Airport on the 1st (79 years of composite data), second-highest temperature ever recorded in Tasmania in May
- 26.9 °C at Hobart (Ellerslie Road) on the 1st (temperature records began in 1882)
- 29.3 °C at Avalon Airport on the 1st (32 years of data), equal highest May temperature in Victoria since 1985.
Minimum temperatures between the 1st and 3rd were 4 to 10 °C above average for large parts of the south-east. Many sites had their highest May minimum temperature on record including:
- 19.2 °C at Maatsuyker Island Lighthouse on the 2nd (70 years of data), new May minimum temperature record for Tasmania 17.9 °C at King Island Airport on the 2nd (69 years of composite data) 20.4 °C at Cape Otway Lighthouse on the 2nd (162 years of data), also the second-highest minimum temperature ever recorded in Victoria in May 19.1 °C at Melbourne (Olympic Park) on the 3rd (composite records begin in 1859).
Between 3 and 6 May, cold fronts moved over south-eastern Australia generating cooler than average temperatures, strong winds and light to moderate rainfall. For the week of 4-10 May, rainfall totals between 10 and 50 mm were recorded across Tasmania and southern, central and eastern parts of Victoria, with falls greater than 50 mm in western Tasmania and in central Victoria. On the 6th cold south-westerly airflow behind the second cold front brought snow to alpine regions in Tasmania, Victoria and New South Wales and up to 5 cm was observed in Perisher Valley in New South Wales and light snow was reported in Marysville in Victoria.
Between 11 and 16 May, an intense high pressure system moved across the Great Australian Bight and into the Tasman Sea. On the 12th, mean sea level pressure (MSLP) over the south-east approached 1040 hPa over Tasmania, with some sites setting monthly records.
Between 15 and 19 May, an upper level trough combined with moist easterly flow to produce a north-west cloud band that stretched from the north-west coast of Western Australia across the Northern Territory and into western areas of Queensland and New South Wales. On the 17th and 18th Unseasonable daily rainfall totals of 25 to 50 mm were recorded in the south of the Northern Territory and in western Queensland.
The cloudband extended southwards from the 16th to the 19th, as the system interacted with an approaching cold front, bringing widespread rain to affected areas. Daily Rainfall totals over 25 mm were recorded across large parts of New South Wales, western and south-eastern Queensland, south-eastern parts of South Australia, north-western and central areas of Victoria and western Tasmania. Several sites had their highest May daily rainfall on record, including:
- 35.0 mm at North Shields (Port Lincoln Aerodrome) (South Australia) on the 16th (77 years of data)
- 39.2 mm at Walpeup Research (Victoria) on the 17th (87 years of data)
- 66.8 mm at Weabonga (Stoneleigh) (New South Wales) on the 19th (99 years of data).
Between 18 and 19 May, moist easterly flow from a coastal trough off the south-eastern Queensland coast combined with an upper level trough and generated rainfall along the northern New South Wales and south-eastern Queensland coasts. The heaviest rainfall occurred around the New South Wales and Queensland border on the evening of the 18th, including a daily rainfall total, to 9 am on the 19th, of 177.0 mm at Springbrook Road(Queensland). 2-day rainfall totals, to 9 am on the 19th, in the region were greater than 50 mm, with locally higher totals of 150 to 200 mm. The heavy rainfall led to minor to moderate flooding along the Pimpama, Nerang and Coomera rivers in south-eastern Queensland and the Wilson River at Lismore in New South Wales.
Between 23 and 25 May, a high pressure system centred over southern Western Australia produced clear skies and light winds leading to minimum temperatures 6 to 10 °C below average on the 23rd and 24th. Night-time temperatures dropped below 0 °C across inland areas of the south-west, reaching -3.2 °C at Wandering on the 24th, the stations second-lowest May minimum temperature on record (28 years of data). Perth Metro recorded a minimum of 2.5 °C on the 24th, the fifth-coldest May night at the current site (opened 1994) and the coldest May temperature since 2019.
Between 25 and 30 May, a complex series of low pressure troughs interacted with moist tropical air over large parts of south-eastern Australia. 6-day rainfall totals, for 25-30 May, between 10 to 50 mm were recorded across Tasmania, eastern and inland New South Wales, southern and central parts of Queensland, western and southern parts of Victoria and across eastern parts of South Australia. Locally higher totals of 50 to 100 mm occurred in north-eastern New South Wales and parts of southern Queensland and eastern Tasmania. Several sites had their highest May daily rainfall on record, including:
- 59.4 mm at Dubbo Airport AWS to 9 am on the 26th (32 years of data)
- 63.0 mm at Moree Aero to 9 am on the 28th (32 years of data)
- 85.6 mm at Pallamallawa Post Office to 9 am on the 28th (114 years of data).
The heavy rainfall led to Minor flooding in several catchments along the New South Wales Mid North Coast, including the Hastings, Myall, Manning and Gloucester rivers.
On 30 and 31 May a strong cold front associated with a deep low pressure system, crossed south-west Western Australia. This system was associated with light to moderate rainfall, thunderstorms and damaging to destructive winds. Daily rainfall totals, to 9 am on the 31st, of 10 to 50 mm were recorded across the south-west from Geraldton to Albany. On the 31st wind gusts over 80 km/h were recorded at many sites across the south-west, with the strongest gusts at exposed coastal locations, including:
- 135 km/h at Cape Naturaliste, a May record (25 years of data)
- 133 km/h at Cape Leeuwin
- 120 km/h at Busselton Jetty, a May record (23 years of data)
- 106 km/h at Garden Island HSF, a May record (24 years of data).
The system generated very rough seas, and a storm surge at high tide caused coastal flooding in some areas.
Between 1 and 5 June, southern coastal regions of Australia were impacted by two strong cold fronts, along with their associated surface troughs and low pressure systems. These systems brought strong winds and rough seas to coastal regions, and widespread moderate to heavy rainfall. Daily rainfall totals between the 1st and 3rd were greater than 25 mm across northern Tasmania, parts of southern-eastern South Australia and central and north-eastern Victoria. On the 3rd and 4th, a surface trough on the back edge of the low pressure system strengthened over Bass Strait. Daily rainfall totals to 9 am on the 4th, of 25 to 50 mm were recorded across south-western Victoria and southern Tasmania, with locally higher totals. Daily rainfall totals to 9 am on the 5th of 15 to 50 mm were recorded in central, south-western and eastern Victoria. The highest daily total was 84.2 mm at Wilson Promontory Lighthouse on the 4th, its highest June daily rainfall on record (153 years of data). Melbourne (Olympic Park) recorded 18.6 mm on the 5th, its highest June daily rainfall since 2018. The rainfall led to Minor flooding along the Mersey, St Pauls and South Esk Rivers in Tasmania and Kiewa River in Victoria.
The systems generated strong to damaging wind gusts, over 80 km/h, across coastal and alpine areas of the south-east for several days. The strongest wind gusts included:
- 133 km/h at Thredbo AWS (NSW) on the 2nd
- 119 km/h at Hogan Island (Tas) on the 3rd
- 115 km/h at Maatsuyker Island (Tas) on the 5th
- 115 km/h at Kunanyi / Mount Wellington on the 5th.
The systems also caused abnormally high tides and inundation of low lying coastal areas along the South Australian and Victorian coasts, including Port Phillip Bay in Melbourne.
Between 10 and 12 June, an inland trough moved east across inland and southern Queensland and northern New South Wales. This brought rainfall to large parts of western and southern Queensland and northern New South Wales with daily rainfall totals in the 24 hours to 9 am on the 11th greater than 10 mm, and locally over 25 mm. The average June rainfall for the region is 25 to 50 mm. As the system moved towards the coast, it brought daily rainfall totals, to 9 am on the 12th, of 15 to 25 mm, locally higher, to south-eastern Queensland and north-eastern New South Wales. The highest daily rainfall was 55.0 mm on the 12th at Pratten in south-eastern Queensland, its highest June daily total since 1979.
Between 11 and 14 June, a north-west cloud band brought widespread rainfall from north-west Western Australia extending towards south-eastern Australia as the system interacted with a cold front. In the 24 hours to 9 am on the 12th, falls of 15–50 mm were recorded from Port Hedland to Esperance, with few sites recording their highest June daily rainfall on record, including 30.0 mm at Southern Cross Airfield (31 years of data).As the system moved towards the south-east, rainfall of 15–25 extended across south-east Western Australia into the Eyre Peninsula in South Australia in the 24 hours to 9 am on the 13th, with 31.0 mm at Ceduna AMO (88 years of data), its third-highest June daily rainfall on record.
From 6 to 18 June, large parts of eastern Australia experienced warmer than average temperatures up to 6 °C above average, from slow moving high pressure systems located over southern Australia. Several sites had their highest June maximum temperature on record, including:
- 18.3 °C at Cape Sorell (Tasmania) on the 12th (29 years of data)
- 18.7 °C at Cape Bruny in Tasmania on the 12th (30 years of data)
- 23.4 °C at Lakes Entrance (Eastern Beach Road) (Victoria) on the 16th (21 years of data)
- 20.3 °C at Flinders Island Airport (Tasmania) on the 18th (30 years of data).
Sydney (Observatory Hill) observed a June record 15 consecutive days of maximum temperatures of at least 20.0 °C from the 7th to the 21st (composite records start in 1859) and Hobart (Ellerslie Road) had 9 consecutive days of at least 15.0 °C from the 6th to 14th (records start in 1882).
Many sites across the south-east had their highest June minimum temperature on record, including:
- 14.2 °C at Wagga Wagga AMO (New South Wales) on the 11th (85 years of data)
- 14.7 °C at Penrith Lakes AWS (New South Wales) on the 12th (31 years of data)
- 14.4 °C at Mount Gambier Aero (South Australia) on the 17th (85 years of data)
- 16.2 °C at Melbourne (Olympic Park) (Victoria) on the 18th (composite records start in 1855).
On 18 and 19 June, cloud cover from a cloud band brought cooler than average conditions to northern and western Queensland, with maximum temperatures 8 to 10° C below average on the 19th. Some sites had their coldest daytime temperature since July 2023, including 14.2 °C at Mount Isa Aero. The cloud band also brought unseasonable rainfall to parts of the Northern Territory Top End and western Queensland, as average June rainfall for the western Top End is less than 1 mm. Daily rainfall totals between 15 and 25 mm were recorded in the regions in the 24 hours to 9 am on the 19th or 20th, with the highest falls including:
- 13.4 mm at McCluer Island on the 18th
- 19.4 mm at Noonamah Airstrip on the 19th
- 14.0 mm at Humpty Doo Collard Road on the 20th, a June daily rainfall record (43 years of data).
On 26 and 27 June, a cold front and associated low pressure system moved across Western Australia towards the south-east. This system was associated with several days of rainfall with localised thunderstorms in the south-west and strong to damaging winds. Daily rainfall totals in the 24 hours to 9 am on the 27th were greater than 15 mm across the south-west with totals greater than 25 mm in some areas. In the 24 hours to 9 am on the 28th totals of 15 to 25 mm were recorded across large parts of the south-west. Maximum wind gusts on the 26th and 27th across south-west coastal regions were greater than 60 km/h, with the strongest gust of 109 km/h recorded at Cape Leeuwin on the 27th. This system was also associated with hazardous surf conditions from Albany to Shark Bay, with sea levels at Hillarys Boat Harbour, in northern Perth, around 40cm above the Highest Astronomical Tide.
On 28 and 29 June, the low pressure system that impacted south-west Western Australia, travelled eastwards and combined with moist tropical air generating rainfall across central and eastern parts of the country. Daily rainfall totals in the 24 hours to 9 am on the 29th, were 10 to 50 mm. For the 24 hours to 9 am on the 30th, daily rainfall totals of 10 to 50 mm extended from south-western Queensland through western New South Wales and into northern and central Victoria and northern Tasmania. Several sites in Victoria had their highest June daily rainfall on record including:
- 49.2 mm at Bendigo Airport, highest June daily rainfall since 1898 in the city's composite record
- 22.0 mm at Hopetoun Airport (23 years of data).
Flood Warnings or Watches were issued for several catchments in Victoria and Tasmania.
Where to find more information
The Financial year climate and water statement provides a range of climate and water information at a national level.
Climate summaries are produced for each month and season, for Australia nationally and for the states and most capital cities. Special Climate Statements are produced on an occasional basis, and provide a detailed summary of weather/climate events which are unusual in the context of the climatology of the affected region.
The National Water Account includes detailed water information for eleven nationally significant water management regions. The Groundwater Information Suite provides data on bore water levels and trends, and associated data on hydrogeology and groundwater management.
Data information
For more information, find area average data and timeseries for the financial year period, with maps for the 12-month periods ending June available from recent conditions.
Data currency
All values in this statement were compiled from data available on the issue date. Subsequent quality control and the availability of additional data may result in minor changes to final values. The use of current and historical climate information allows for comparison of climate impacts from one year to the next and aligns with other reporting processes that occur over financial year periods.
Data sources
The Bureau collects, manages and safeguards Australia's climate data archive. Several datasets have been developed from this archive to identify, monitor and attribute changes in the Australian climate.
This statement was prepared using the following sources:
- Rainfall from the Australian Gridded Climate Dataset (AGCD) analyses.
- Temperature from Australia Water Availability Project (AWAP) analyses.
- Area-average time series for the financial year are calculated from the homogenised Australian temperature dataset (ACORN-SAT) and AGCD monthly rainfall.
- Root-zone soil moisture from Australian Water Resources Assessment Landscape model (AWRA-L) 7.0 analyses.
- Water storage information and the Murray-Darling Basin Information Portal.
- Sea surface temperature from the ERSSTv5 dataset.
A note on base periods
In climatology a baseline, or long-term average, is required against which to compare changes in climate over time. The Bureau uses the 1961–1990 period as the climate reference period for the Annual Climate Statement and other climate monitoring products.
A minimum 30 years of data is required to form a robust climatological average, accounting for decadal variability. In general, baseline climatological periods try to make use of the period with the best data coverage. The 1961–1990 period is comparable to the first 30-year period where there is good global coverage of climate data, and is thus used as a benchmark for reporting climate change allowing consistent comparison of national temperature observations across countries. However alternate averaging periods are also used for other purposes, such as facilitating comparison to a more recent period for climate outlooks, or to the pre-industrial period for long-term climate change.
The choice of base period is a convention. It has no bearing on the calculation of trends over time, or the ranking of one year compared to all other years in a dataset.
Product code: IDCKGC6AR0
Downloads
- Interactive timeseries graphs as .png files
- Data sources are listed in sections including the About section