


This brochure describes the flood risk and previous flooding in the Bulloo River catchment, last
updated in October 2025.
Flood Risk
The Bulloo River catchment is located in southwest Queensland and covers an area of approximately 55,000 square kilometres. The river rises in the Gowan Range, 125 kilometres north of Adavale and is joined by its main northern tributary, Blackwater Creek, 20 kilometres below Adavale. Flowing in a southerly direction, the river passes through the catchment's only towns of Quilpie and Thargomindah, before entering sandy country on the Queensland-New South Wales border. Floods normally develop in the headwaters of the Bulloo River and Blackwater Creek. However, flooding can develop from heavy rainfall falling in the middle to lower reaches of the catchment downstream of Quilpie.
Major flooding requires a large-scale rainfall event over the Bulloo River catchment. The following can be used as a rough guide to the likelihood of flooding in the catchment:
- 75 mm in 24 hours over isolated areas, with lesser rains of 50 mm over more extensive areas will cause stream rises and the possibility of minor flooding. If lesser rainfalls have been recorded in the previous 24 to 72 hours, then moderate to major flooding may develop.
- 100 mm in 24 hours will cause isolated flooding in the immediate area of the heavy rain.
- Generally, 100 mm or heavier falls in 24 hours over a wide area will most likely cause major flooding. In the lower reaches, these falls may cause relatively fast initial rises at Autumnvale and Thargomindah before upstream rises occur.
Previous Flooding
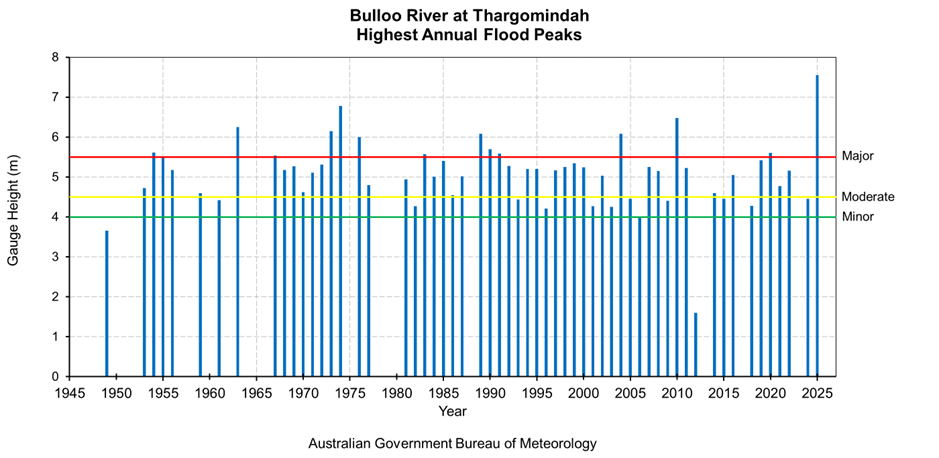
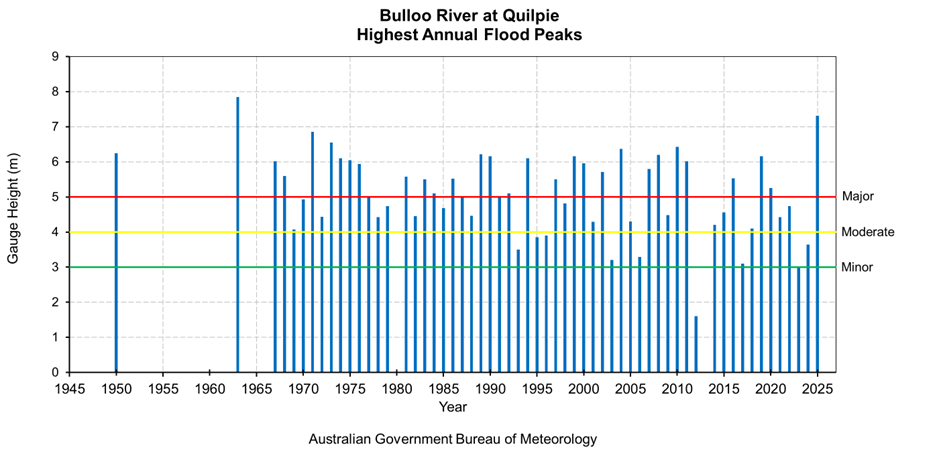
The Bulloo River at Quilpie has well documented history of flooding dating back to 1950 with Thargomindah having records dating back to 1949. The flood of May 1989, 2010, and to a lesser extent the flood of April 1990, caused inundation of many properties in both the Quilpie and Thargomindah districts.
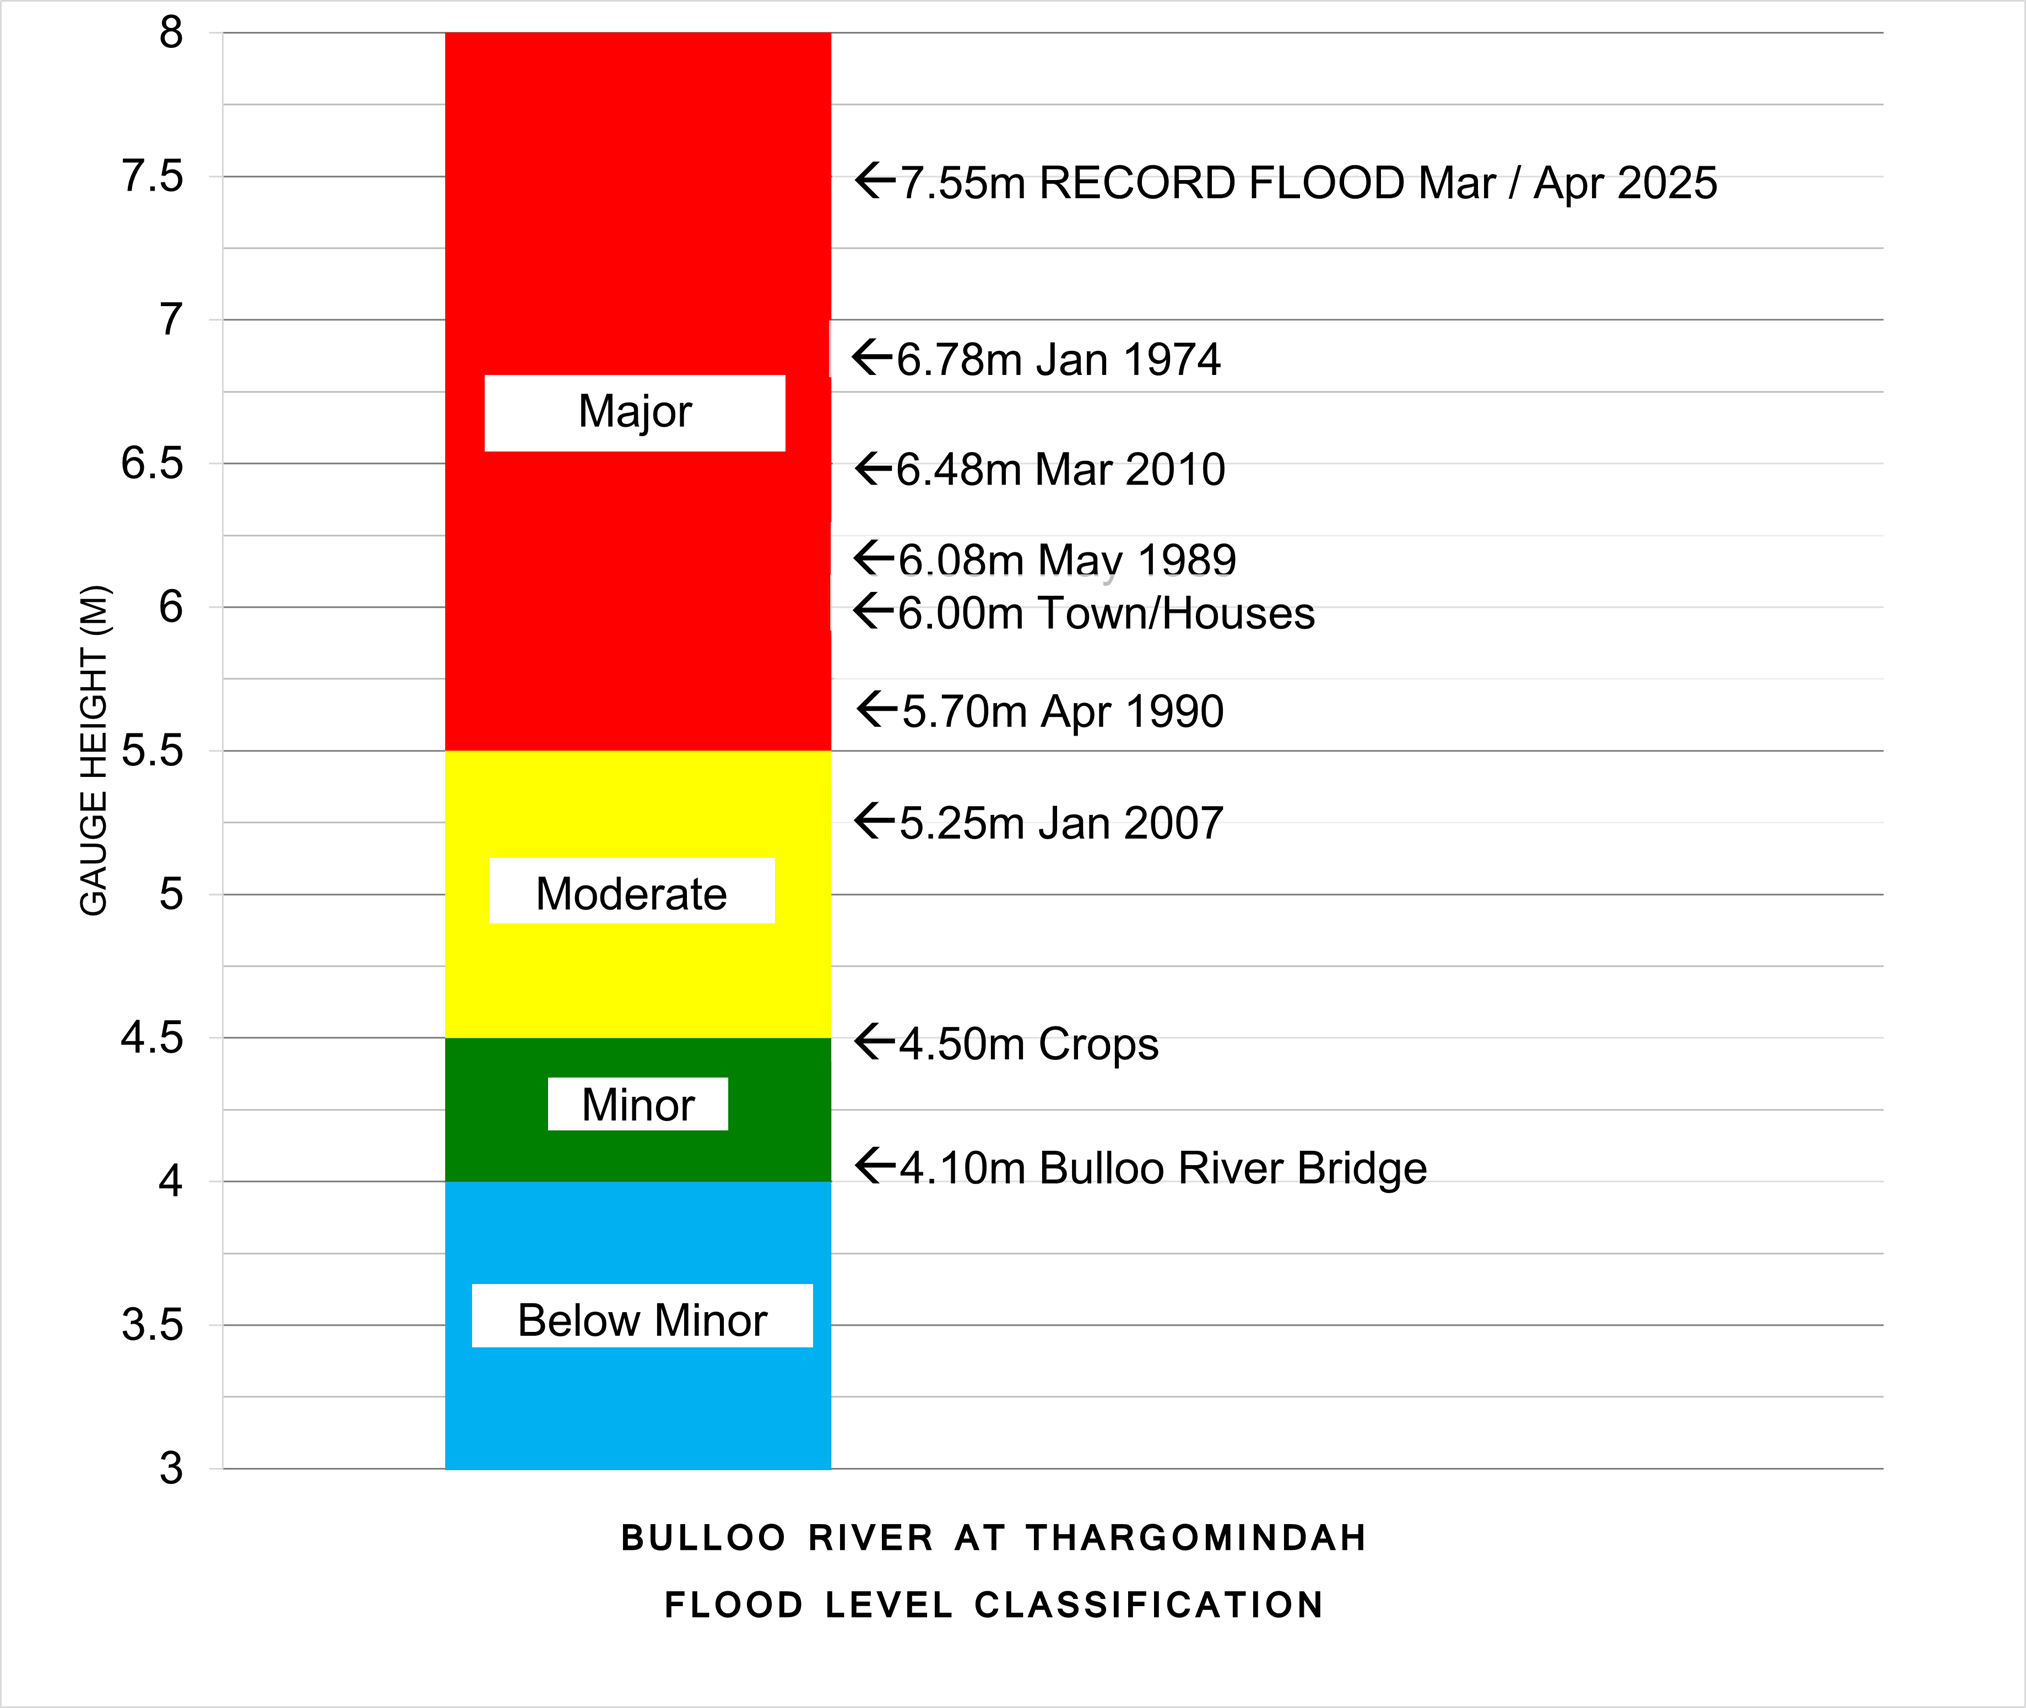
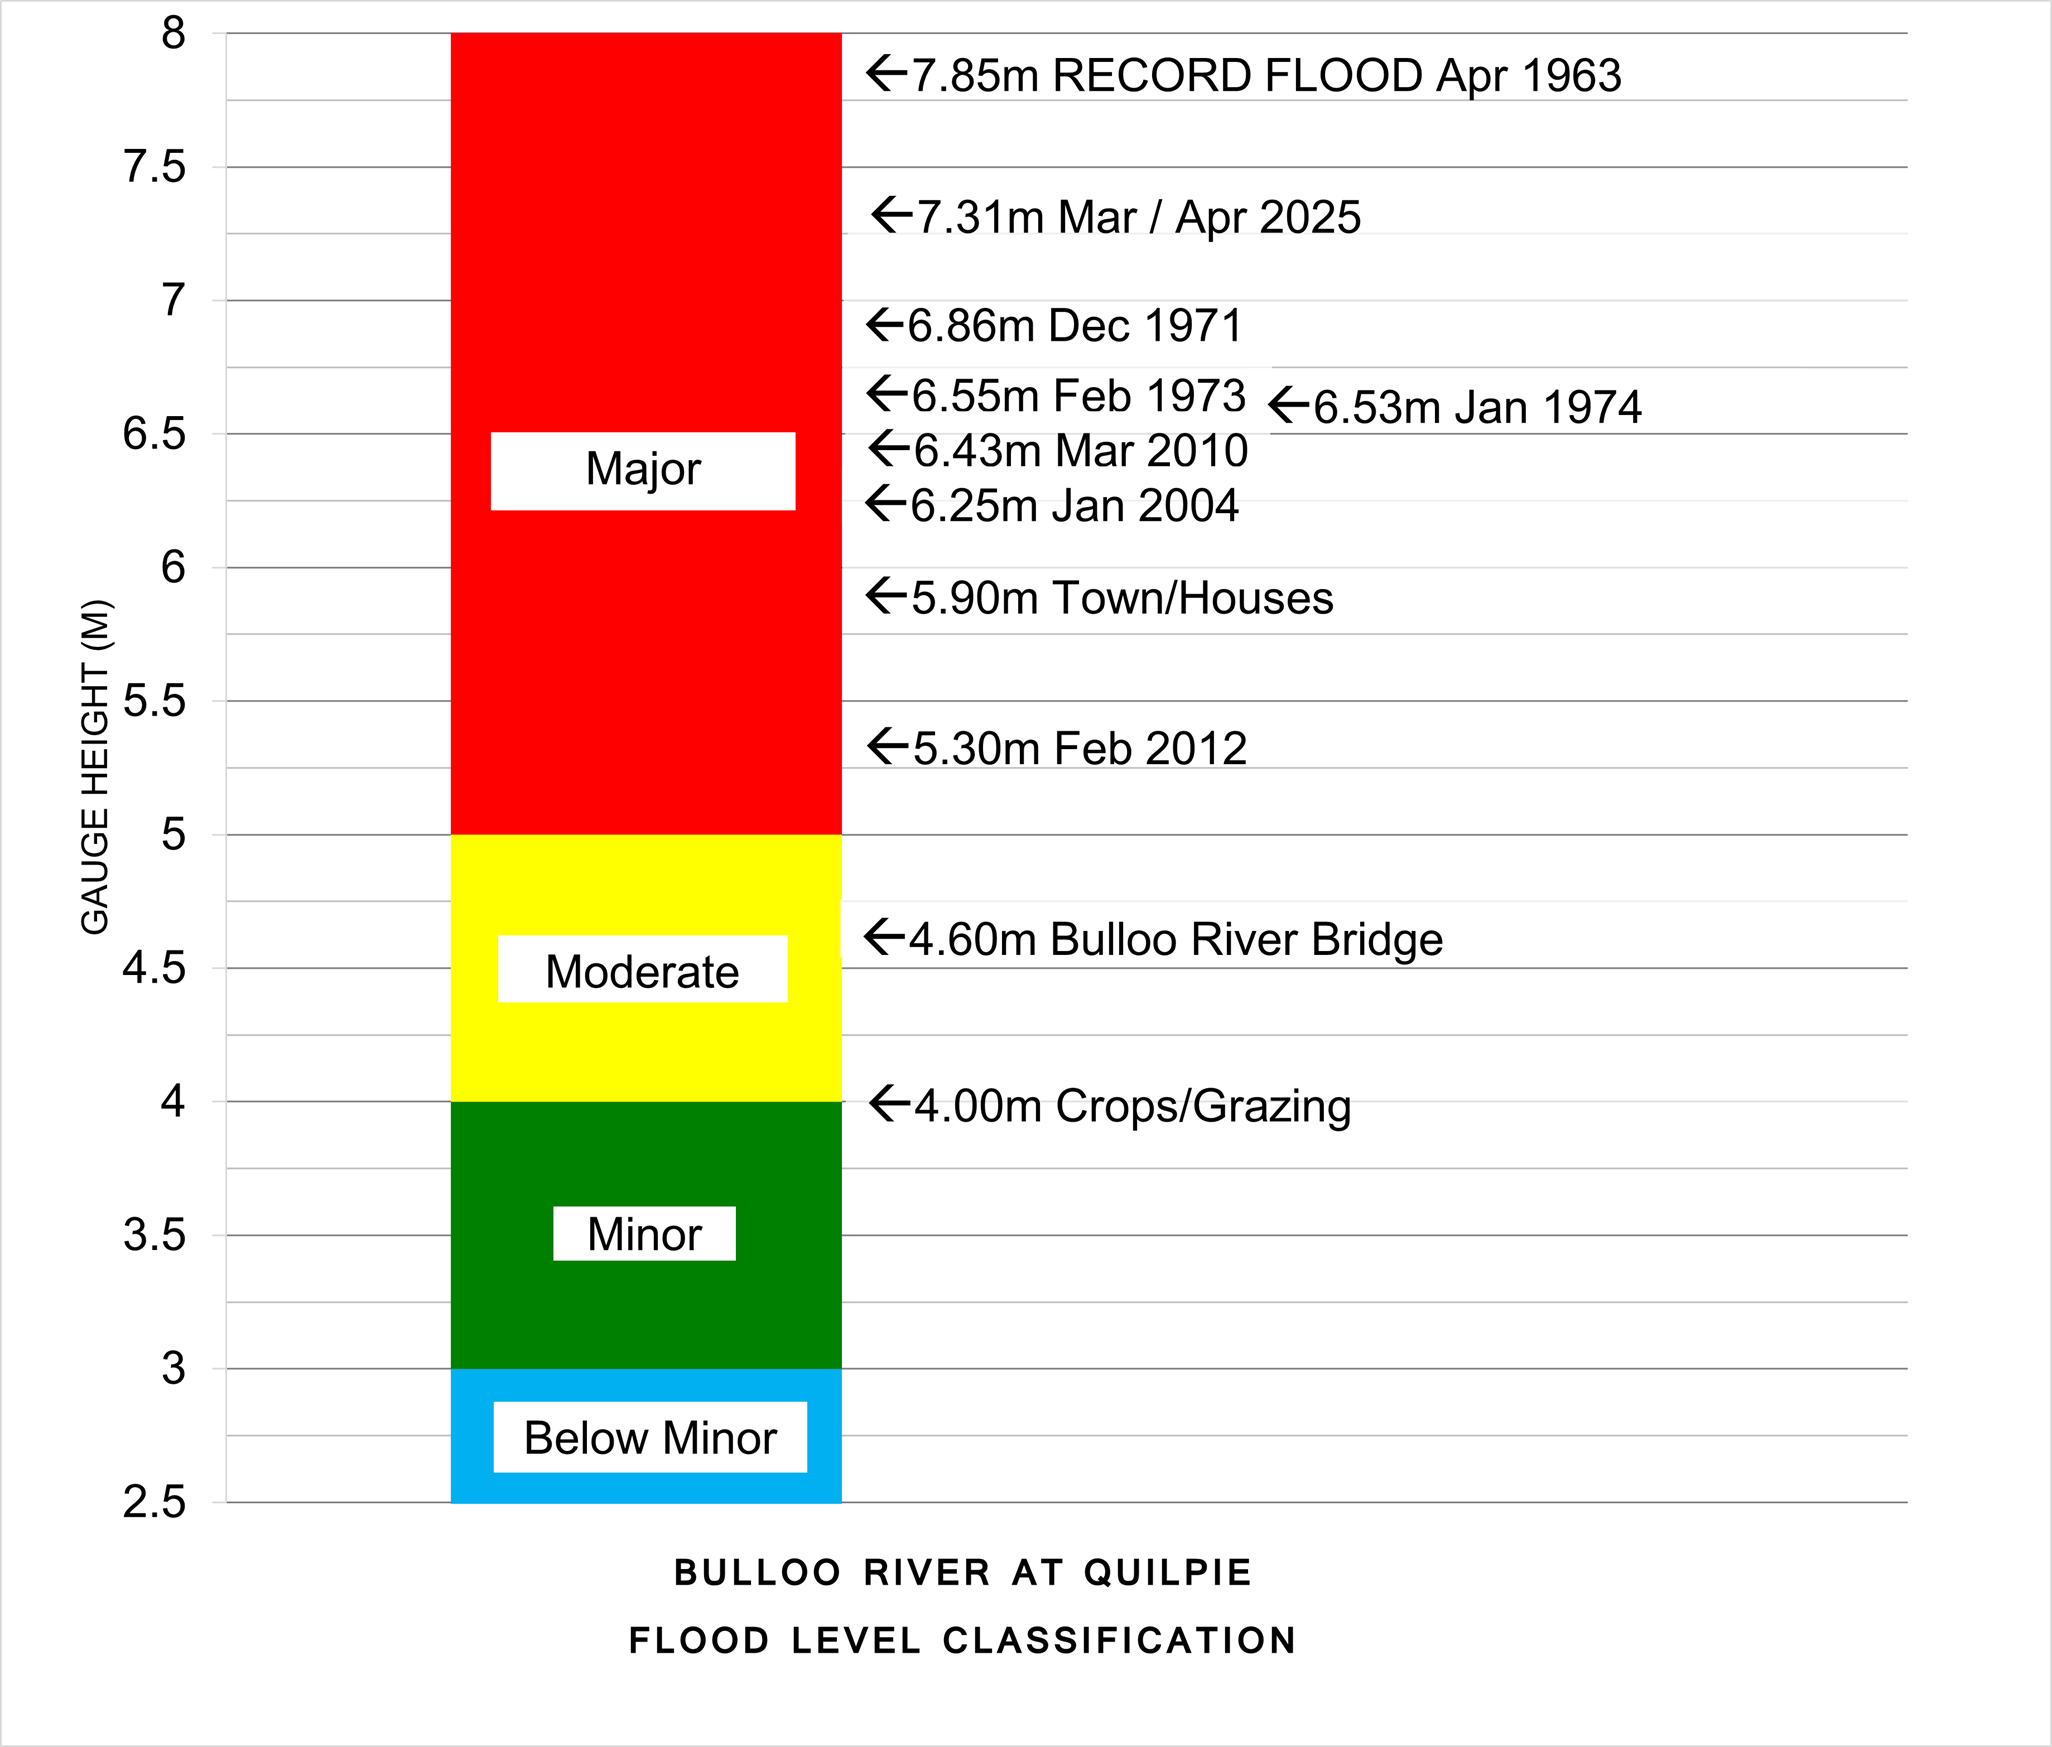
The flood of March/April 2025 exceeded the previous record flood in Thargomindah as the river level is estimated to have reached 7.5 m after the official gauge board was overtopped. This resulted in the rupture of the town's levee, widespread inundation of houses and long isolation periods. While Quilpie did not exceed the record flood height of 7.85 m in 1963, the river level peaked at 7.31 m on 29 March 2025 and the town was heavily affected.
| Flood Event | Quilpie | Thargomindah |
| Apr 1950 | 6.25 | |
| Apr 1963 | 7.85 | 6.25 |
| Dec 1971 | 6.86 | |
| Feb 1973 | 6.55 | |
| Jan 1974 | 6.53 | 6.78 |
| Dec 1975 | 6.05 | |
| Jan 1976 | 5.20 | 6.00 |
| May 1989 | 6.22 | 6.08 |
| Apr 1990 | 6.16 | 5.70 |
| Feb 1994 | ||
| Mar 1999 | 6.20 | 5.34 |
| Jan 2004 | 6.25 | 6.08 |
| Jan 2008 | 6.20 | 5.15 |
| Mar 2010 | 6.43 | 6.48 |
| Mar 2011 | 6.02 | 5.23 |
| Feb 2012 | 5.30 | 5.24 |
| Jan 2016 | 5.53 | |
| Mar 2019 | 6.16 | |
| Mar / Apr 2025 | 7.31 | 7.5* |
All heights are in metres on flood gauges.
*Estimated
Further Information:
- Latest rainfall and river heights
- For information on the flood warning service for the Bulloo River: Queensland Service Level Specification
- Bulloo River catchment map: Queensland Bulloo, Thomson/Barcoo/Cooper map
- National Arrangements for Flood Forecasting and Warning