


This document describes the flood risk and previous flooding in the Upper Condamine River catchment.
Last updated: July 2026.
Note this brochure refers to the Upper Condamine River to Warwick, for information on Myall Creek, the
Condamine River between Pratten and Warkon, or Balonne River please see the relevant brochure.
Flood Risk
The Condamine River catchment to Warwick covers an area of approximately 1300 square kilometres and includes the major tributaries Swan Creek, Emu Creek and Rosenthall Creek which join the Condamine River just upstream of Warwick. The headwaters of these tributaries rise along the New South Wales border in the Herries Range to the south, and in the rainforests of Main Range to the east. Due to the fan-like shape of the catchment, heavy rainfall over the catchment can cause major flooding of agricultural areas adjacent to the waterways, and major flooding of residential and commercial areas of Killarney and Warwick. Heavy rainfall at The Head quickly makes its way to Killarney, near the top of the catchment, with limited lead time. This increases the risk of flash flooding at Killarney.
Previous Flooding
Flood records for Warwick extend back as far as 1887 and indicate that the city has a long history of flooding from the Condamine River. The highest recorded flood occurred in February 1976 when the river rose to a height of 9.10 metres on the Warwick flood gauge located at McCahon Bridge. The flood caused widespread flooding in the Warwick area with newspapers at the time reporting damage to over 100 homes and over 1000 people left displaced during the flood.
More recent major flood events occurred two weeks apart in December 2010 and January 2011 as part of a broad system which flooded large parts of Queensland. The most recent major flooding occurred in May 2022, where the river reached 7.56m at Warwick, with parts of Warwick being inundated and some residents evacuated.
Previous flooding events
| Flood Event | The Head | Killarney | Elbow Valley | Murray's Bridge | Warwick |
| June 1950 | - | 6.99 | - | - | 7.78 |
| January 1974 | 3.96 | 5.61 | 5.40 | - | 7.01 |
| February 1976 | 4.30 | 6.13 | 6.68 | - | 9.10 |
| January 2008 | 4.80 | 6.60 | 6.24 | 7.55 | 6.04 |
| December 2010 | - | 6.45* | 6.13 | 8.40 | 7.90 |
| January 2011 | - | 6.45* | - | 8.95 | 8.35 |
| January 2013 | 5.00 | 6.25 | 6.10 | 8.40 | 7.21 |
| March 2017 | - | 6.15 | 4.61 | 7.45 | 6.21 |
| May 2022 | 4.36 | 5.84 | 6.20 | 8.80 | 7.56 |
All heights are in metres on flood gauges.
* Estimated Peak Flood Heights from flood marks and other information.
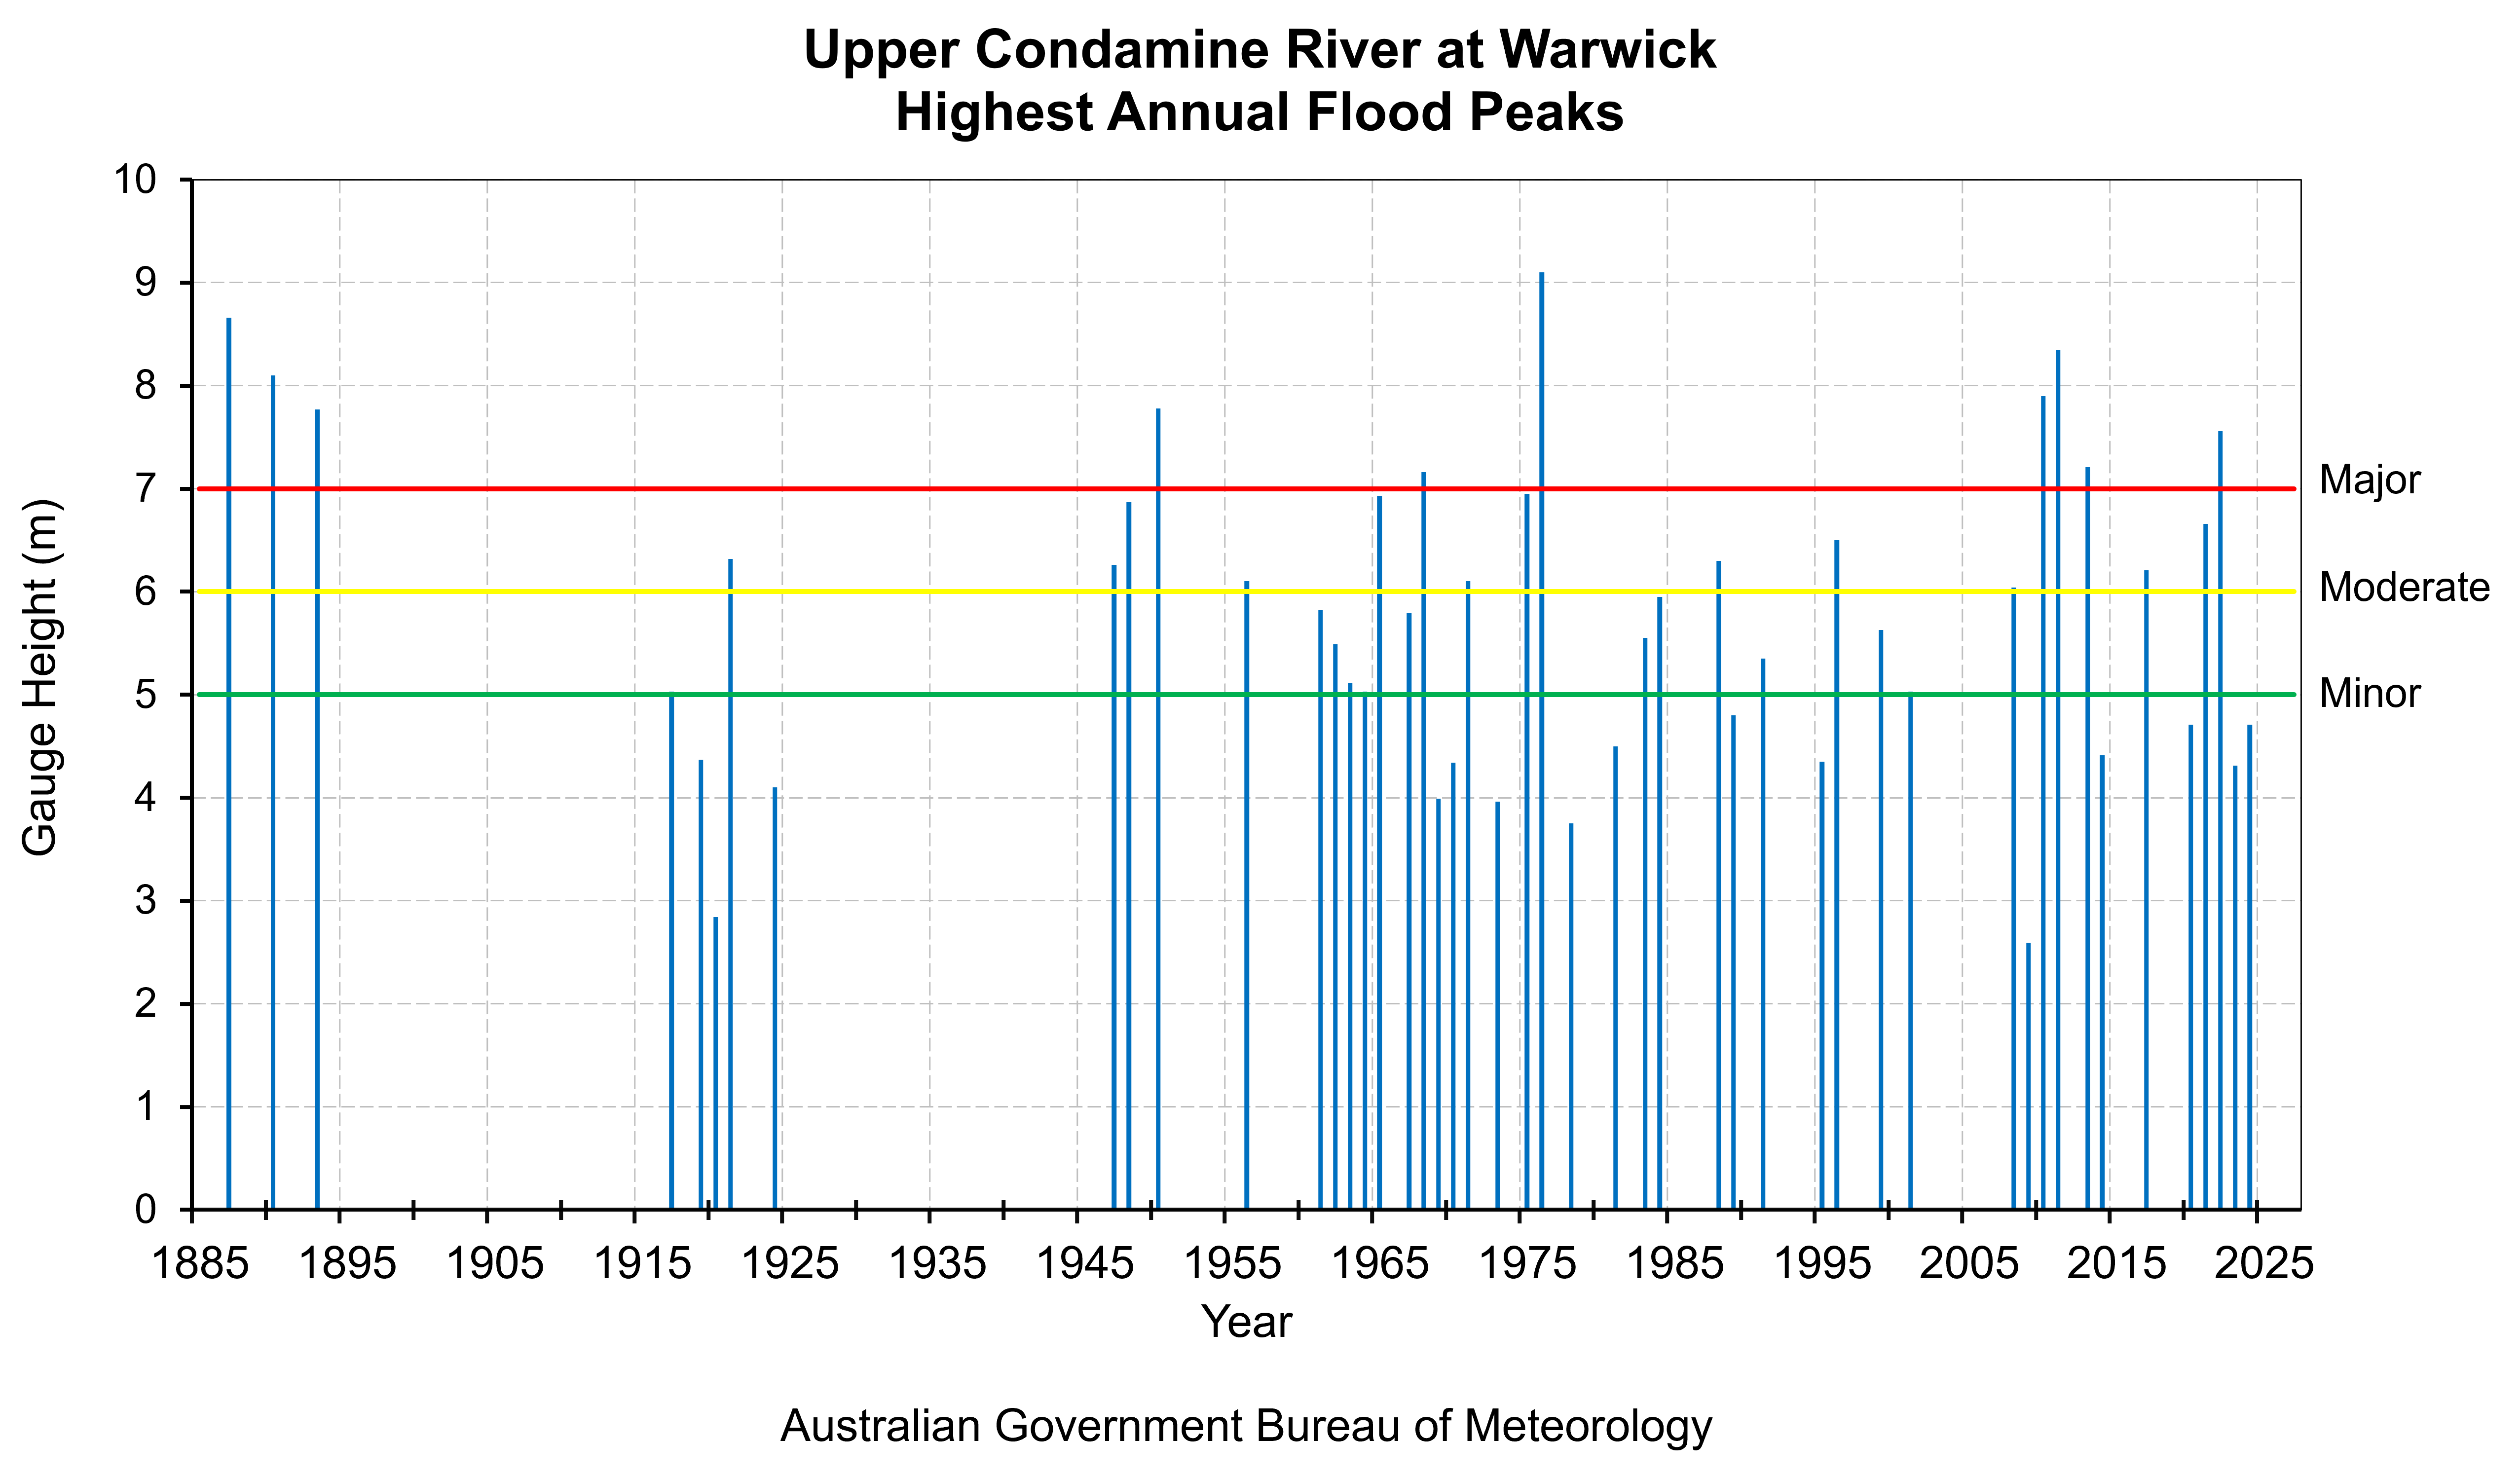
This chart shows flood level classifications of recorded flood gauge height observations of the Upper Condamine River at Warwick.
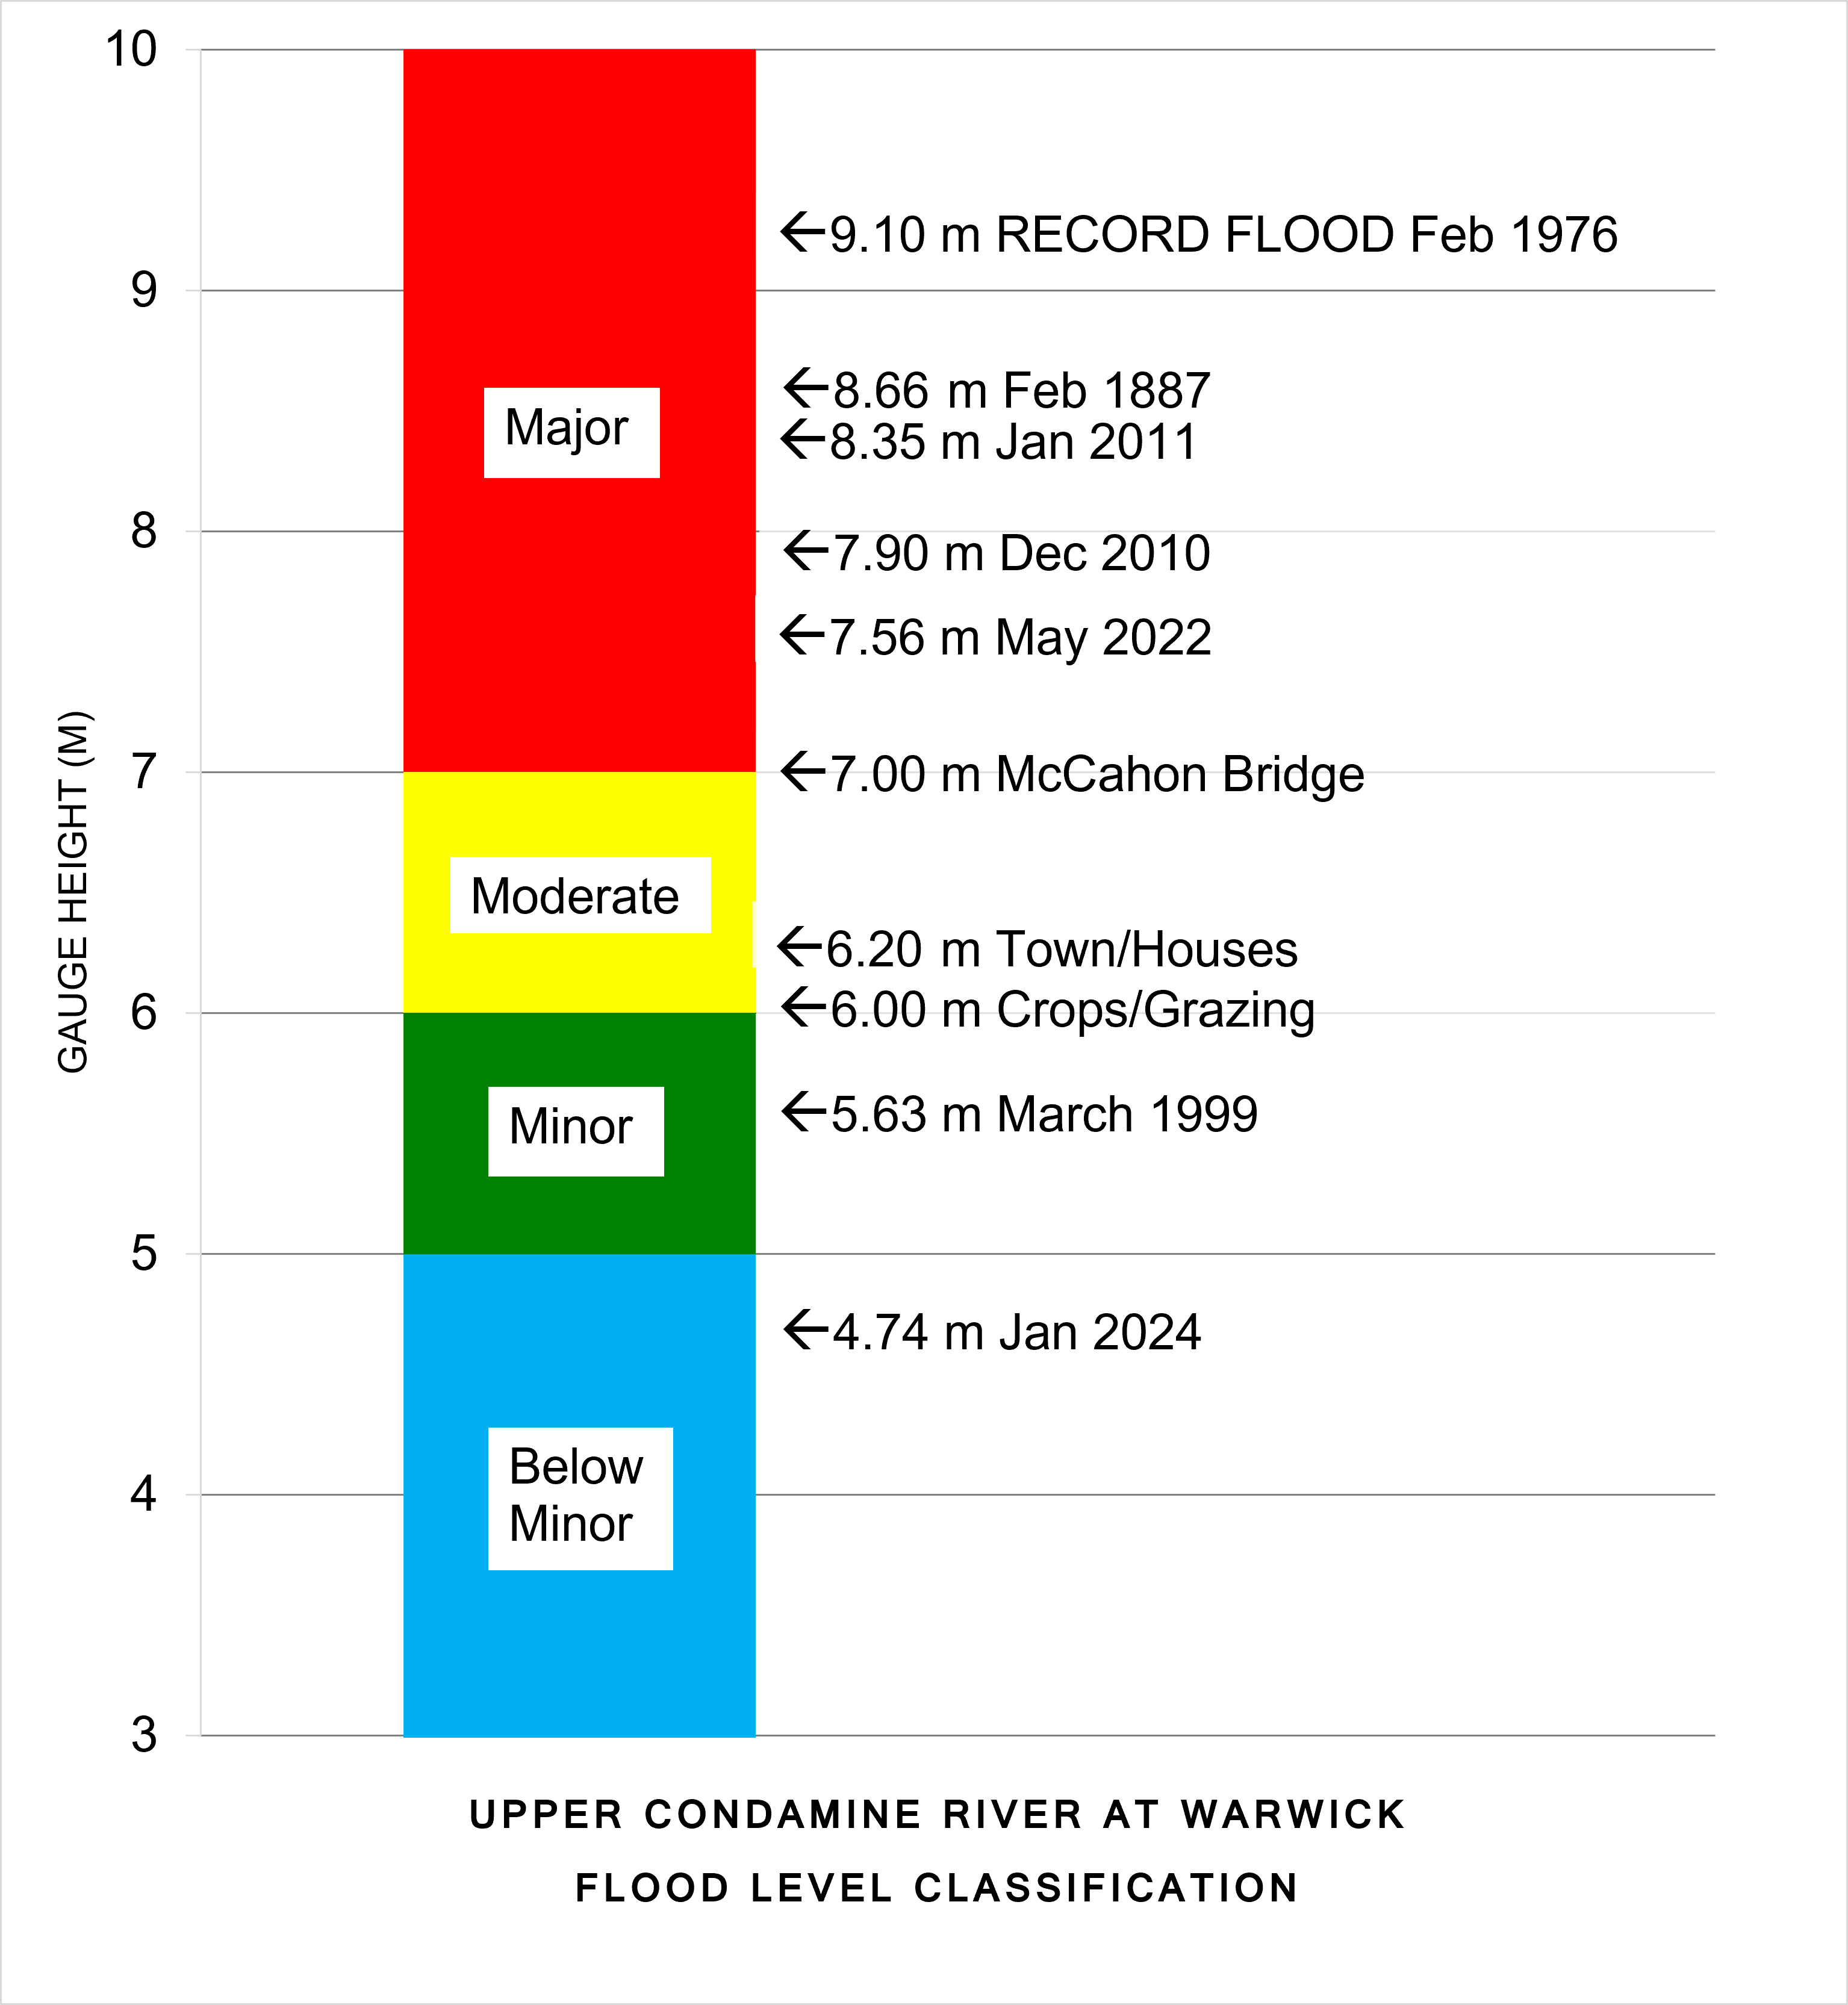
The totem pole shows flood level classification and associated impacts related to local reference sites, along with recorded flood gauge height observations of notable flood events that have occurred on the Upper Condamine River at Warwick
Further Information:
- Latest rainfall and river heights
- Flood warning service for the Upper Condamine River: Queensland Service Level Specification
- Catchment map: Queensland Upper Condamine map
- National Arrangements for Flood Forecasting and Warning