


This brochure describes the flood risk and previous flooding in the Diamantina River catchment, last updated in August 2025.
Last updated: June 2026
Flood Risk
The vast Diamantina River catchment is located in southwest Queensland and covers an area of approximately 119,000 square kilometres. The river rises in the Swords Range, 70 kilometres southwest of Kynuna and flows initially in a north and easterly direction before changing to a southwesterly direction 70 kilometres west of Winton. Major tributaries joining the river are the Western River (Winton) and Mayne Rivers above Diamantina Lakes, and Farrars Creek below Monkira. The river does not have a well-defined main channel but consists generally of a series of wide, relatively shallow channels, particularly in the lower reaches. The river passes through the town of Birdsville before crossing the Queensland-South Australia border 10 kilometres south of Birdsville, and eventually flowing into Lake Eyre. Floods normally develop in the headwaters of the Diamantina River and in its major tributaries, however, flooding may result from heavy rainfall falling in the middle to lower reaches of the catchment around Diamantina Lakes. Local rainfalls can be a significant factor throughout these areas.
Major flooding requires a large-scale rainfall event over the Diamantina River catchment. Typically, this occurs during summer with the intrusion of a deep tropical airmass into the region or an ex-tropical cyclone moving through the region. However, flooding has been recorded outside of the typical wet season.
The following can be used as a rough guide to the likelihood of flooding in the catchment:
75mm in 24 hours over isolated areas, with lesser rains of 50mm over more extensive areas will cause stream rises and the possibility of minor flooding. If lesser rainfalls have been recorded in the previous 24 to 72 hours, then moderate to major flooding may develop.
100mm in 24 hours will cause isolated flooding in the immediate area of the heavy rain.
General 100mm or heavier falls in 24 hours over a wide area will most likely cause major flooding in the middle to lower reaches of the Diamantina River between Tulmur and Diamantina Lakes extending downstream to Monkira and Birdsville.
Flooding on the Diamantina River is typically long and slow, and can take several weeks or even months to progress from the upper catchment down to the South Australian border, and prolonged flood peaks occur. The exception to this is in the upper catchment, particularly at Winton where heavy rainfall can lead to relatively rapid rises on the Western River.
Previous Flooding
The Diamantina River catchment has well documented history of flooding dating back some 50 years, including Diamantina Lakes (commenced 1965), Birdsville (commenced 1949) and Winton (1950).
The main impact of the record major flooding in January 1974 at Birdsville, and more recently the floods of 1991, 1997, 1999, 2000, 2009, and 2025 is the isolation of towns and properties and the extensive inundation of grazing lands which can last several months in some areas, with road transport disrupted for considerable periods of time.
During the floods of 2000 and again in January 2026, water entered parts of Winton, leading to water under some properties, particularly south of Elderslie Street. This followed very heavy rainfall in the upper Western River catchment, as well as the Jessamine and Mills Creeks, with some locations recording over 200 mm in 24 hours. Ungauged tributaries upstream of Winton often result in limited lead time and high uncertainty in surrounding forecast peak flood heights at Winton.
The table below summarises the flood history of the Diamantina River basin - it contains the flood gauge heights of the more significant recent floods.
Previous flooding events
| Flood Event | Winton | Elderslie | Tulmur | Diamantina Lakes | Monkira | Durrie Station | Roseberth Station | Birdsville |
| March 1950 | 4.47* | - | - | - | 5.79 | - | - | 8.54 |
| March 1971 | - | - | - | 6.38 | 5.03 | - | 6.33 | 8.08 |
| January/February 1974 | 4.53* | - | 9.75 | 7.71 | 6.12 | 5.30 | 7.60 | 9.45 |
| February 1976 | - | - | - | 7.29 | 5.25 | 3.90 | 6.50 | 8.20 |
| February 1991 | - | - | - | 6.40 | 4.80 | 4.30 | 6.40 | 8.20 |
| Jan 1999 | - | - | 4.75 | 7.15 | - | 3.10 | 5.70 | 7.40 |
| February/March 2000 | 4.65* | 2.94 | 7.65 | 6.85 | 4.80 | 3.10 | 5.80 | 7.35 |
| January 2004 | 2.90 | 3.65 | 6.25 | - | 5.00 | - | - | 8.20 |
| February 2009 | 2.45 | 4.80 | 7.40 | 6.53 | 4.13 | 2.81 | 5.70 | 7.20 |
| March 2010 | - | - | - | 3.81 | 4.10 | 3.25 | 5.96 | 7.90 |
| March 2011 | - | 3.15 | 4.30 | 4.73 | 3.87 | 2.90 | 5.85 | 7.95 |
| February 2012 | 2.40 | 3.60 | - | 5.05 | 3.55 | - | - | - |
| March 2018 | 3.70 | 4.50 | 7.70 | 6.93 | 4.30 | 2.00 | 5.23 | 5.98 |
| March 2019 | 3.55 | 5.20 | 6.60 | 7.68 | 5.42 | 3.80 | 6.48 | 8.15 |
| March/April 2025 | 3.30 | 3.10 | - | 7.54 | 5.39 | 4.50 | 6.95 | 8.75 |
| January/March 2026 | 4.05 | 3.20 | - | 6.30 | 4.0 | - | 5.25 | 7.30 |
All heights are in metres on flood gauges.
*Estimated peak flood heights from flood marks and other information.
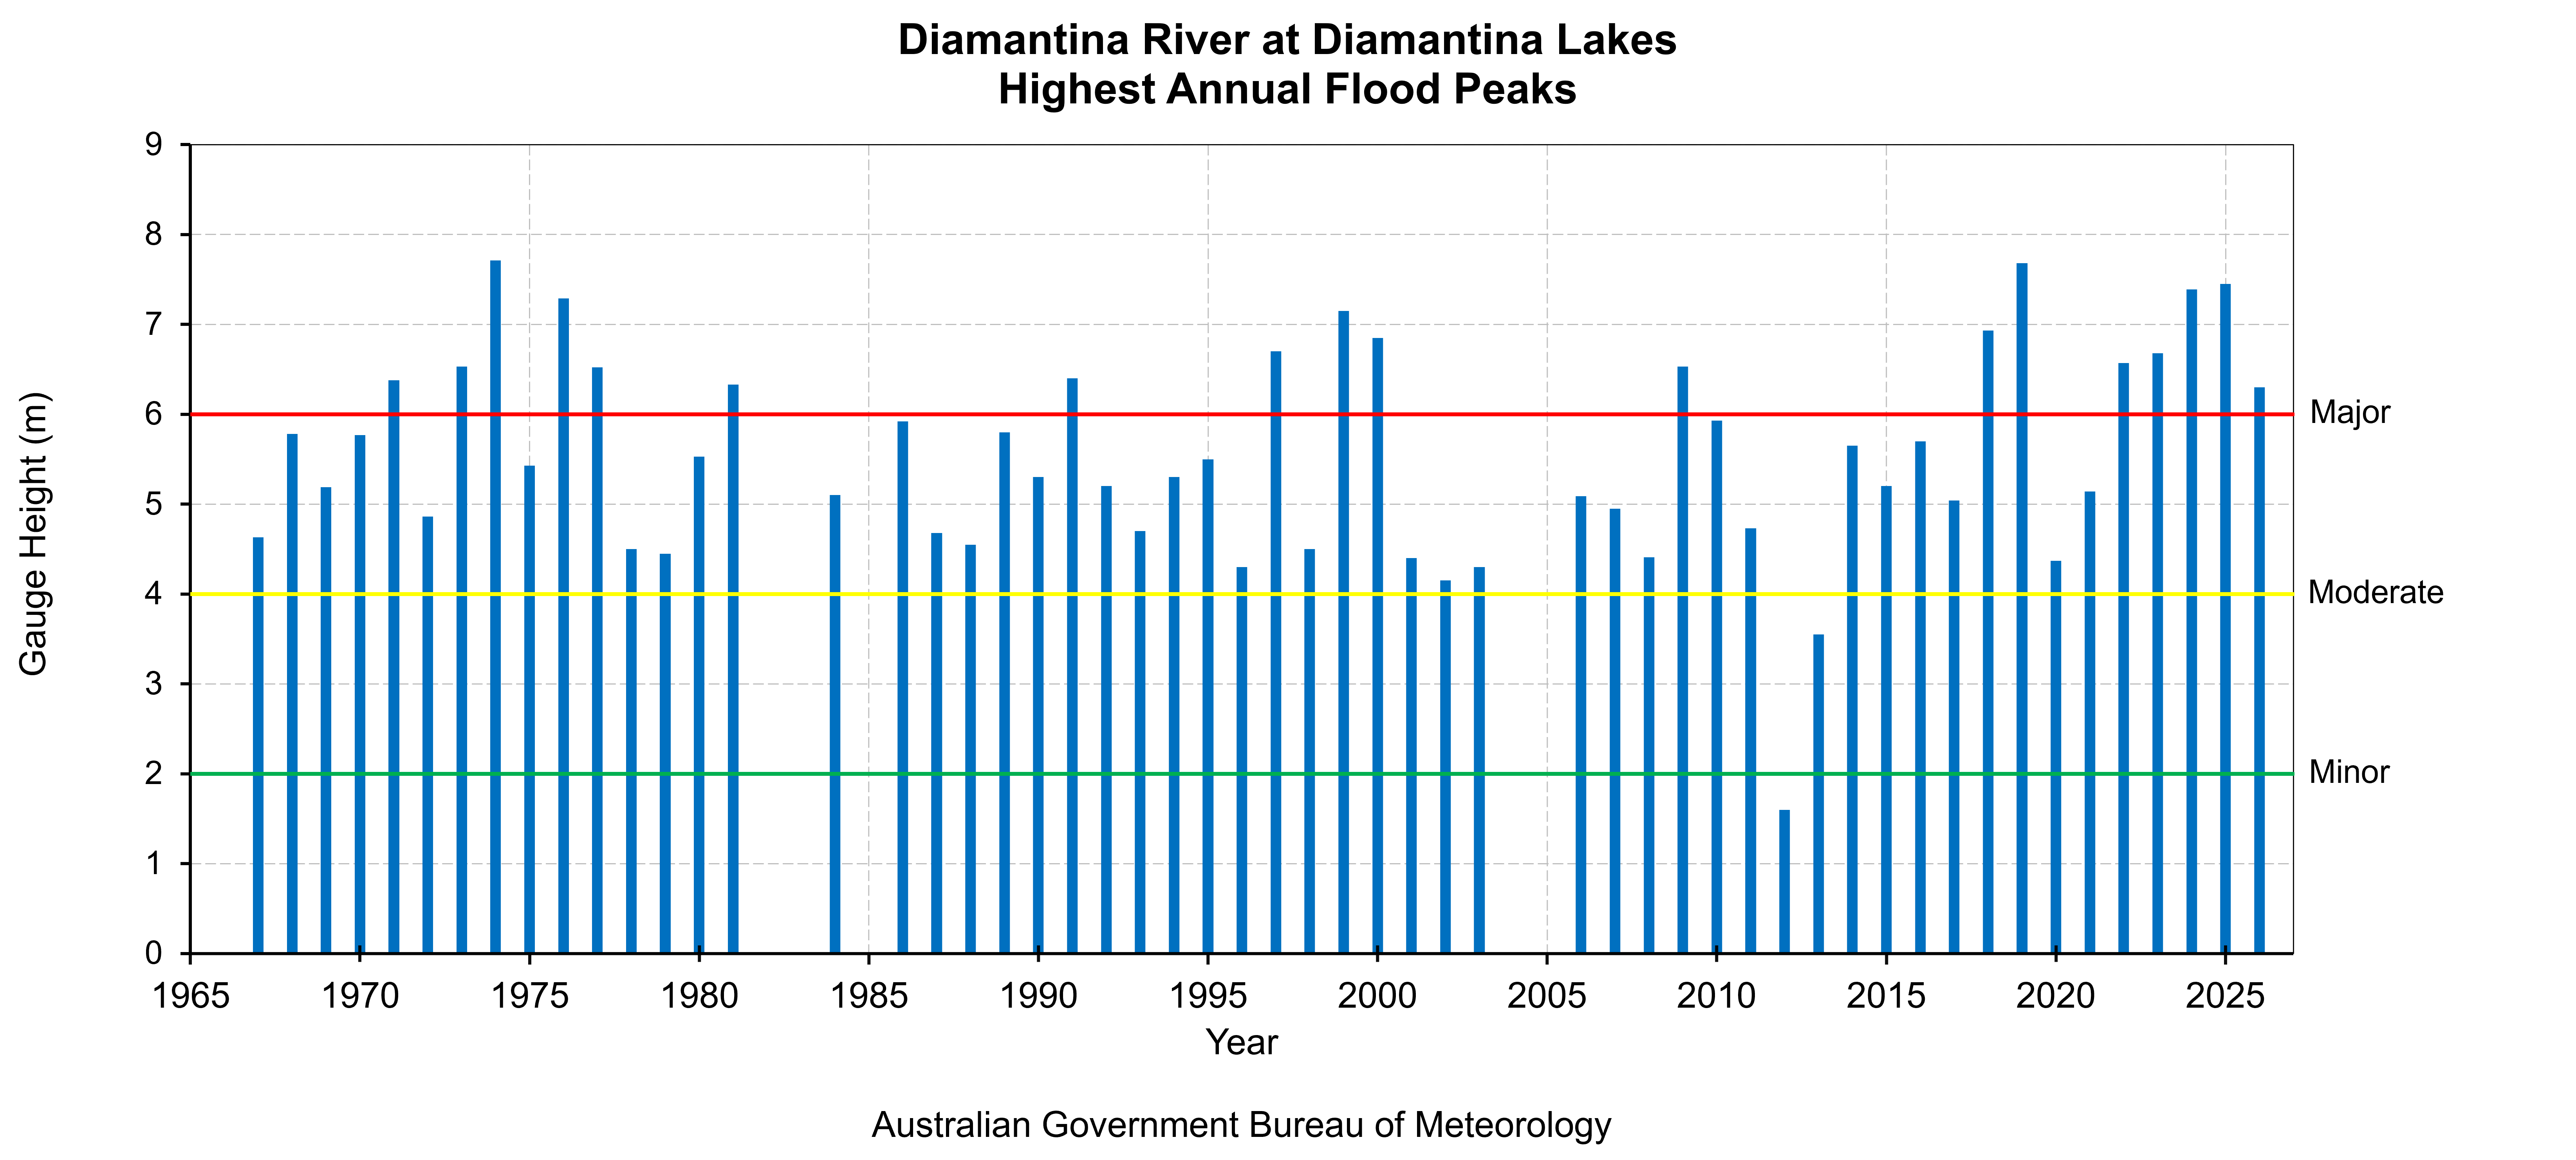
Chart shows flood level classification of recorded flood gauge height observations of the Diamantina River at Diamantina Lakes.
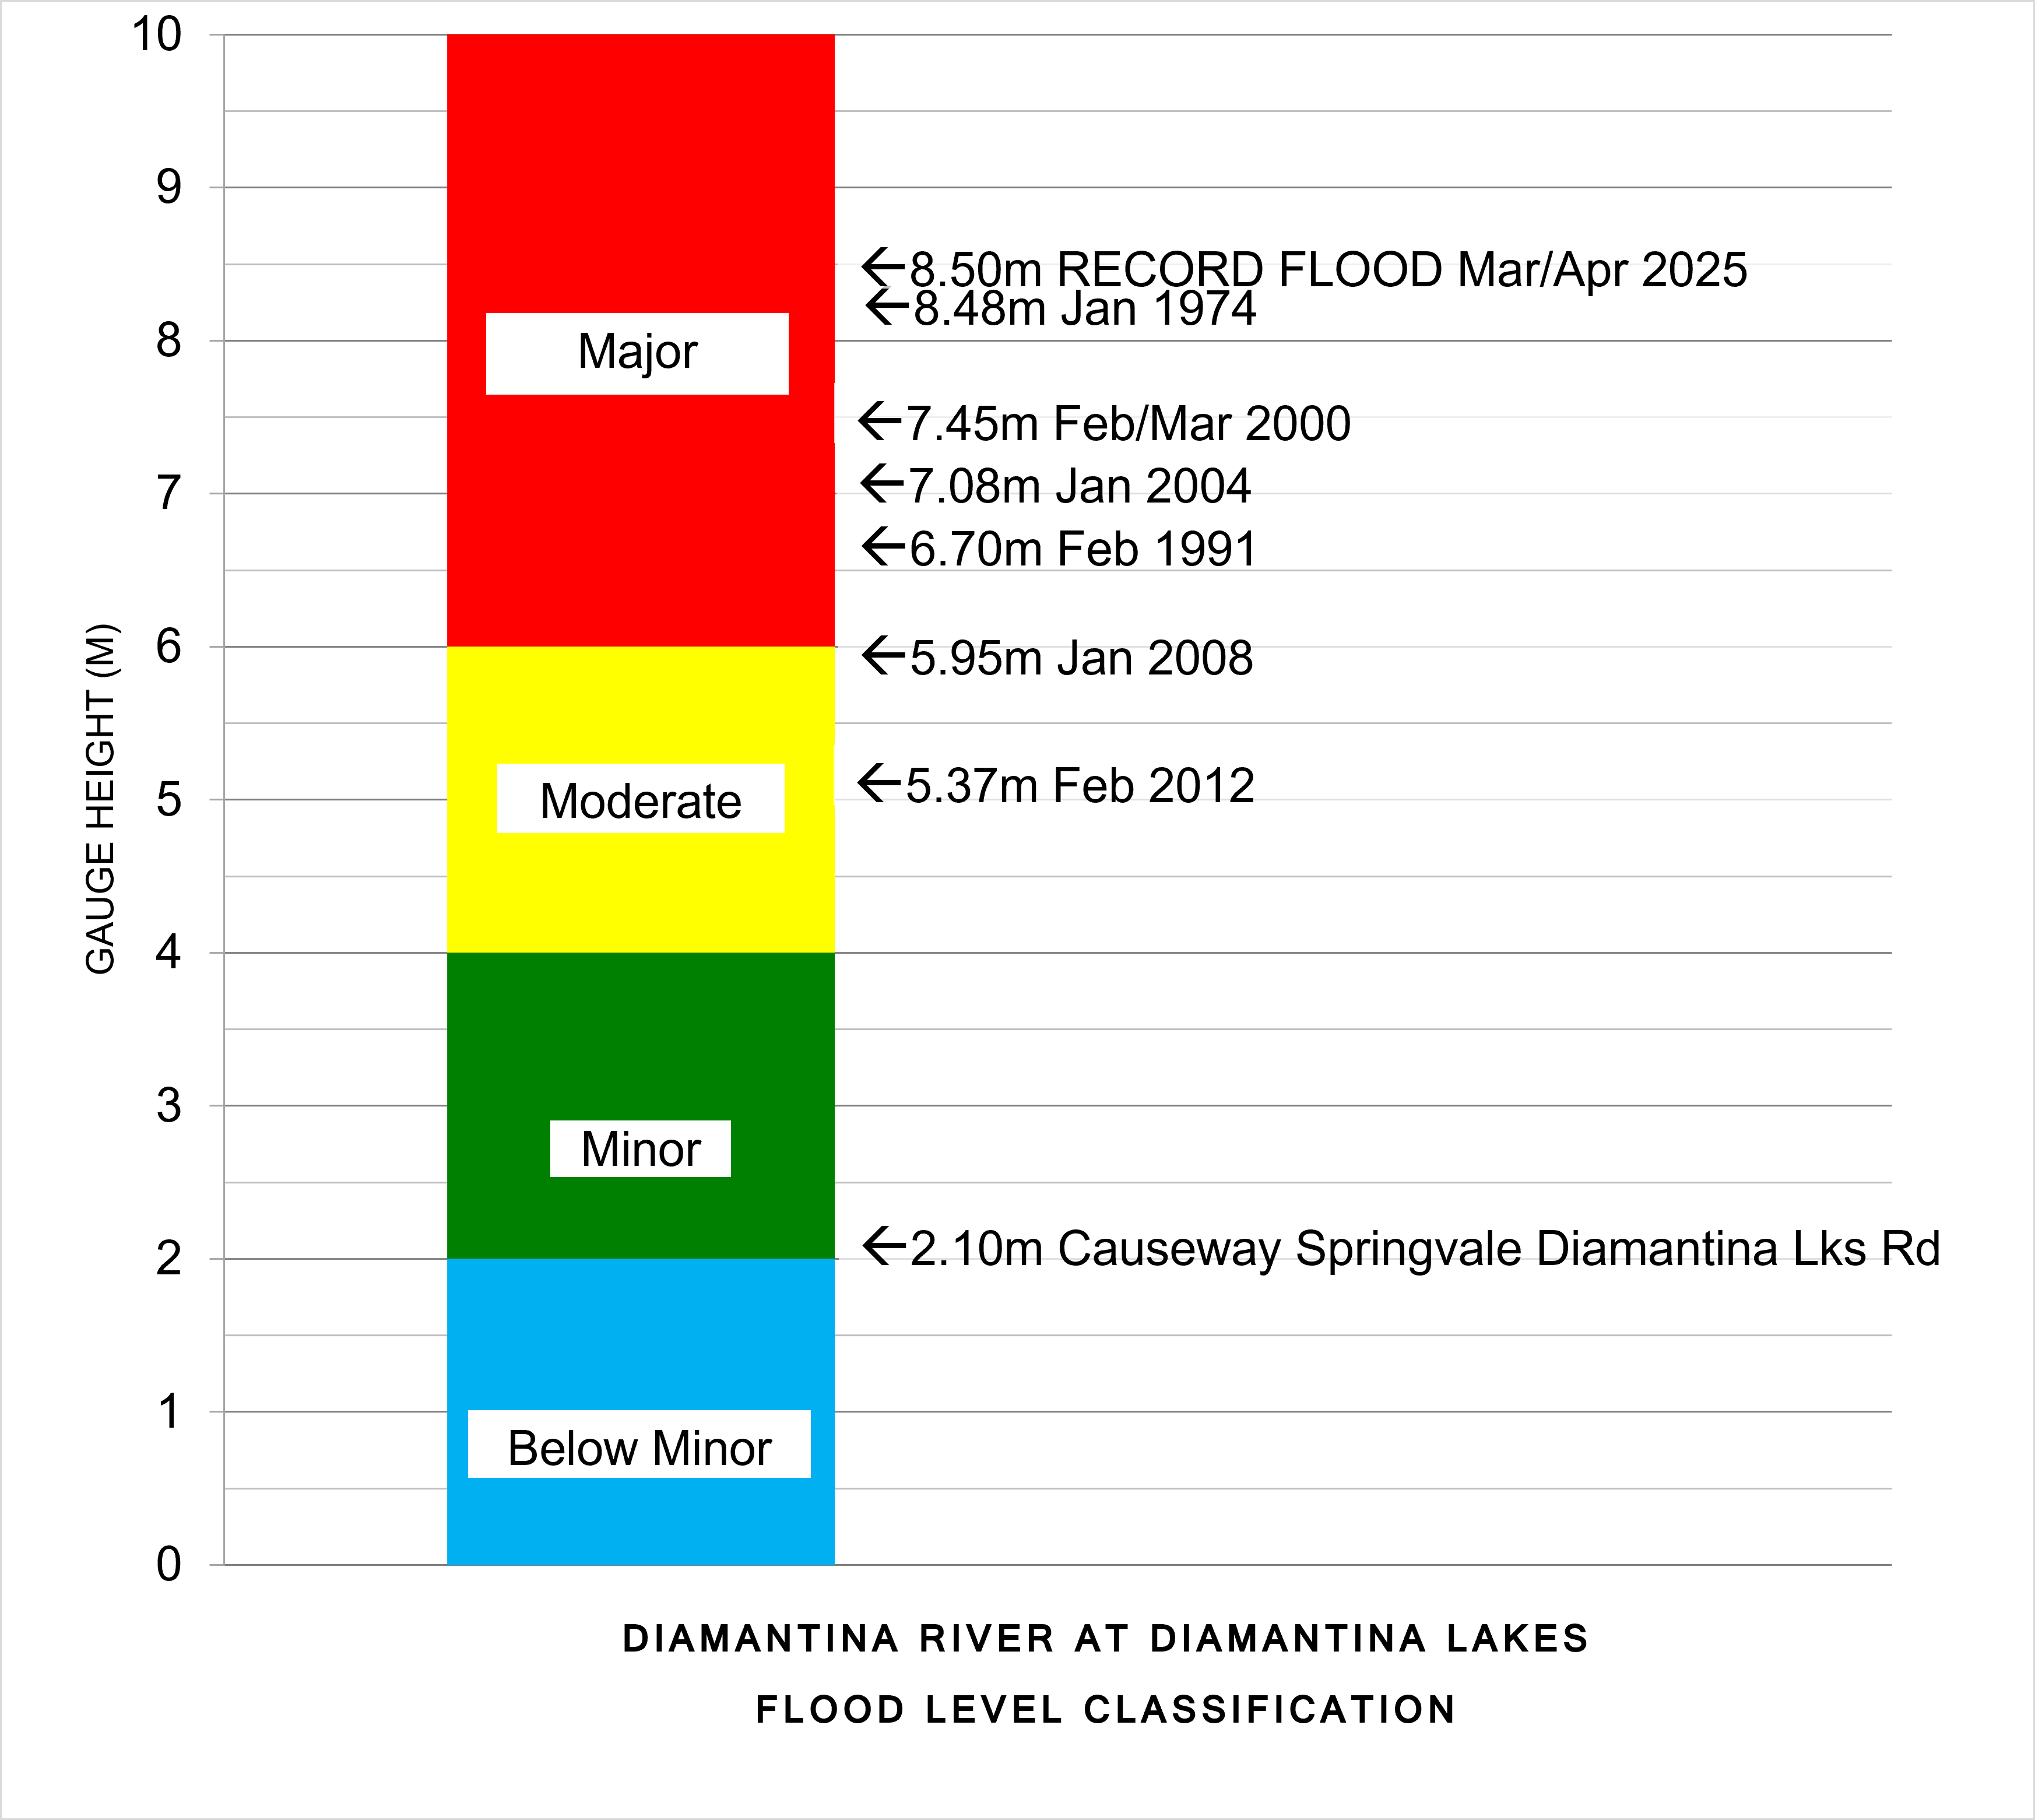
The totem pole shows flood level classification and associated impacts related to local reference sites, along with recorded flood gauge height observations of notable flood events that have occurred on the Diamantina River at Diamantina Lakes.
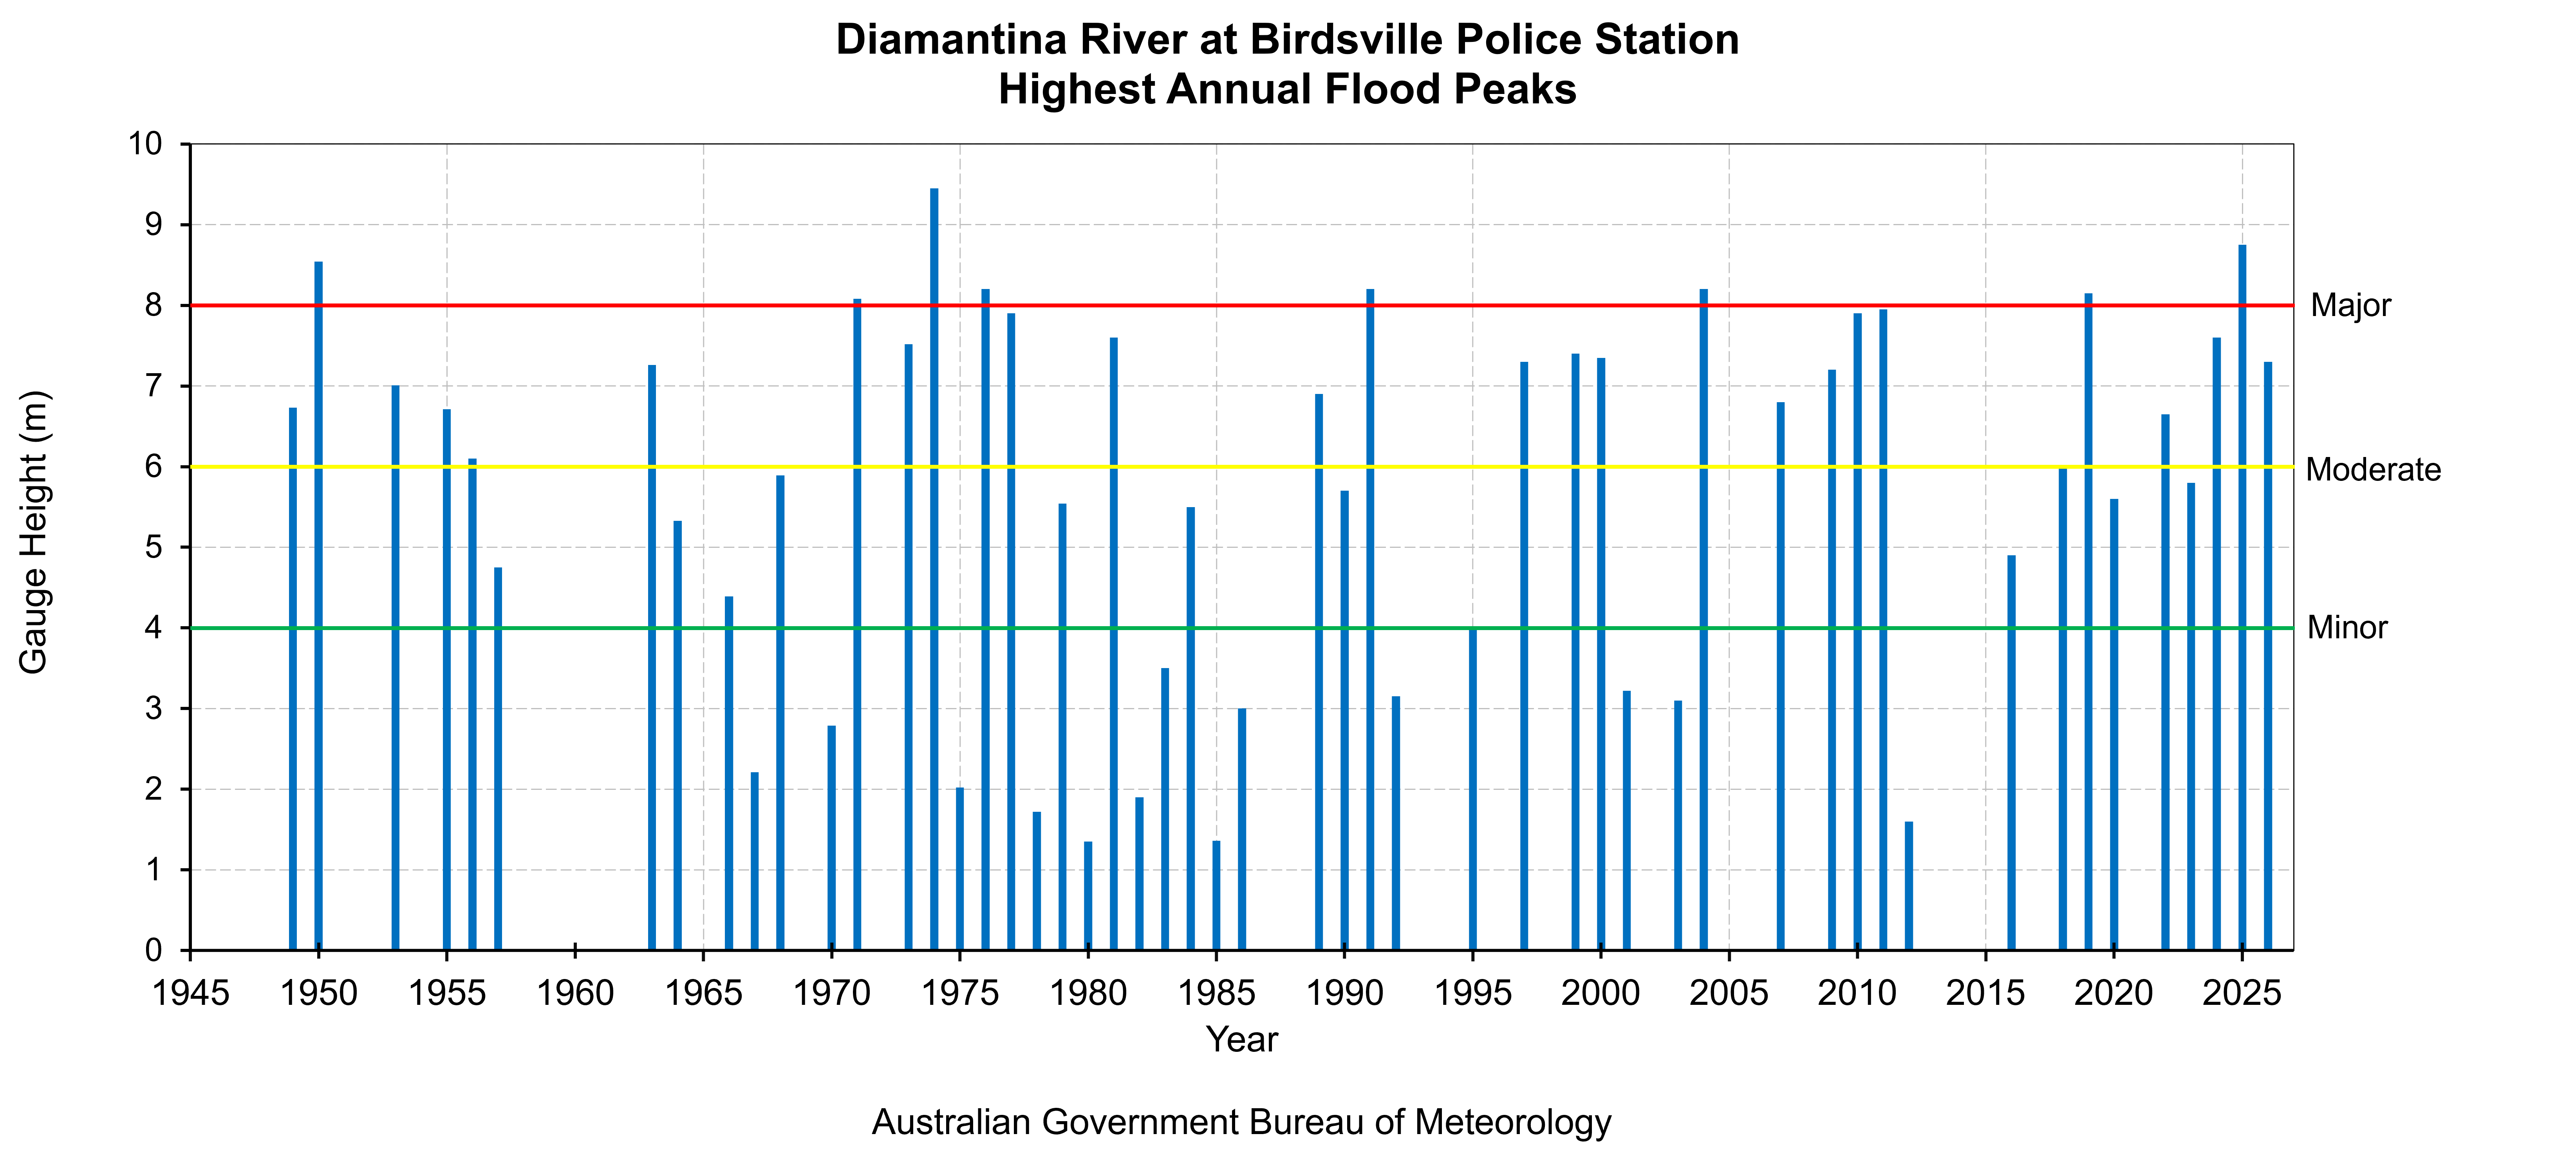
Chart shows flood level classification of recorded flood gauge height observations of the Diamantina River at Birdsville.
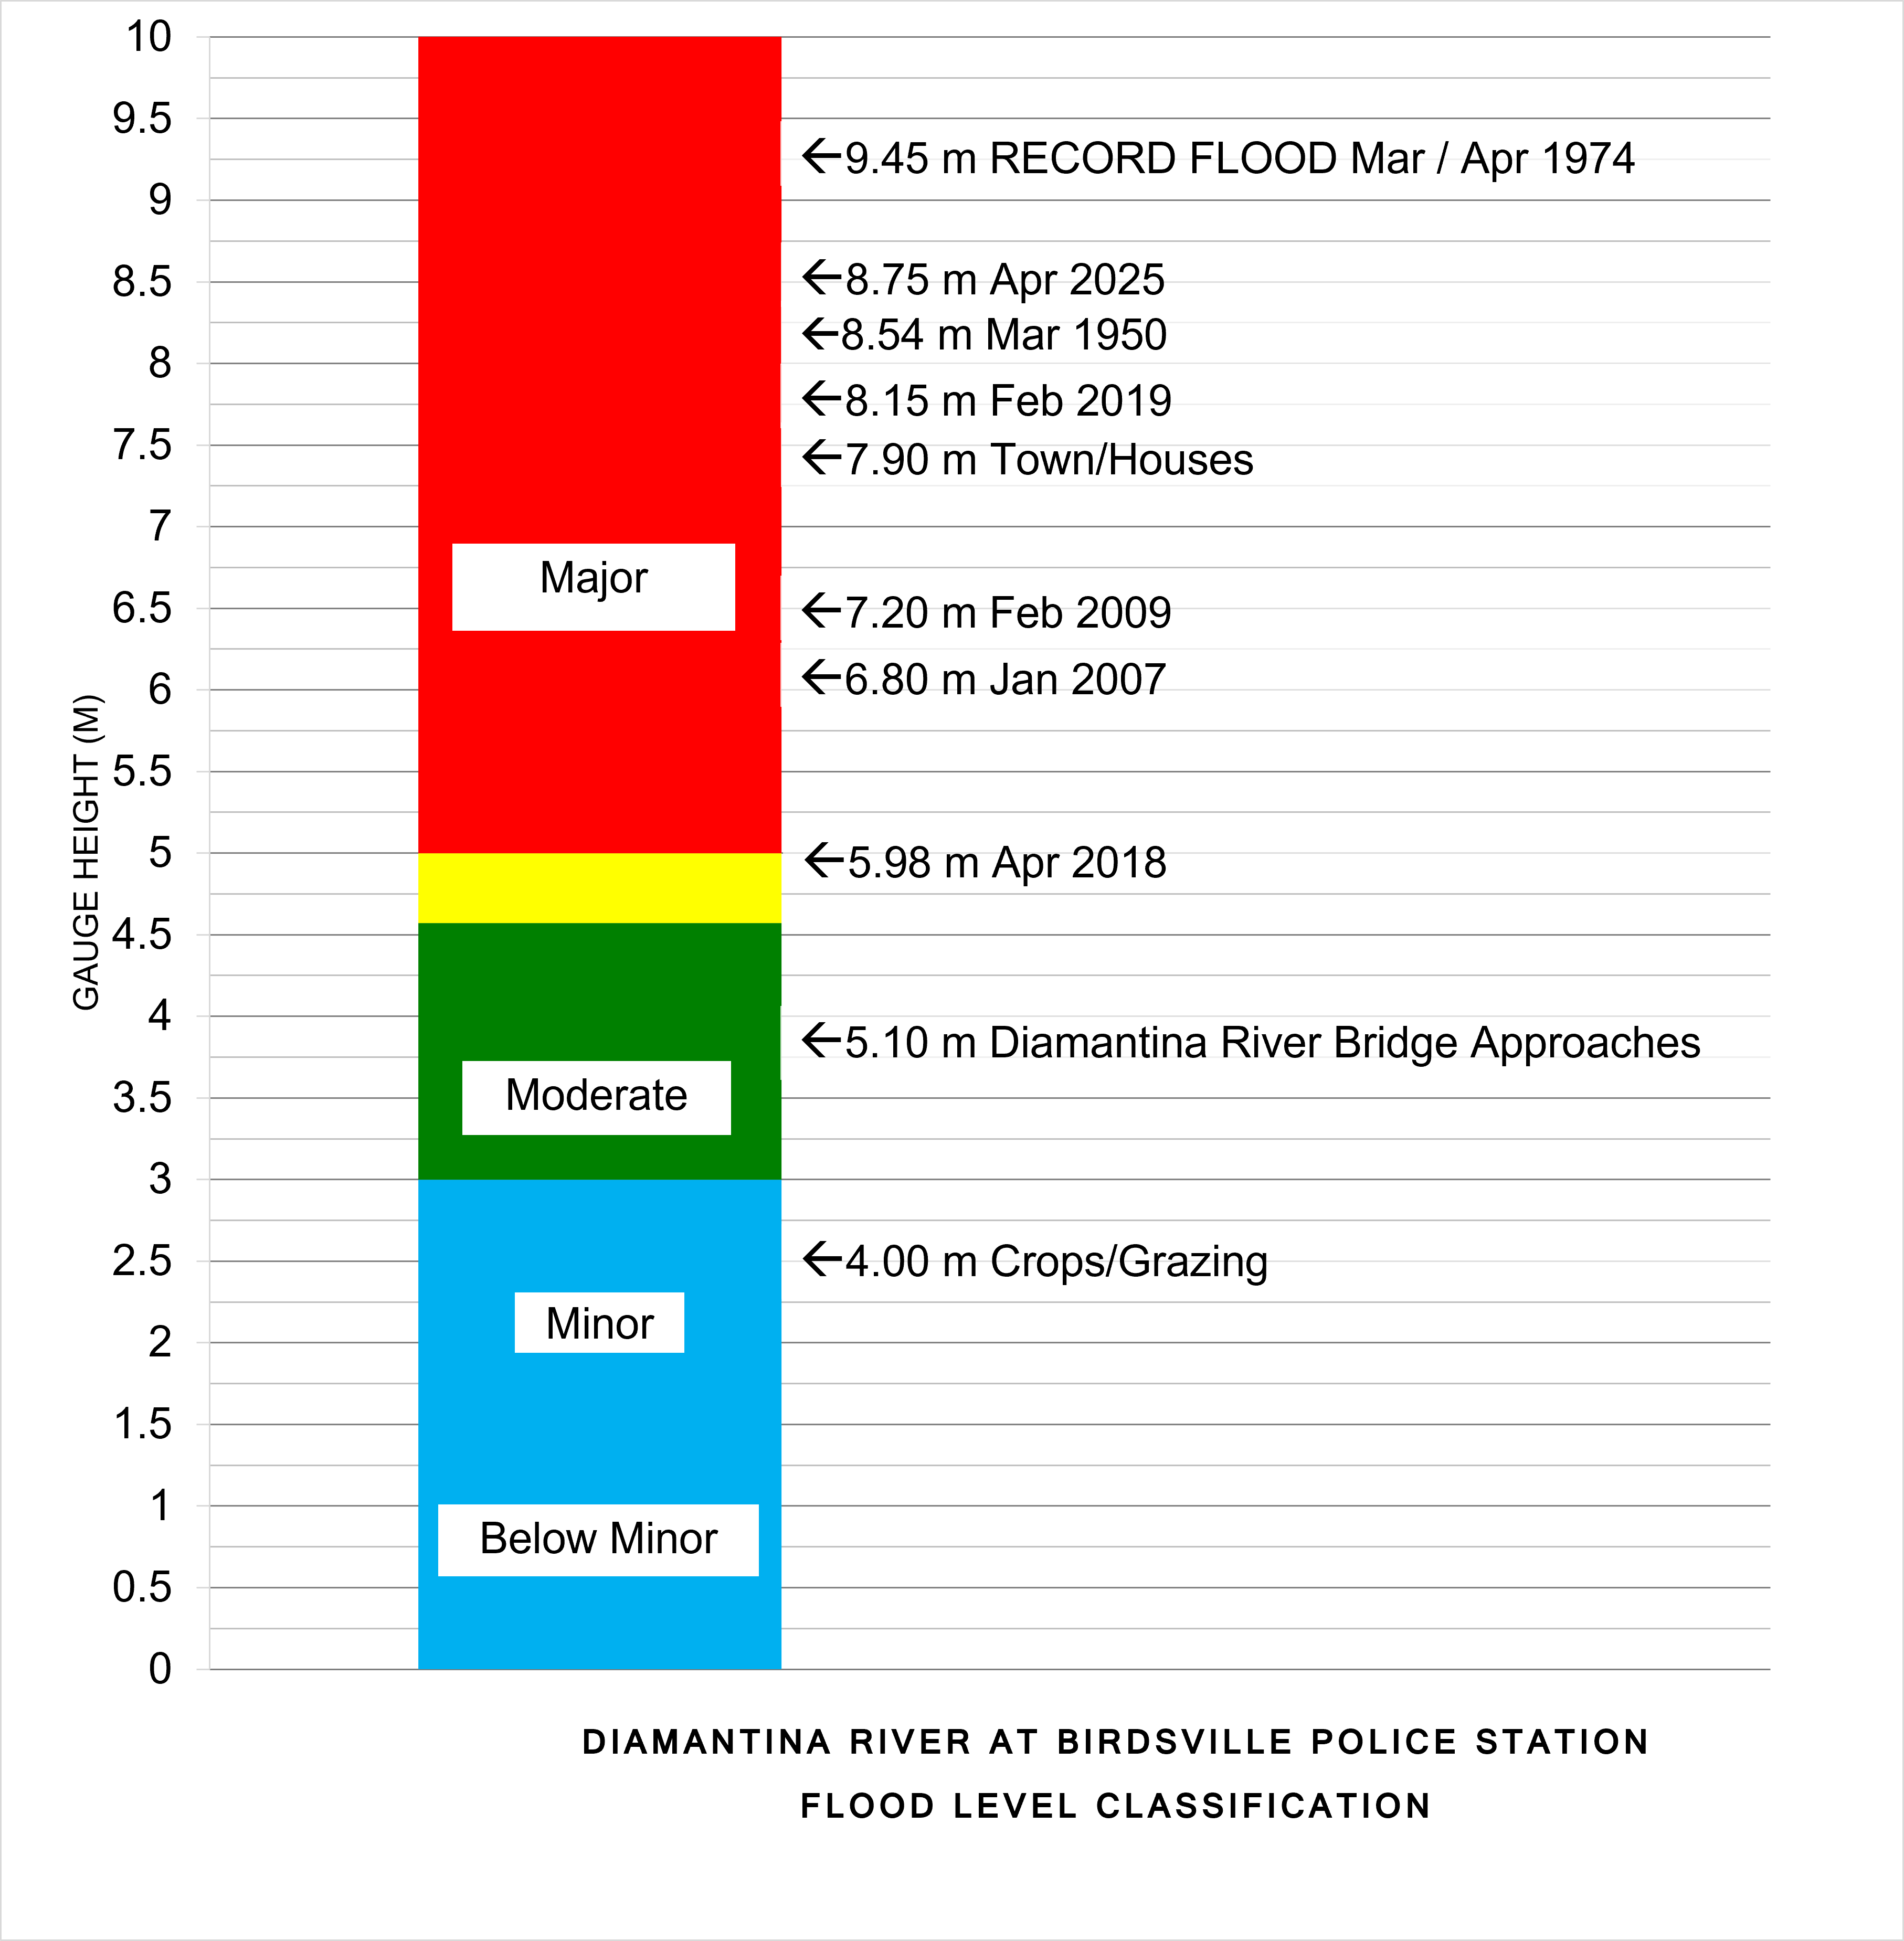
The totem pole shows flood level classification and associated impacts related to local reference sites, along with recorded flood gauge height observations of notable flood events that have occurred on the Diamantina River at Birdsville.
Further Information:
- Latest rainfall and river heights
- Flood warning service for the Diamantina River: Queensland Service Level Specification
- Catchment map: Diamantina Catchment map
- National Arrangements for Flood Forecasting and Warning