


This document describes the flood risk and previous flooding in the Flinders River
catchment.
Last updated: July 2026.
Flood Risk
The Flinders River catchment is located in northwest Queensland and drains an area of approximately 109,000 square kilometres. The river rises in the Great Dividing Range, 110 kilometres northeast of Hughenden and flows initially in a westerly direction towards Julia Creek, before flowing north to the vast savannah country downstream of Canobie. It passes through its delta and finally into the Gulf of Carpentaria, 25 kilometres west of Karumba.
The Cloncurry and Corella Rivers, its major tributaries, enter the river from the southwest above Canobie. There are several towns in the catchment including Hughenden, Richmond, Julia Creek and Cloncurry.
Floods normally develop in the headwaters of the Flinders, Cloncurry and Corella Rivers. General heavy rainfall events can develop from cyclonic influences in the Gulf of Carpentaria which cause widespread flooding, particularly in the lower reaches below Canobie. Flood peak height and travel times downstream of Cloncurry may also be impacted from rainfall influences in the Gulf or breakout flow from or to neighbouring floodplains.
Previous Flooding
Previous flood information for the Flinders Rivers is well documented. The towns of Hughenden, Richmond and Cloncurry have extensive peak height records dating back around 50 years.
In February 2019, a slow-moving monsoon trough with an embedded tropical low, resulted in prolonged record rainfall event in parts of northern and northwestern Queensland. Areas around Hughenden, Richmond, Julia Creek and Cloncurry recorded 7 to 10-day rainfall totals of 400 to 800 mm. Many locations received well over their average annual rainfall in less than a week and numerous long-standing daily and weekly rainfall and flood records were broken. Widespread major flooding across the region also resulted in massive livestock losses, and prolonged isolation of communities and the complete inundation of many properties throughout the catchment.
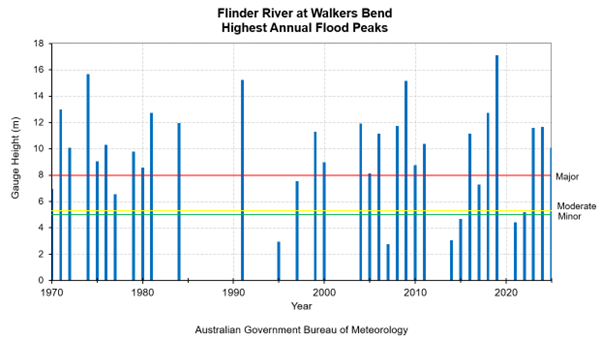
More recently significant flooding with moderate to major flood level peaks were observed on the lower reaches of the Flinders River downstream of Cloncurry in 2023, 2024, 2025.
In late December 2025 and early January 2026, a slow moving tropical low embedded in the monsoon trough brought a prolonged period of widespread heavy to intense rainfall to parts of northwestern and northern interior Queensland. Record 7-day rainfall accumulations were recorded at several locations between December 23 and 29 2025. Rainfall amounts of 200 to 400 were recorded in the far northwest of the state including across the lower Flinders catchment. Totals of 150 to 300 mm were observed across the upper catchment regions during this period.
This rainfall led to major flood peaks in Cloncurry, Richmond and Julia Creek. Flooding caused significant stock losses, estimated at over 100,000 cattle. Many roads were closed cutting access to many communities including Normanton, Karumba, Burketown, Julia Creek and Winton. The Flinders Highway and Great Northern Railway suffered prolonged closures and damage. Cloncurry Airport was significantly damaged.
Previous flooding events
| Flood Event | Hughenden Post Office (m) | Richmond (m) | Cloncurry (m) | Julia Creek (m) | Walkers Bend (m) |
| Feb 1944 | 3.66 | **9.75 | - | - | - |
| Jan 1946 | 5.03 | **10.06 | - | - | - |
| Jan 1951 | 2.90 | **10.47 | - | - | - |
| Mar 1955 | 2.90 | **11.43 | - | - | - |
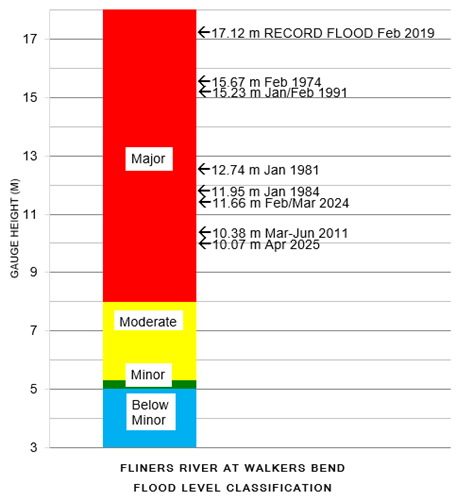
| Jan/Feb 1974 | 2.05 | 8.47 | 6.99 | 5.43 | 15.67 |
| Jan 1981 | 2.60 | 7.80 | 5.70 | - | 12.74 |
| Jan/Feb 1984 | 2.10 | 8.40 | 6.30 | 3.16 | 11.95 |
| Jan/Feb 1991 | 3.90 | 7.50 | 8.12 | 4.82 | 15.23 |
| Mar 1997 | - | - | 10.01 | 3.52 | - |
| Jan/Feb 2009 | 2.90 | 8.21 | 8.03 | 3.98 | 15.06 |
| Mar/Jun 2011 | 4.30 | 5.10 | 9.20 | 3.34 | 10.38 |
| Feb 2019 | 3.60 | 9.81 | 6.75 | 5.03 | 17.12 |
| Feb/Mar 2023 | *1.39 | - | 3.62 | 3.72 | 11.61 |
| Feb/Mar 2024 | *1.58 | 6.78 | 4.35 | - | 11.66 |
| Feb/Apr 2025 | - | 8.22 | 4.06 | 3.18 | 10.07 |
| Dec 2025/Jan 2026 | 3.83 | 9.92 | 5.16 | 4.88 | 16.22 |


Further Information:
- Latest rainfall and river heights
- For information on the flood warning service for the Flinders River: Queensland Service Level Specification
- Catchment map: Queensland Flinders, Morning Basins map
- National Arrangements for Flood Forecasting and Warning