


This brochure describes the flood risk and previous flooding in the Georgina River and Eyre Creek catchment.
Last Updated: June 2026
Flood Risk
The vast Georgina River and Eyre Creek system drains an area of approximately 210,000 square kilometres. It rises to the northwest of Mount Isa with three main tributaries: the Buckle, Sander, and Ranken Rivers. The latter two have their headwaters in the Northern Territory. Further inflow enters the system from numerous creeks and rivers, with the two main tributaries being the Burke and Hamilton Rivers. The Burke River drains the area to the north of Boulia and enters the Georgina River about 20 kilometres upstream of Marion Downs, whilst the Hamilton rises to the northeast of Boulia and enters the main Georgina River downstream of Marion Downs. The Georgina River turns into Eyre Creek at of Glengyle. Towns located within the catchment include Urandangi, Dajarra, Boulia, and Bedourie.
The Georgina River and Eyre Creek river is notable as it is an endorheic system, flowing not the ocean but rather into the interior of the continent before eventually evaporating.
Very little rainfall is needed to bring the country to a standstill. Following widespread or heavy rain, the main channel fills fairly quickly and then spreads out into the neighbouring channels and floodplain for kilometres on either side. In the event of severe flooding, the Georgina River can vary in width in the upper reaches from 15 to 20 kilometers, and in the lower reaches it is estimated in some sections to be 25 to 30 kilometers wide.
The main impact of flooding is the isolation of towns and properties and the extensive inundation of grazing lands which can last several months in some areas. Road transport disruption for long periods is common during flood events.
Major flooding requires a large-scale rainfall event over the Georgina River and Eyre Creek catchment. The following can be used as a rough guide to the likelihood of flooding in the catchment:
75 mm in 24 hours over isolated areas, with lesser rains of 50 mm over more extensive areas will cause stream rises and the possibility of minor flooding. If lesser rainfalls have been recorded in the previous 24 to 72 hours, then moderate to major flooding may develop.
100 mm in 24 hours will cause isolated flooding in the immediate area of the heavy rain.
Generally, 100 mm or heavier falls in 24 hours over a wide area will most likely cause major flooding in the middle to lower reaches of the Georgina, Burke and Hamilton Rivers extending into Eyre Creek, downstream of Marion Downs.
Previous flooding
Flooding in the Georgina River is generally associated with widespread rainfall events over northern and central Queensland and the Northern Territory. The highest recorded flood peaks occurred in late January and early February of 1974. The more recent 2023 and 2025 floods resulted in evacuations and long isolation periods due to the flooding of transport routes. Flooding in 2023 was particularly severe at Urandangi, with flood waters rising well above any previous flooding and entirely inundating the town.
In late December 2025, a slow moving tropical low embedded in the monsoon trough brought a prolonged period of widespread heavy to intense rainfall to parts of northwestern and northern interior Queensland. This was followed by prolonged monsoon activity in January 2026, along with tropical low incursions inland resulted in further heavy rainfall across the catchment region. A major flood peak of observed at 5.40 metres was observed at Marion Downs 17 January 2026.
During late February and March 2026, renewed bursts of monsoon activity across northern Queensland combined with embedded tropical lows moving through interior Australia brought further bouts of heavy rainfall across the catchment region, particularly in parts of the upper catchment that lie in the Northern Territory. Cluny recorded it highest daily rainfall on record with a total of 196 mm on February 26 2026, culminating in a monthly total of 309.7 mm and its wettest February on record. Curiously, despite record rainfall and flooding on the Northern Territory side of the border from this event, this didn't lead to record flooding once the waters moved further downstream into Queensland.
Following this rainfall, already saturated soils and swollen rivers resulted in a major protracted flood event across the region, with road networks cut and communities including Bedourie isolated for many months.
The table below summarises the flood history of the Georgina River and Eyre Creek basin - it contains the flood gauge heights of the more significant recent floods.
Previous flooding events
| Flood Event | Urandangi | Roxborough Downs | Glenormiston | Boulia | Marion Downs | Bedourie | Cluny | Glengyle |
| January/February 1974 | 7.45* | 9.80 | 8.89 | 5.96 | 7.42 | 6.82* | 6.40 | 6.45 |
| February/March 1977 | 7.32 | 9.93 | 8.78 | 5.35 | 6.91 | - | 5.70 | 5.74 |
| February/March 1991 | 3.75 | - | 4.95 | 4.40 | 6.20 | - | 5.50 | 5.15 |
| March 1997 | 7.30 | - | 8.15 | 5.70 | 6.65 | - | 5.90 | 5.65 |
| December 2000/January 2001 | 6.00 | - | 7.00 | 5.40 | 6.21 | - | 5.40 | 5.13 |
| January 2007 | 4.70 | 8.72 | 6.70 | 3.16 | 5.95 | 5.40 | 4.60 | 4.40 |
| Jan 2009 | 6.85 | 9.22 | 7.50 | 5.26 | 6.15 | 5.38 | 5.50 | 5.25 |
| Mar 2011 | 5.70 | 8.63 | 6.50 | - | 5.80 | 5.68 | 5.25 | 4.85 |
| March/April 2023 | 7+ | 9.60 | 8.20 | 3.83 | 6.75 | 5.35 | 5.40 | 5.15 |
| March/April 2025 | - | 7.71 | 5.40 | 4.94 | 5.45 | 4.73 | 4.67 | 4.20 |
| January 2026 | 3.61 | 9.09 | 5.85 | 3.34 | 5.40 | 4.40 | - | - |
| FebruaryMarch 2026 | 4.78 | 8.90 | 7.80 | 4.20 | 6.65 | 5.20 | 5.45 | 5.10 |
All heights are in metres on flood gauges.
* This height was obtained from a surveyed flood mark
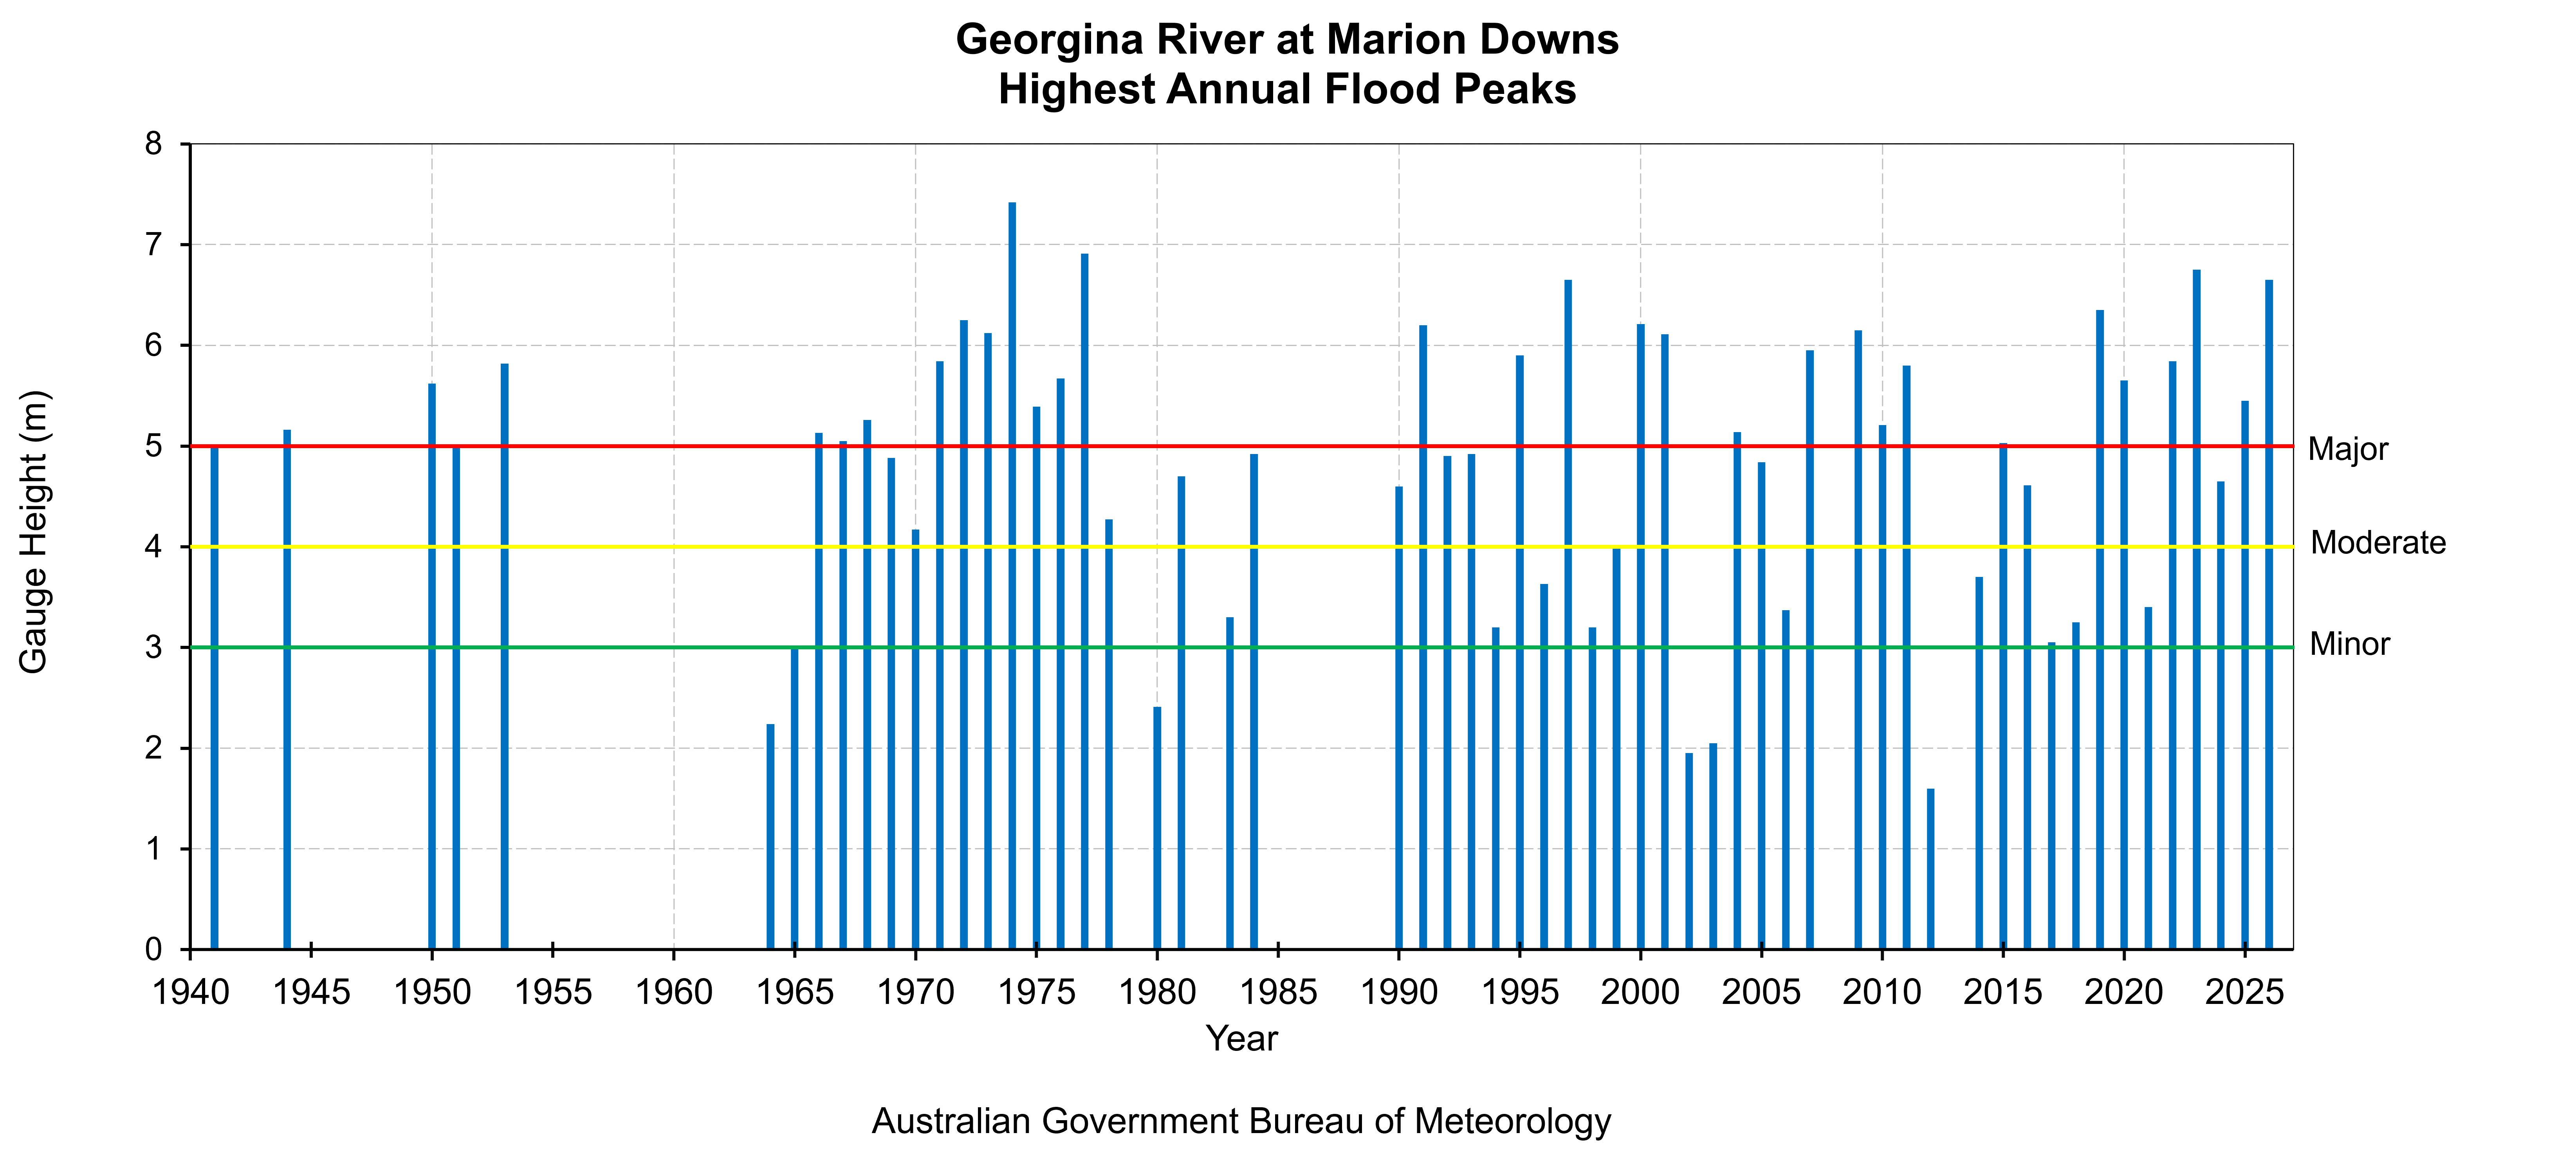
Chart shows flood level classification of recorded flood gauge height observations of the Georgina River at Marion Downs.
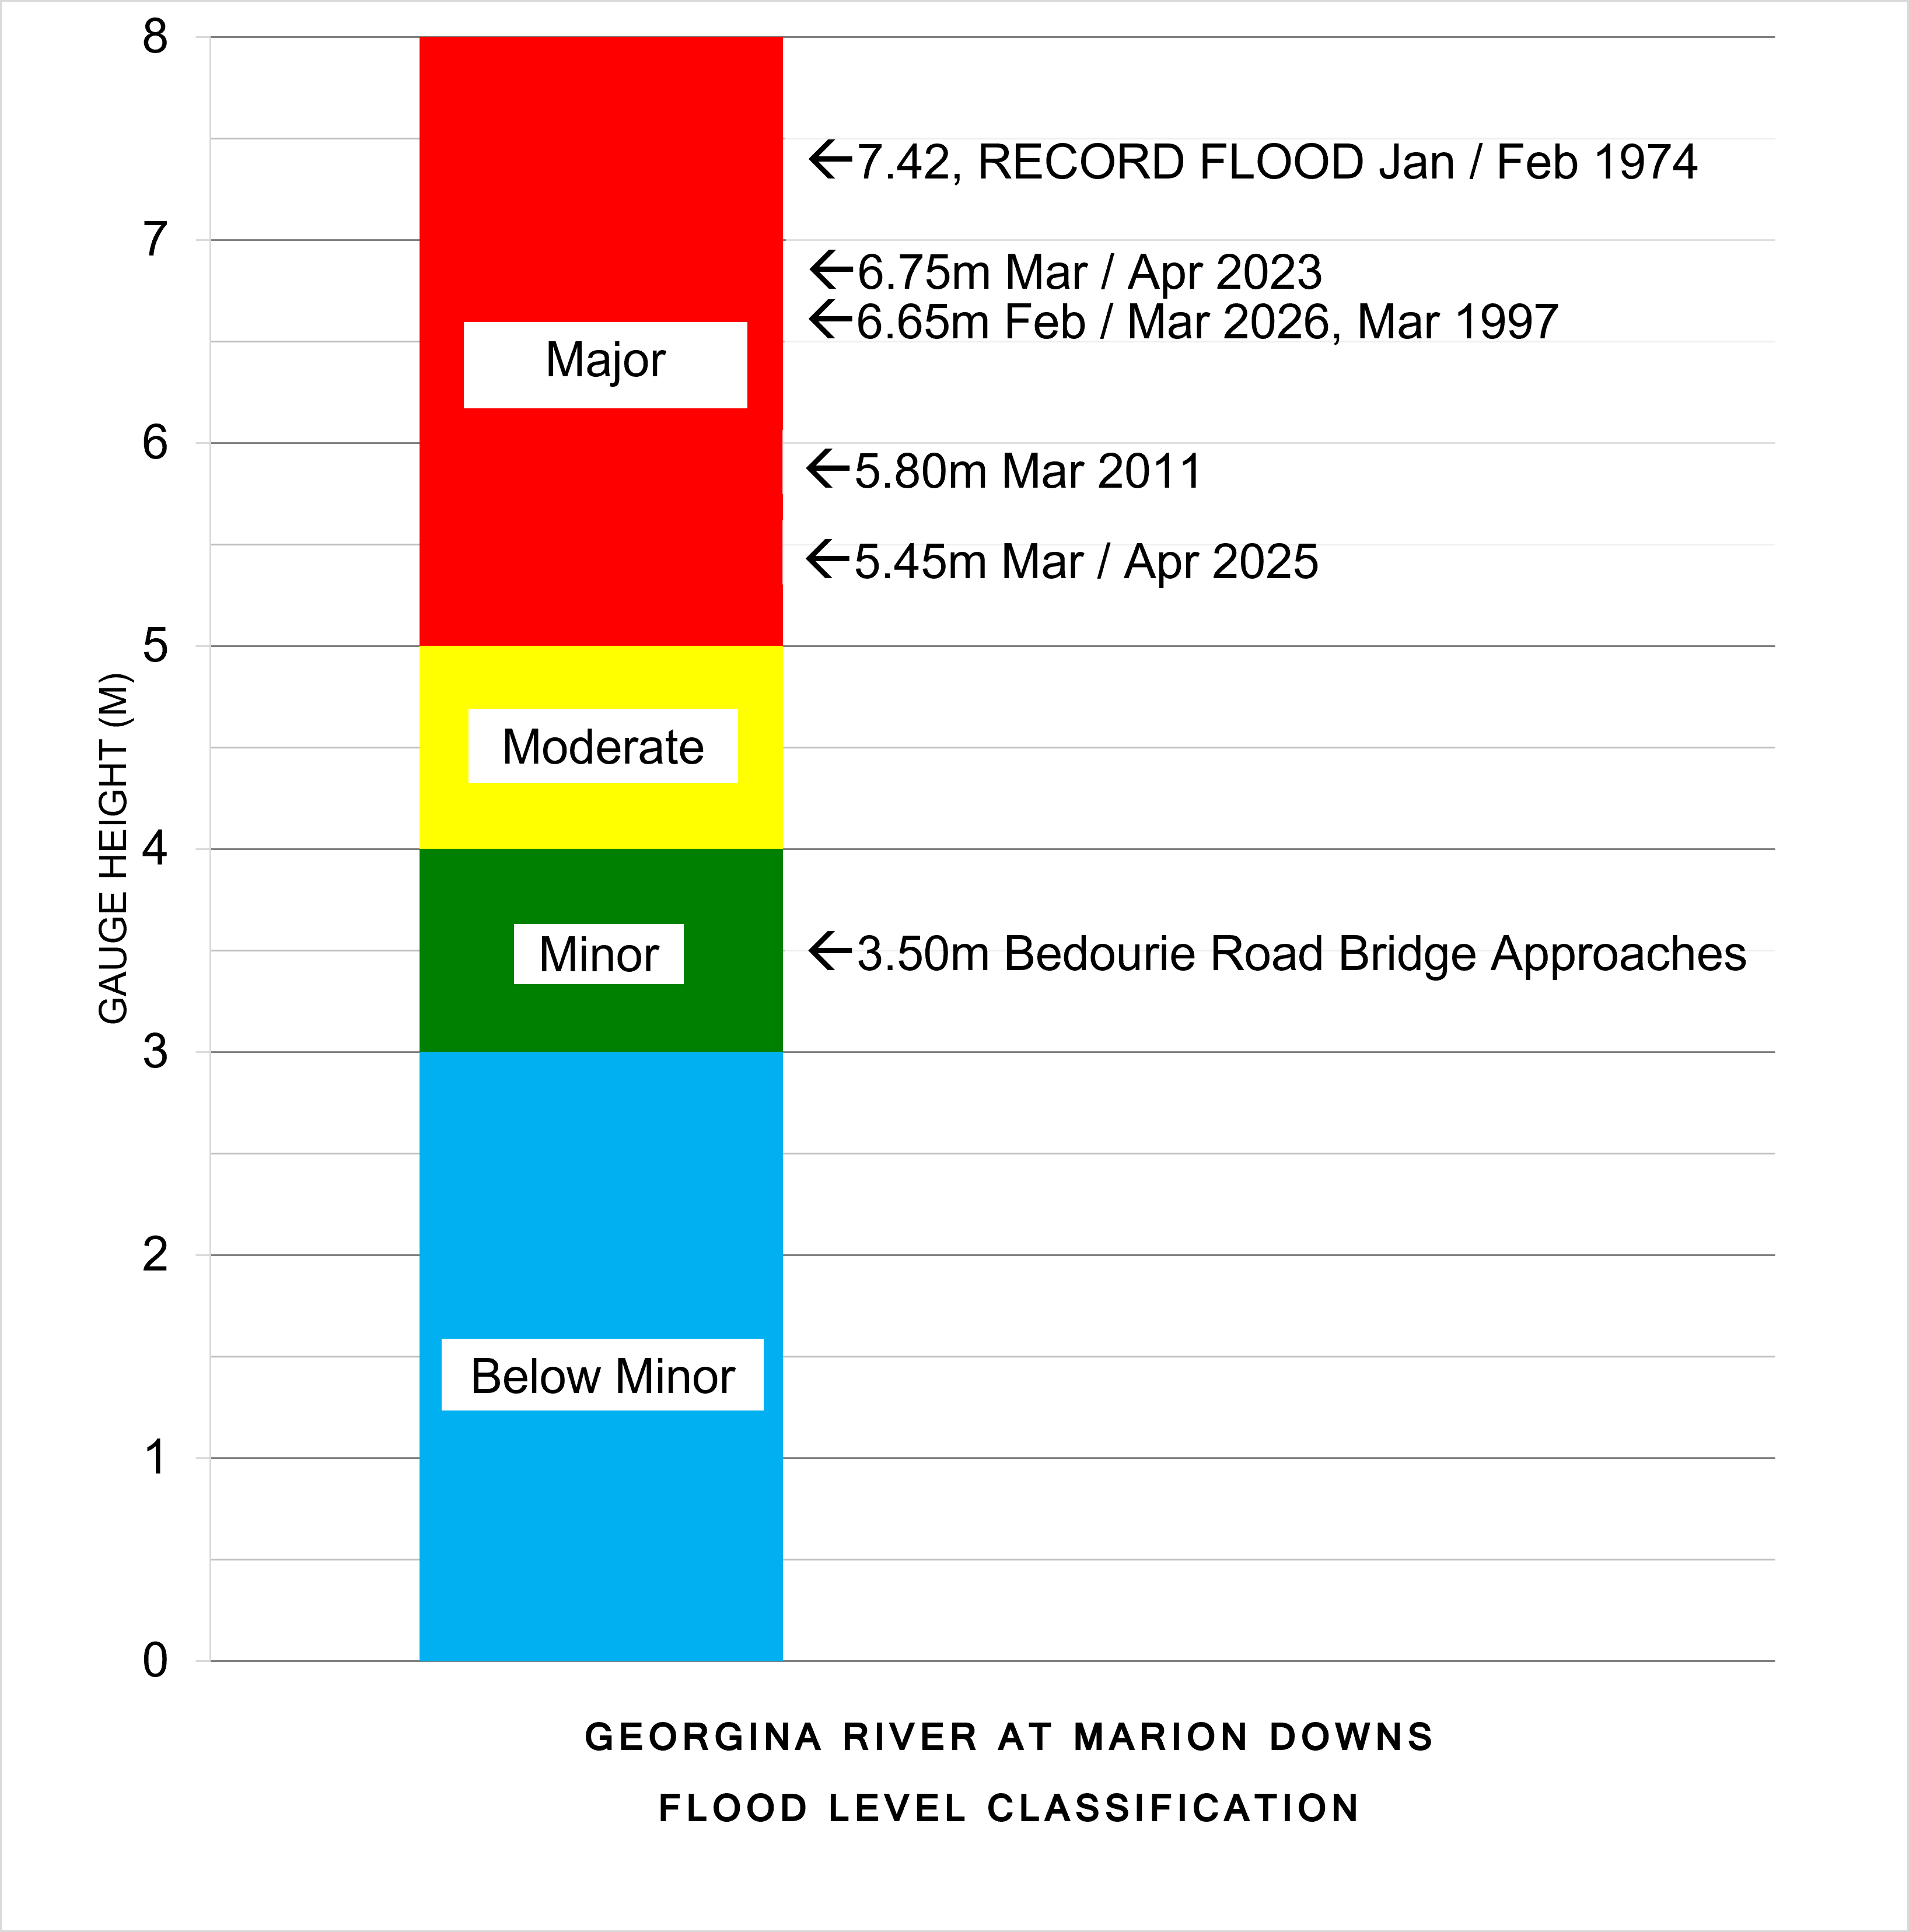
The totem pole shows flood level classification and associated impacts related to local reference sites, along with recorded flood gauge height observations of notable flood events that have occurred on the Georgina River at Marion Downs.
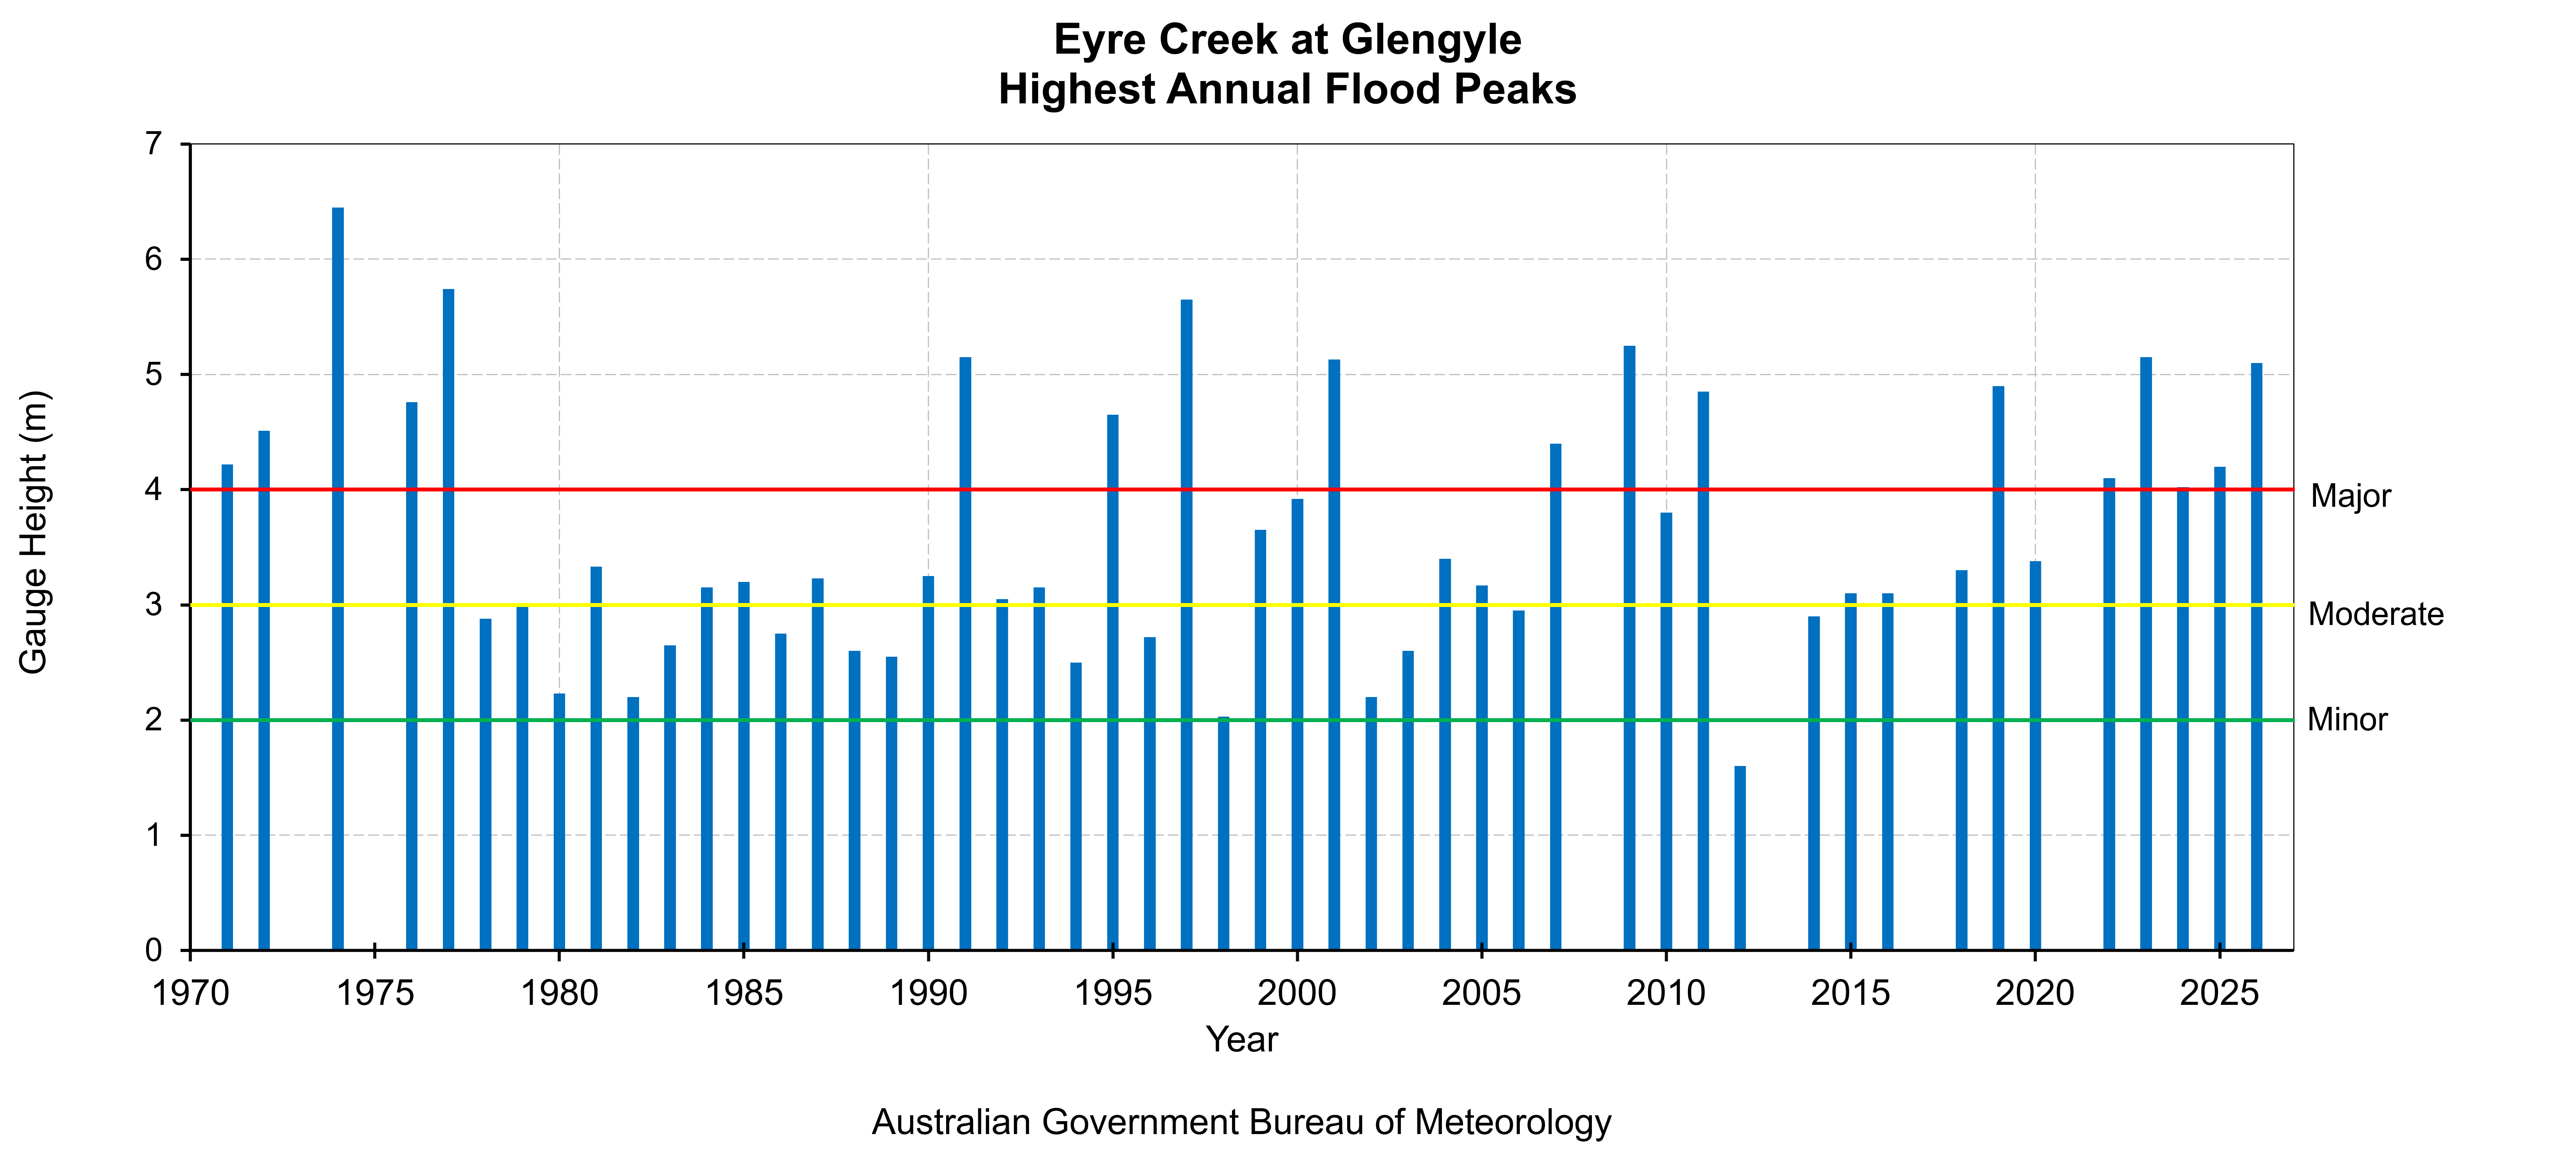
Chart shows flood level classification of recorded flood gauge height observations of the Eyre Creek at Glengyle.
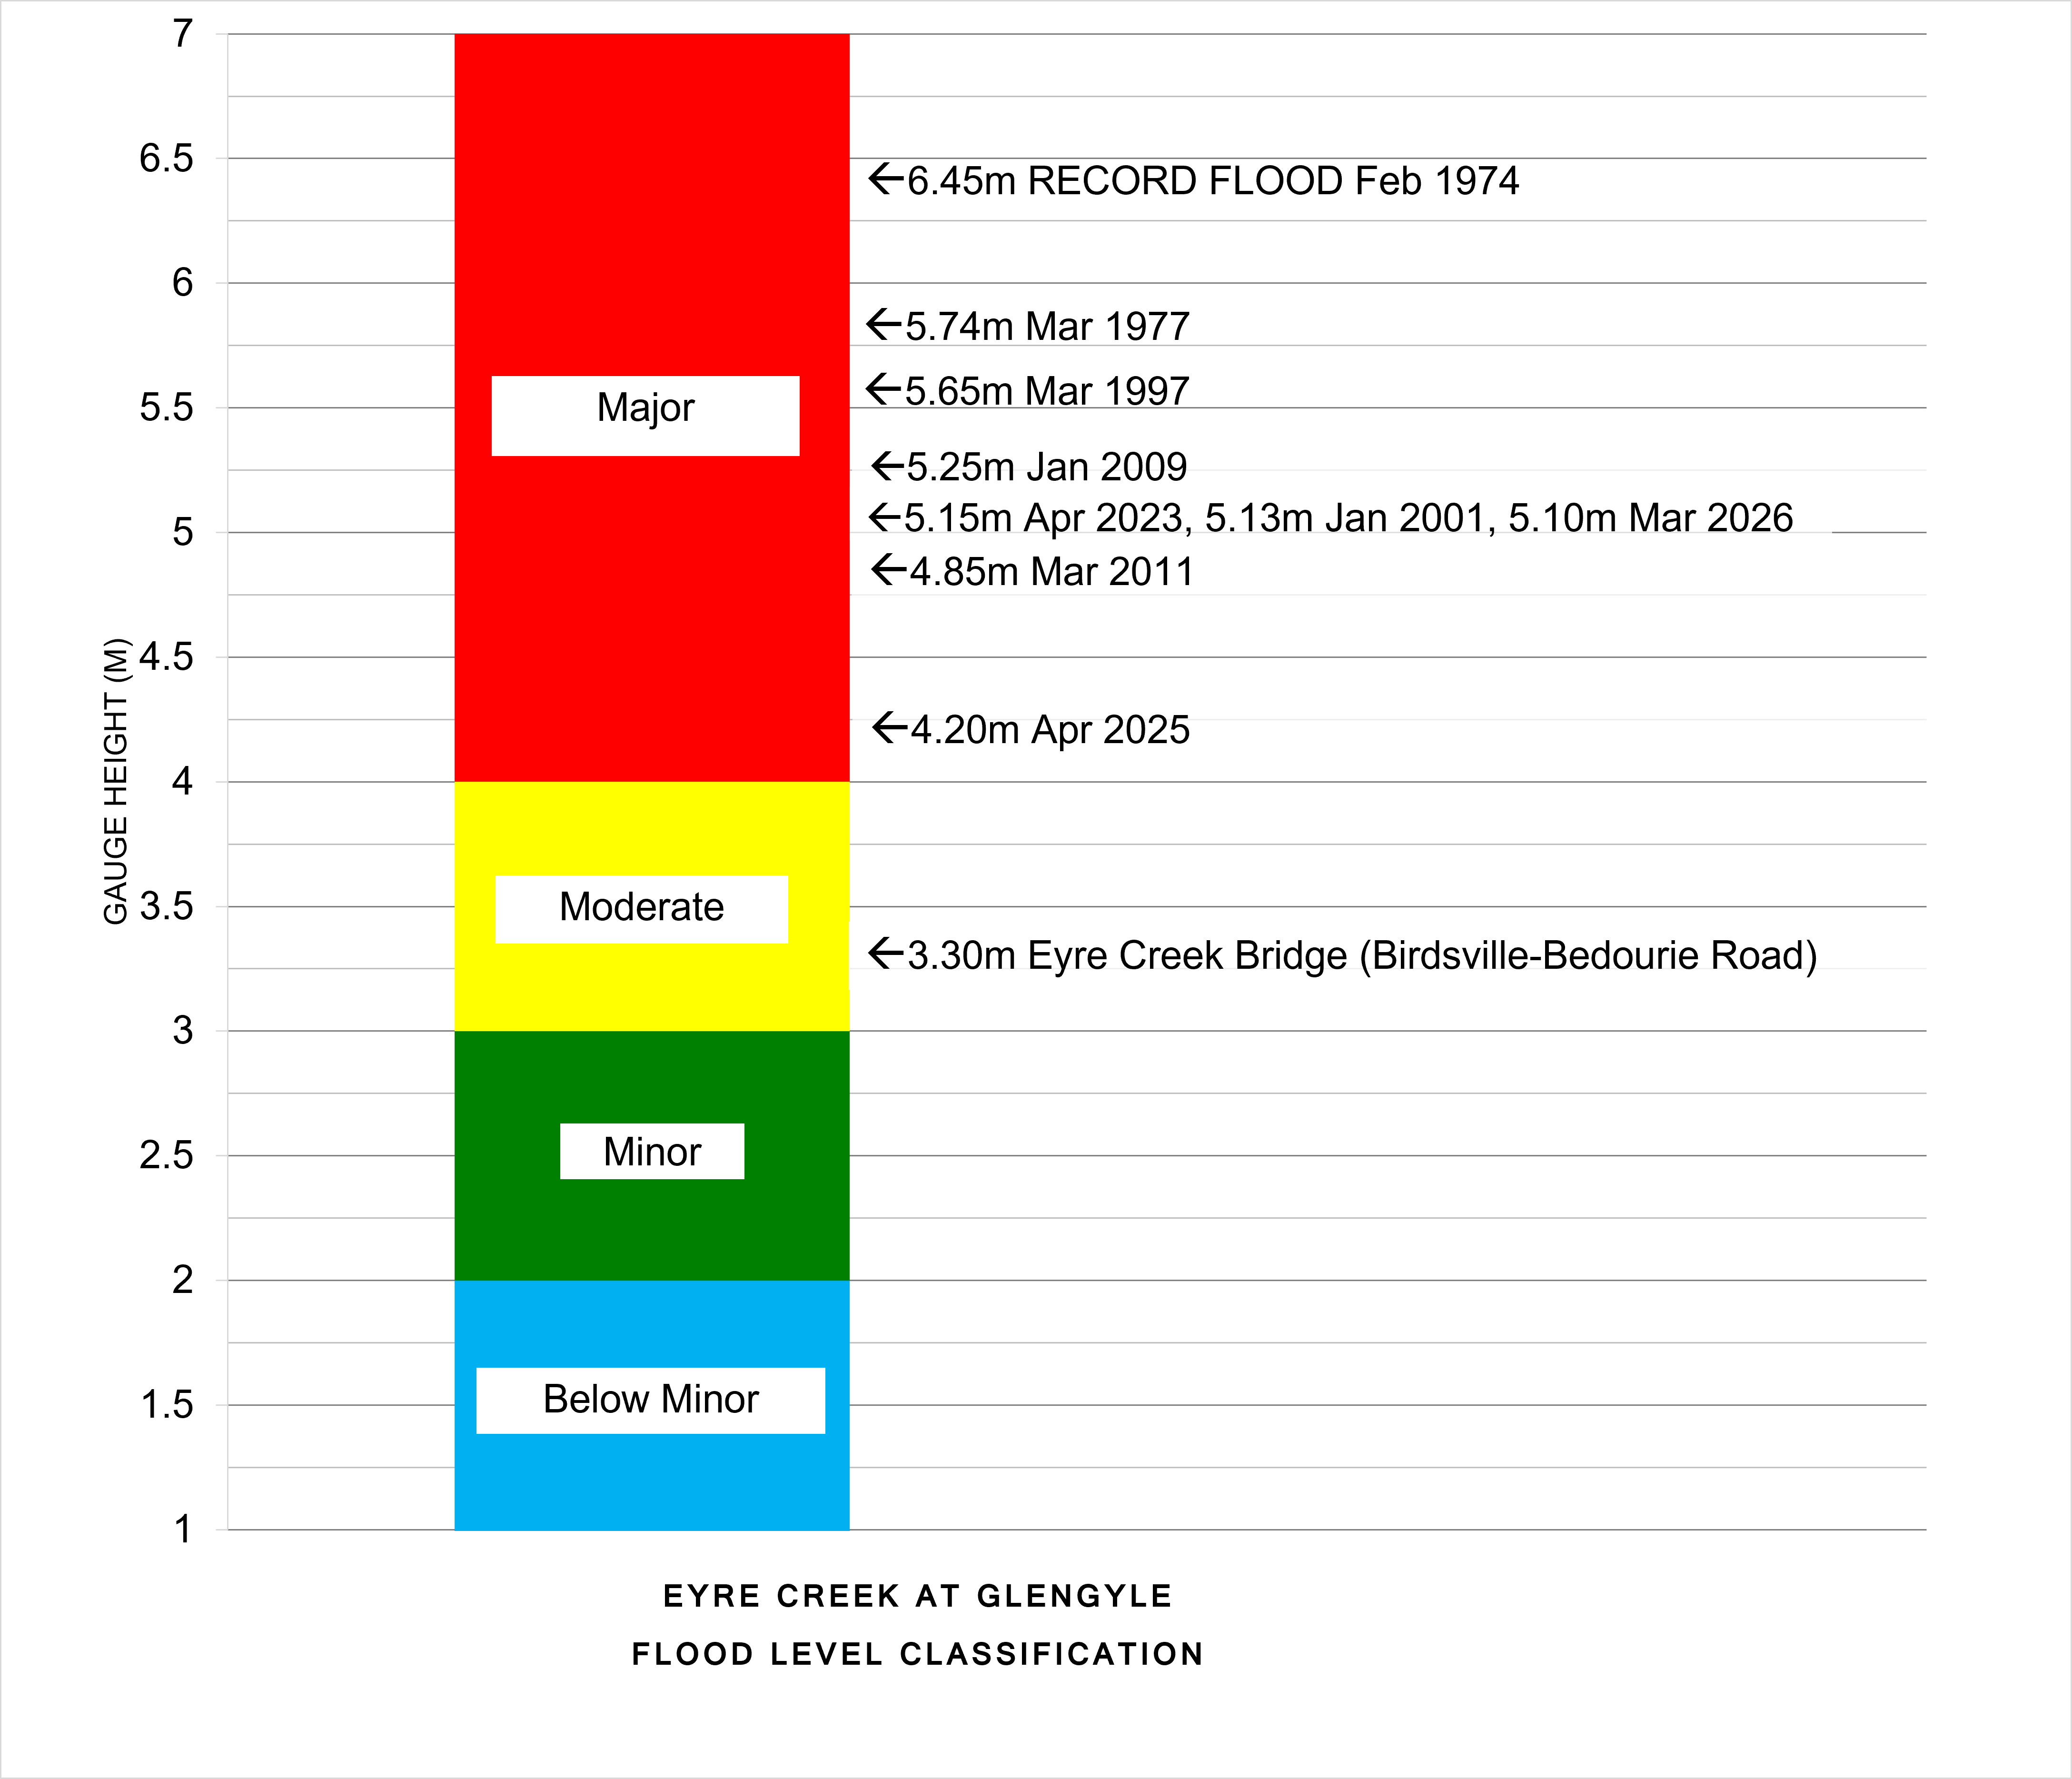
The totem pole shows flood level classification and associated impacts related to local reference sites, along with recorded flood gauge height observations of notable flood events that have occurred on the Eyre Creek at Glengyle.
Further Information:
- Latest rainfall and river heights
- Flood warning service for the Georgina River and Eyre Creek: Queensland Service Level Specification
- Catchment map: Georgina and Eyre Creek Basin map
- National Arrangements for Flood Forecasting and Warning