


This document describes the flood risk and previous flooding in the Pioneer River catchment.
Last
updated: July 2026.
Flood Risk
The Pioneer River has a catchment area of about 1500 square kilometres and lies between the headwaters of the Fitzroy and Burdekin Rivers. The river flows in an easterly direction from the Clarke Range and Connors Range to the sea. Very high rainfalls can occur along the ranges and cause rapid stream rises in Black and Cattle Creeks which feed into the Pioneer River. The Pioneer catchment responds very quickly to heavy rainfall and flash flooding occurs frequently along Cattle Creek at Finch Hatton. Under extreme flow situations, flood water can break out between Mirani and Marian and flow into the Sandy Creek. Peak travel times generally range from 3 - 6 hours from Mirani to Mackay.
The City of Mackay is at significant risk of flooding, with several thousands of properties at risk during a major event. Although the town of Mackay has an extensive levee system which offers some protection for small to medium floods, large floods will still cause extensive town flooding.
The lower reaches of the Pioneer River are prone to storm surge effects during cyclones, and flooding at Mackay and near the river mouth is significantly dependent on the tide height at the time.
Previous Flooding
The Pioneer River has a well-recorded flood history with documented evidence of flooding as far back as 1884. Since that time, several significant floods have occurred, including 1918, 1958, and 2017.
The highest flood peak recorded along the Pioneer River at Mackay (Forgan Bridge) is 9.14 m in February 1958.
The February 2008 flooding at Mackay was caused by intense local rainfall, with the river peaking at only 7 m, but significant flash flooding occurring along Gooseponds Creek. Around 600 mm of rainfall was recorded in approximately six hours in the Gooseponds Creek catchment, resulting in damage to over 4000 residences.
In March and April 2017, rainfall associated with ex-Tropical Cyclone Debbie resulted in major flash flooding along Plane Creek. Finch Hatton, Whitefords, Sarich's, Mirani Weir, and Dumbleton Rocks all experienced major flooding. Mackay peaked at 7.4 m (just over the minor flood level of 7 m at the time; the minor flood level has since been updated to 6.3 m), while Gargett and Hospital Bridge peaked at moderate flood levels.
From 2017 to 2025, mainly minor to moderate flood level events have occurred in the Pioneer River catchment. The most significant of which occurred in 2024, when a peak river level height of 7.12 metres was observed at Mackay and above the moderate (6.90 m) level threshold.
In January 2026, Tropical Cyclone Koji crossed the coast between Ayr and Bowen on Sunday morning 11 January, before moving inland and weaken over the following days across inland northern and central Queensland. 24 hours rainfall totals from midday on Saturday 10 of January to midday on Sunday 11 of January of 150 to 250 mm were recorded across the lower Pioneer catchment and around Mackay, with falls of 250 to 550 mm recorded across the upper reaches of catchment and about the Clarke Ranges. Intense rainfall with 3 to 6 hourly totals of 150 to 330 mm were also recorded in the upper catchment on Sunday morning, which resulted in rapid river rises and significant flash flooding around Finch Hatton, impacting roads and properties in the area.
Previous flooding events
| Flood Event | Finch Hatton | Mirani** | Marian Weir | Dumbleton Rocks | Hospital Bridge | Mackay |
| January 1918 | - | 14.33* | - | - | 11.84* | 8.86* |
| February 1958 | - | 16.46* | - | - | 11.64* | 9.14* |
| January 1970 | - | 14.02 | - | - | 11.84* | - |
| January/February 1978 | - | 10.60 | 11.66 | - | - | 7.80 |
| February 1979 | - | 10.85 | 12.07 | - | - | 8.00 |
| January 1980 | 3.50 | 11.00 | 12.74 | - | - | 7.60 |
| April 1989 | 6.00 | 13.20 | 15.52 | 19.45 | - | 7.80 |
| December 1990 | 5.85 | 10.40 | 12.32 | 17.77 | 11.84 | 7.60 |
| January/February 1991 | 3.85 | 11.10 | 12.31 | 17.29 | - | 7.40 |
| February-April 2000 | 5.80 | 9.50 | 10.19 | 19.30 | 8.95 | 6.85 |
| January/February 2008 | 3.64 | - | 11.29 | 19.58 | 9.95 | 7.00 |
| December 2010 | 5.30 | - | 11.06 | 19.41 | - | 7.05 |
| January-March 2011 | 4.85 | - | 12.11 | 19.75 | 9.12 | 6.40 |
| March 2012 | 5.25 | - | 10.21 | - | - | - |
| March 2017 | 5.26 | - | 12.49 | 21.20 | 10.60 | 7.40 |
| January/February 2023 | 6.22 | - | 10.60 | - | - | 6.73 |
| March 2024 | - | - | - | - | - | 7.12 |
| February 2025 | 4.33 | 7.48 | - | 22.50 | - | 6.64 |
| January 2026 | 7.28 | 11.56 | 12.83 | 19.47 | 8.30 | 6.15 |
All heights are in metres on flood gauges.
*Manual observation that may not represent the exact peak height
**Observations after the year 2001 at Mirani are from the automatic gauge and may not be directly comparable with observations before then
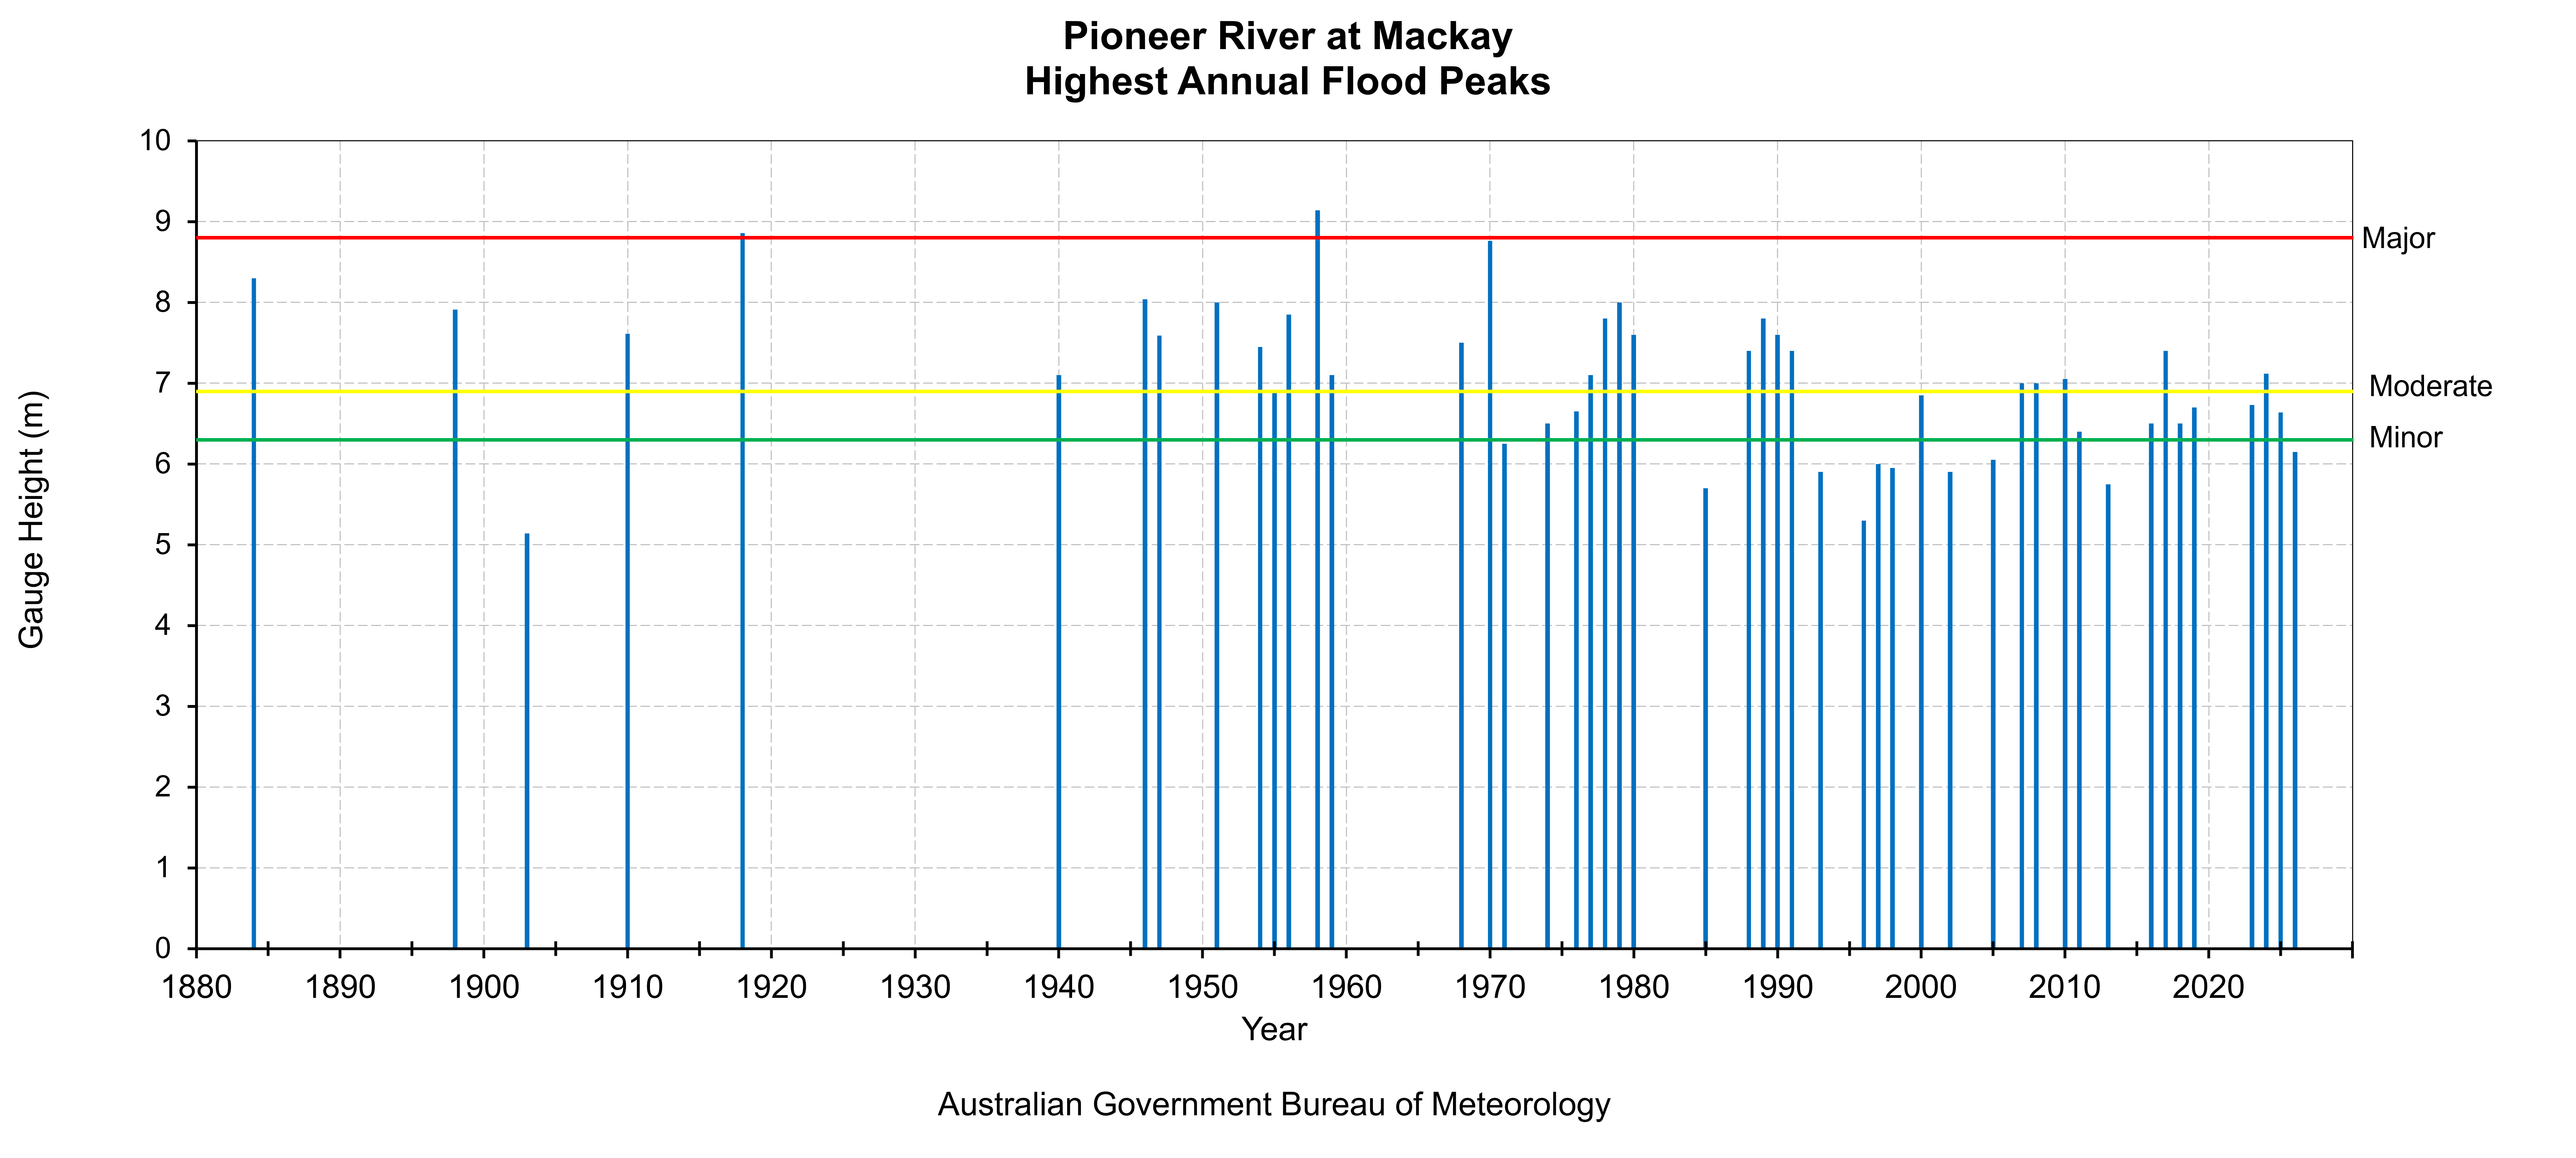
This chart shows flood level classification of recorded flood gauge height observations of the Pioneer River at Mackay.
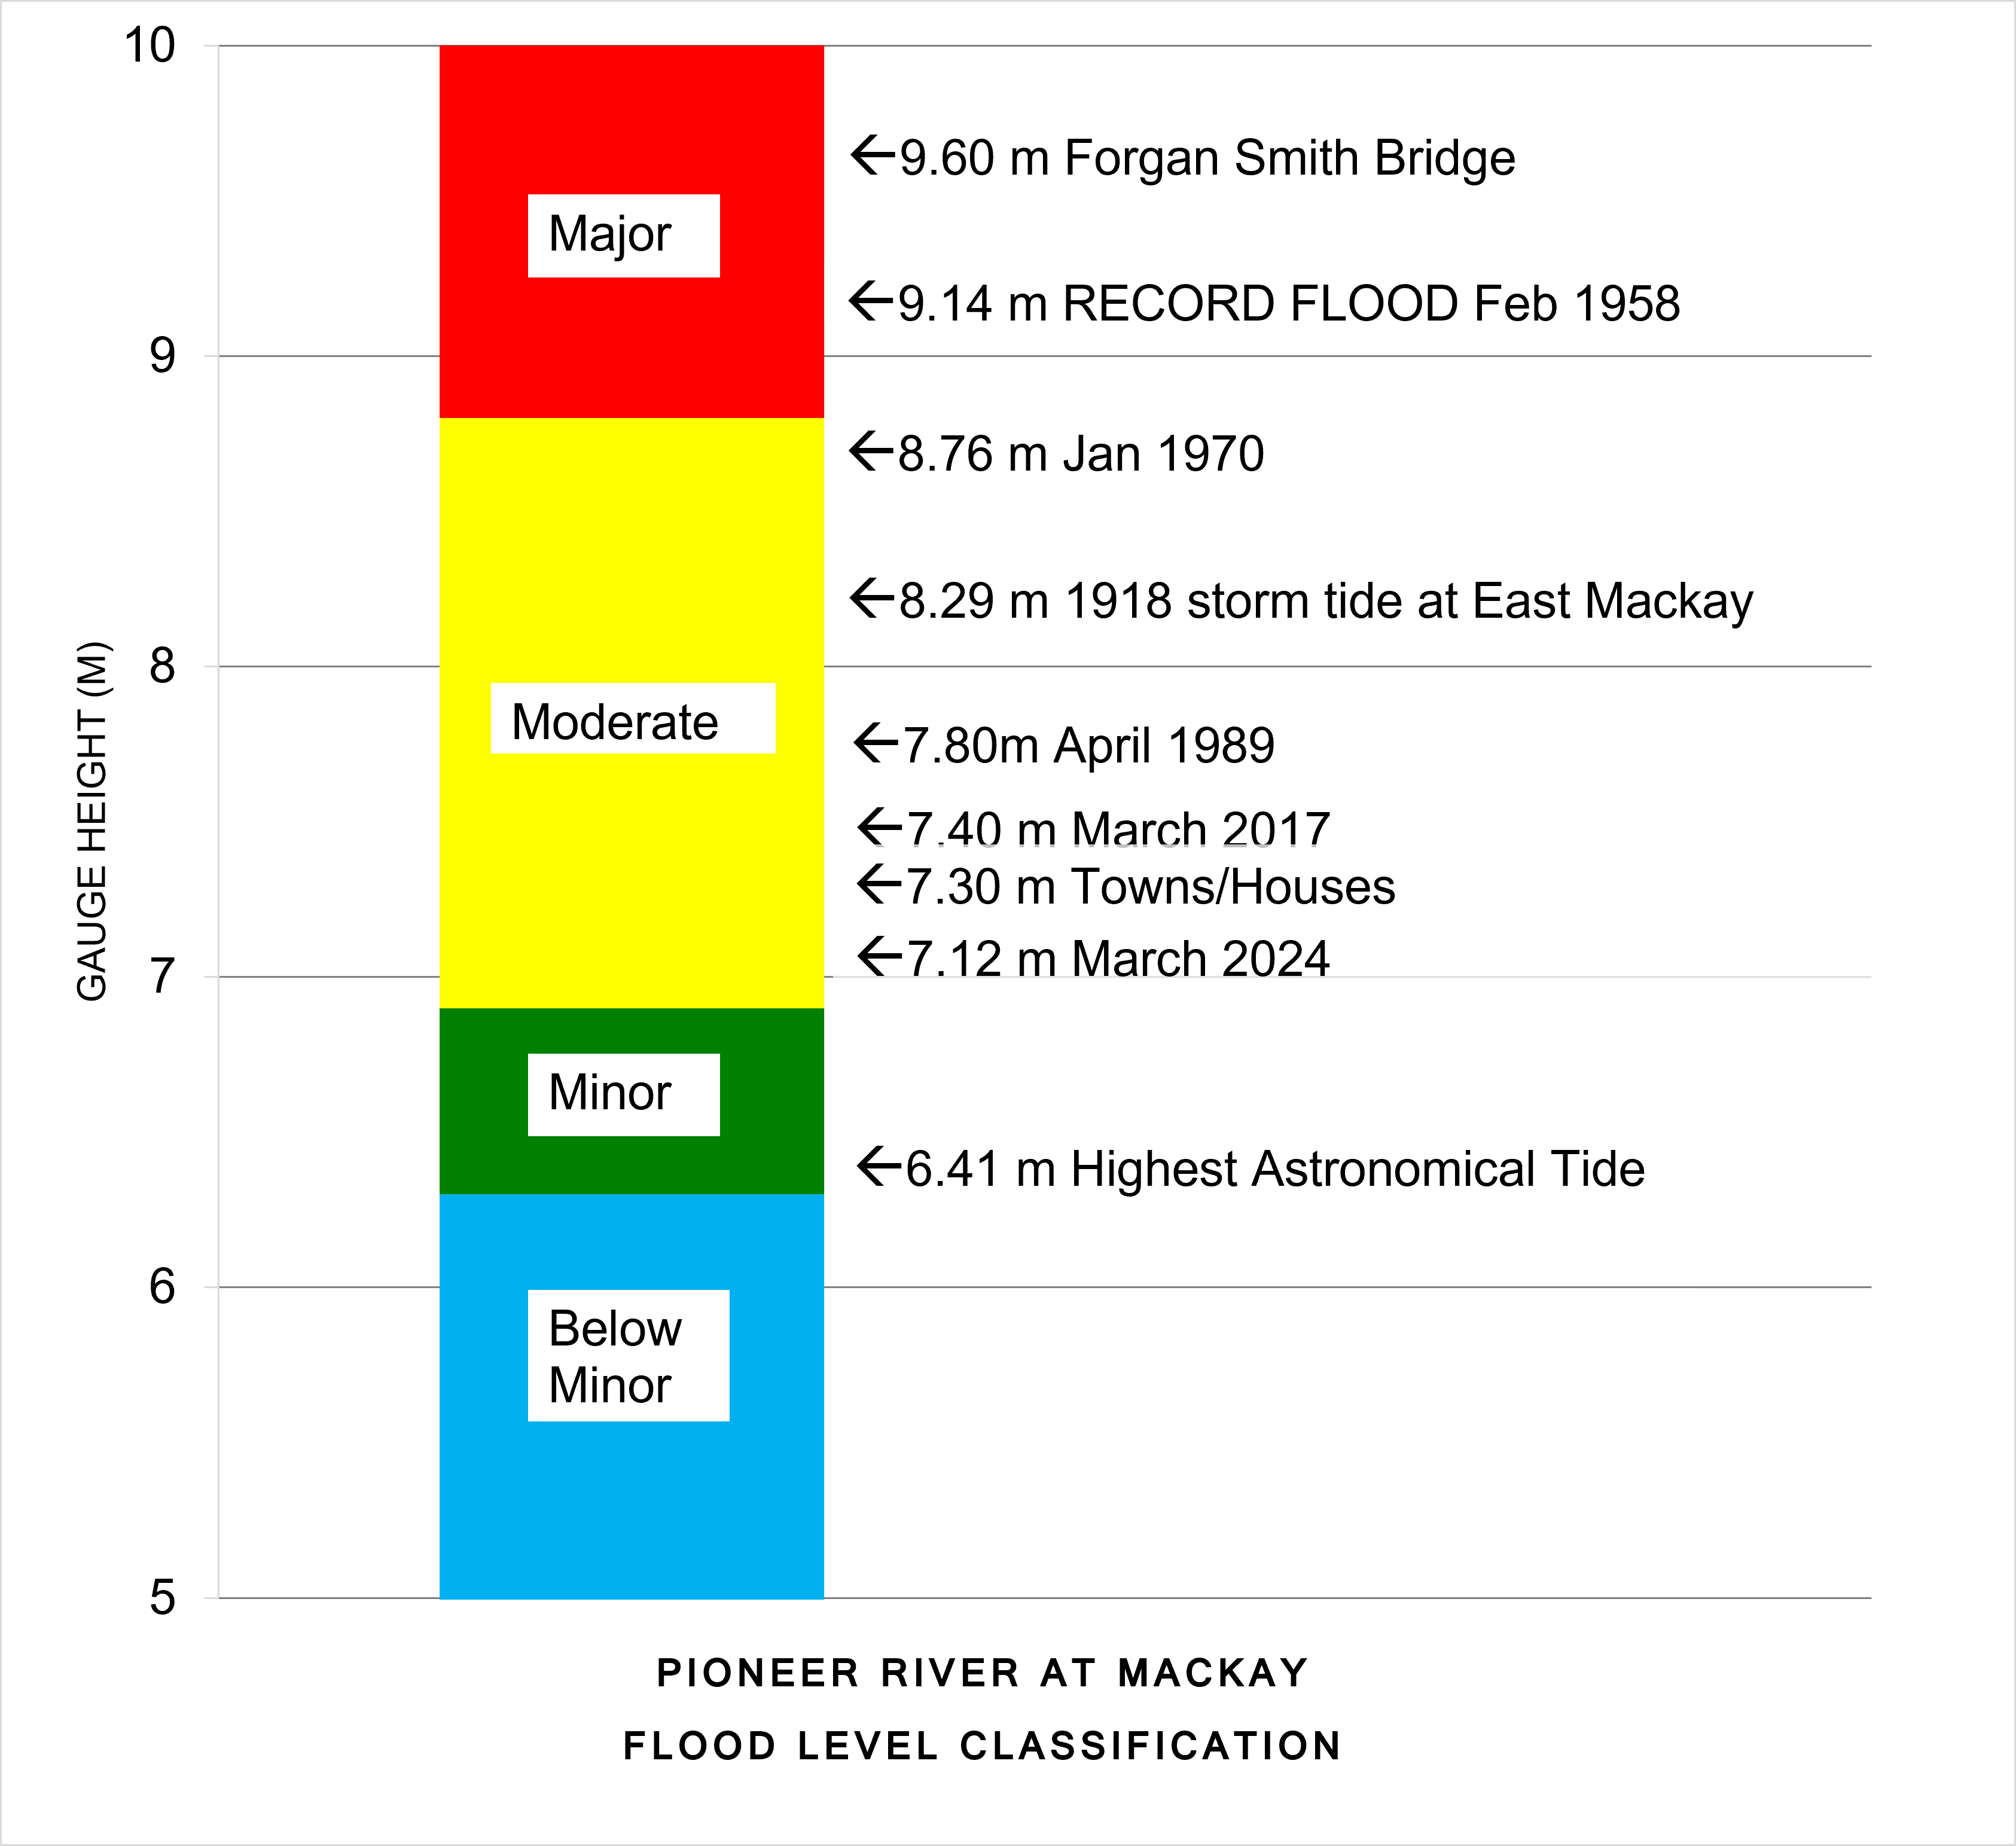
The totem pole shows flood level classification and associated impacts related to local reference sites, along with recorded flood gauge height observations of notable flood events that have occurred on the Pioneer River at Mackay.
Further Information:
- Latest rainfall and river heights
- Flood warning service for the Pioneer River: Queensland Service Level Specification
- Catchment map: Pioneer Catchment map
- National Arrangements for Flood Forecasting and Warning