

The Bureau of Meteorology and CSIRO play an important role in monitoring, analysing and communicating observed and future changes in Australia’s climate.
This eighth biennial State of the Climate report draws on the latest national and international climate research, encompassing observations, analyses and future projections to describe year-to-year variability and longer-term changes in Australia’s climate. The report is a synthesis of the science that underpins our understanding of Australia’s climate. It is intended to inform economic, environmental and social decision-making by governments, industries and communities.
Observations, reconstructions of past climate and climate modelling continue to provide a consistent picture of ongoing, long-term climate change interacting with underlying natural variability. Associated changes in weather and climate extremes – such as extreme heat, heavy rainfall, coastal inundation, fire weather and drought – exacerbate existing pressures on the health and wellbeing of our communities and ecosystems. These changes in the weather and climate are happening at an increasing pace; the past decade has seen record-breaking extremes contributing to natural disasters that are exacerbated by anthropogenic (human-caused) climate change, including 'compound events', where multiple hazards and/or drivers occur together or in a close sequence, which intensifies their impacts.
These changes have a growing effect on the lives and livelihoods of all Australians. Australia must plan for, and adapt to, the changing nature of climate risk now and in the decades ahead. The severity of impacts on Australians and our environment will depend on the speed at which global greenhouse gas emissions can be reduced.
State of the Climate 2024
Key points: Australia
- Australia’s climate has warmed by an average of 1.51 ± 0.23 °C since national records began in 1910.
- Sea surface temperatures have increased by an average of 1.08 °C since 1900.
- The warming has led to an increase in the frequency of extreme heat events over land and in the oceans.
- In the south-west of Australia there has been a decrease of around 16% in April to October rainfall since 1970. Across the same region, May to July rainfall has seen the largest reduction, by around 20% since 1970.
- In the south-east of Australia, there has been a decrease of around 9% in April to October rainfall since 1994.
- Heavy short-term rainfall events are becoming more intense.
- There has been a decrease in streamflow at most gauges across Australia since 1970.
- There has been an increase in rainfall and streamflow across parts of northern Australia since the 1970s.
- There has been an increase in extreme fire weather, and a longer fire season, across large parts of the country since the 1950s.
- There has been a decrease in the number of tropical cyclones observed in the Australian region since at least 1982.
- Snow depth, snow cover and number of snow days have decreased in alpine regions since the late 1950s.
- Oceans around Australia are becoming more acidic, with changes happening faster in recent decades.
- Sea levels are rising around Australia, including more frequent extreme high levels that increase the risk of inundation and damage to coastal infrastructure and communities.

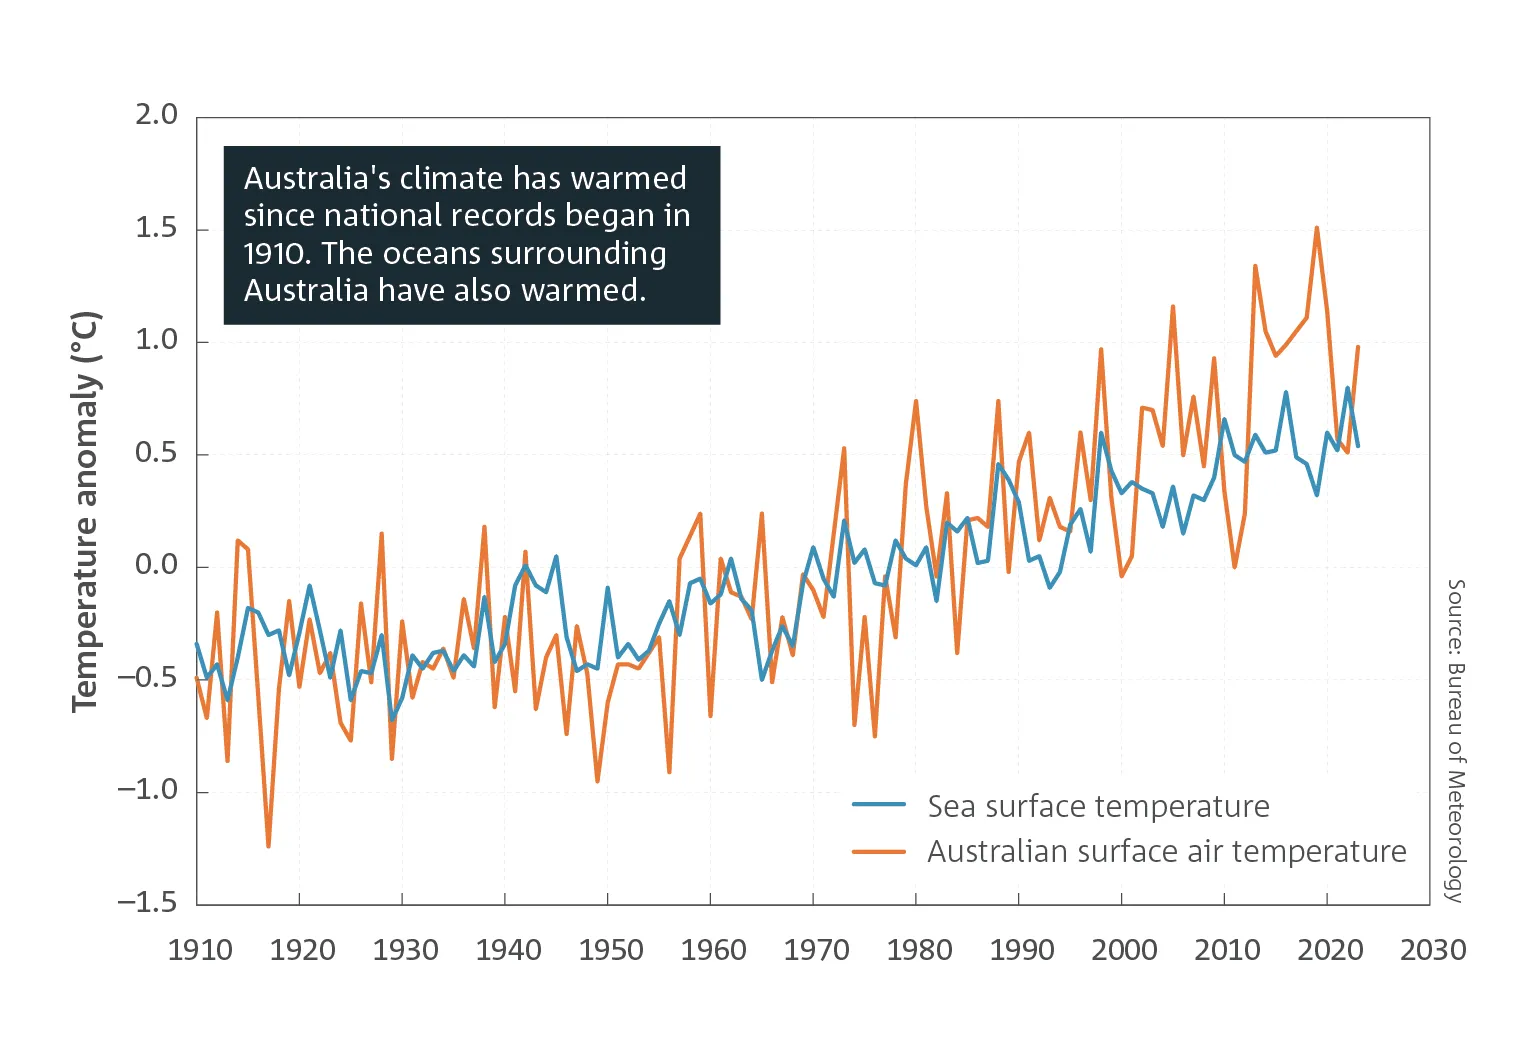
Anomalies (departures from the mean for the 1961–1990 standard averaging period) in annual mean sea surface temperature, and temperature over land, in the Australian region. Sea surface temperature values (data source: ERSST v5, www.esrl.noaa.gov/psd/) are provided for a region around Australia (4–46° S and 94–174° E).
Key points: Global
- Concentrations of all major long-lived greenhouse gases in the atmosphere continue to increase. Global annual mean carbon dioxide (CO2) concentrations reached 419.2 parts per million (ppm) in 2023 and the CO2 equivalent (CO2-e) of all greenhouse gases reached 524 ppm. These are the highest levels on Earth in at least 2 million years.
- Global fossil fuel CO2 emissions, the principal driver of the growth in CO2 concentrations, are continuing to increase. Overall anthropogenic CO2 emissions, including fossil fuel and land-use change emissions, have levelled off over the last decade after increasing for more than a century prior to the 2010s.
- In 2022 and 2023, the amounts of methane (CH4) and nitrous oxide (N2O), both greenhouse gases, in the atmosphere increased rapidly.
- Globally averaged air temperature at the Earth’s surface has warmed by about 1.2 °C since reliable records began in 1850. Each decade since 1980 has been warmer than the last, with 2011–20 being around 0.2 °C warmer than 2001–10. 2023 was the warmest year on record globally.
- The world’s oceans, especially in the Southern Hemisphere, have taken up more than 90% of the extra energy stored by the planet (as heat) arising from enhanced greenhouse gas concentrations.
- The ice sheets and ice shelves of Antarctica and Greenland are losing ice due to a warmer climate, and contributing to global sea level rise.
- There has been an abrupt decrease in Antarctic sea-ice extent since 2015, after a small increase over the period from 1979 to 2014.
- Around half of all CO2 emissions from human activities are absorbed by land and ocean sinks, which act to slow the rate of increase in atmospheric CO2.
- Global mean sea levels have risen by over 22 cm since 1900; half of this has occurred since 1970.

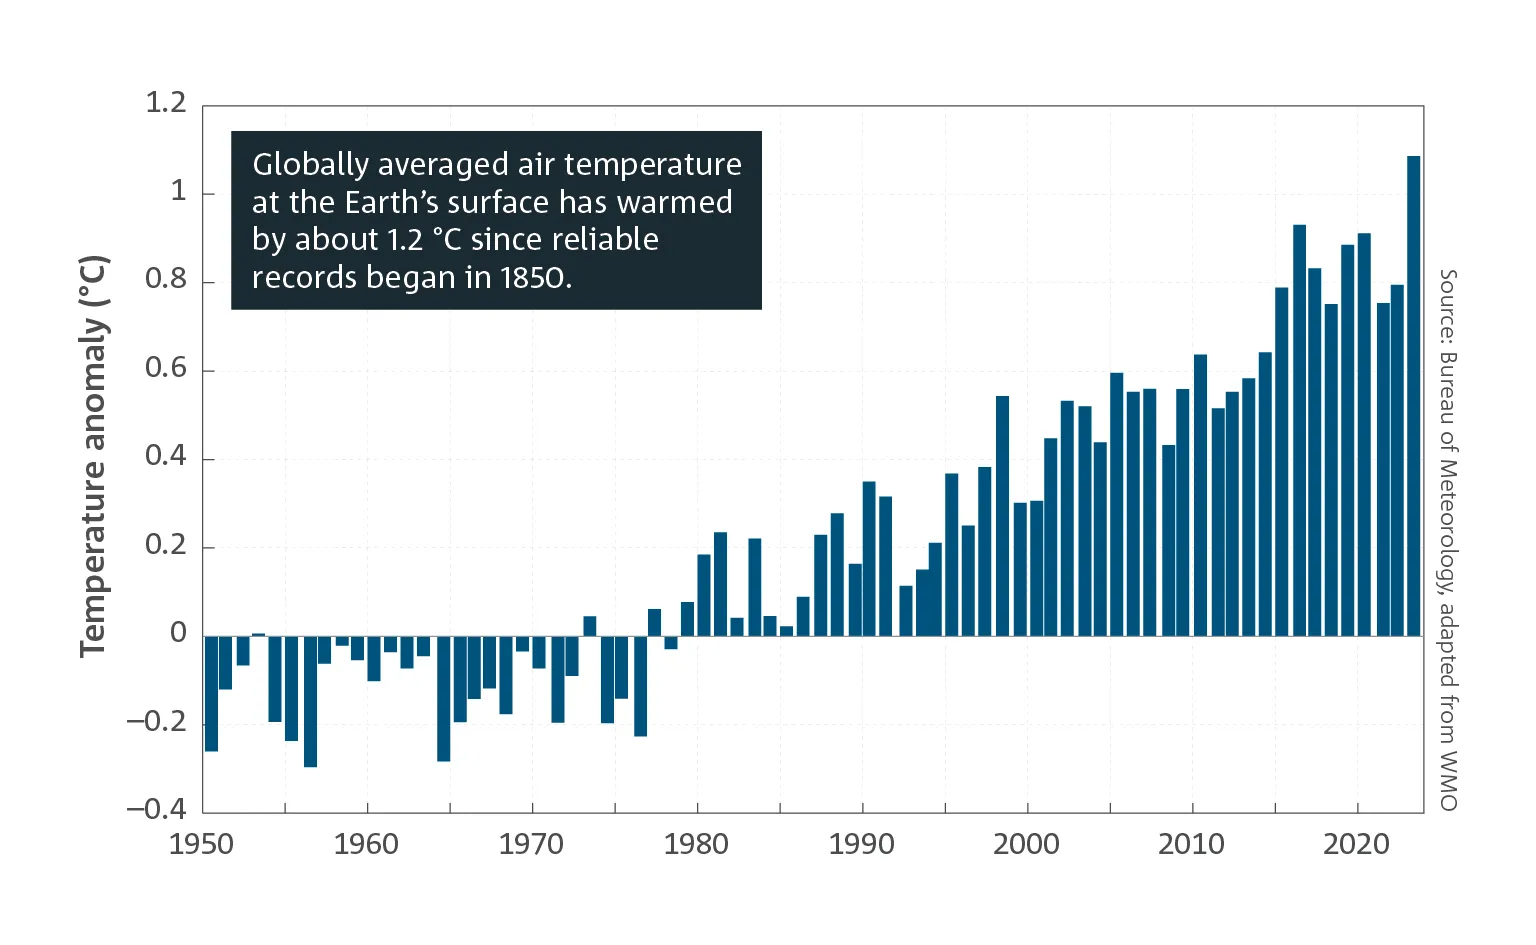
Annual global surface temperature anomalies of the Earth (land and ocean), 1950–2023. Anomalies are relative to the 1961–1990 standard averaging period. Based on data from the World Meteorological Organization.

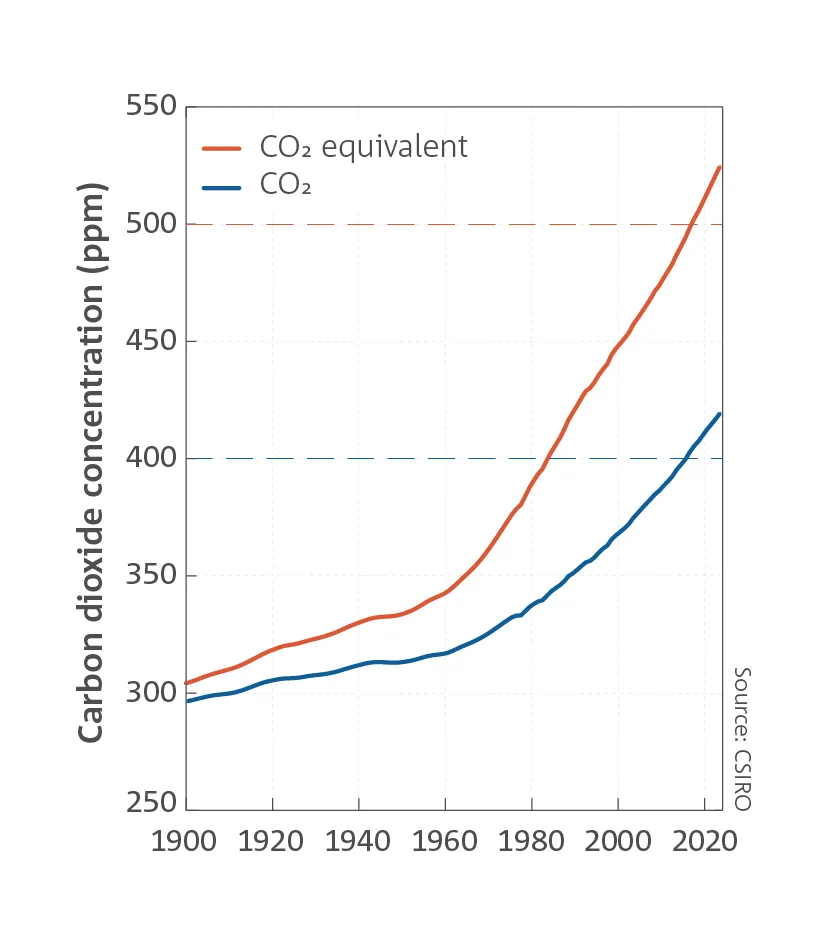
Global mean CO2 concentration and global mean of all greenhouse gas concentrations expressed as CO2-e
Key points: Future
In the coming decades, Australia will experience ongoing changes to its weather and climate. The changes are projected to include:
- Continued increase in air temperatures, with more heat extremes and fewer cold extremes.
- Continued decrease, on average, in cool season rainfall across many regions of southern and eastern Australia, which will likely lead to more time in drought.
- More intense short-duration heavy rainfall events even in regions where the average rainfall decreases or stays the same.
- Continued increase in the number of dangerous fire weather days and a longer fire season for much of southern and eastern Australia.
- Further sea level rise and continued warming and acidification of the oceans around Australia.
- Increased and longer-lasting marine heatwaves that will affect marine environments such as kelp forests and increase the likelihood of more frequent and severe bleaching events in coral reefs around Australia, including the Great Barrier Reef and Ningaloo Reef.
- Fewer tropical cyclones, but with higher intensity on average, and greater impacts when they occur through higher rain rates and higher sea level.
- Reduced average snow depth in alpine regions, but with variations from year to year.
Australia’s weather systems are changing. Southern Australia receives much of its rainfall during the cooler months of the year from low-pressure systems and cold fronts to the south of the subtropical high-pressure ridge. During recent decades, these systems have become less common over southern Australia, and are less likely to produce rainfall when they do occur, contributing to declines in cool season rainfall. Mean sea level atmospheric pressure is increasing over Australia, and there has been an increase in the number of high-pressure systems over southern Australia, which bring dry, clear weather and little rainfall. This increase in atmospheric pressure across southern latitudes is a response to climate change.
There is large variability in the frequency of individual weather systems between individual months and years. Many of these trends are consistent with simulations from climate models, which demonstrate that increased greenhouse gas levels lead to fewer low-pressure systems in southern Australia and a stronger subtropical ridge, but an increase in the intensity of heavy rainfall, including from thunderstorms.
Australia’s climate is also influenced from year to year by various broadscale climate influences, such as the El Niño–Southern Oscillation (ENSO), the Indian Ocean Dipole (IOD) and the Southern Annular Mode (SAM). SAM shows a sustained trend towards more positive conditions from 1950 to the present day, particularly in summer.
The level of ENSO activity over the past 50 years is higher, with more significant El Niño and La Niña events than in the years between 1920 and 1970. However, there is no clear indication that recent activity levels are outside the long-term range of variability, with evidence of high levels of ENSO activity in the late 19th and early 20th centuries. There is low confidence in the long-term trends in the IOD, particularly prior to the 1960s, although paleoclimate data indicate that the recent frequency of strong positive IOD events is high in the context of multi-century variability.
Video: State of the Climate 2024
Our climate has continued to change in the last two years, impacting us now and into the future. Across the world, greenhouse gases in the atmosphere are continuing to increase and globally, 2023 was the warmest year on record. Australia is also continuing to warm in line with global trends. The warming has led to an increase in the frequency of extreme heat events.
2023 was one of Australia's largest bushfire seasons in terms of area burned due to increased fuel loads from high rainfall in 2022 and early 2023 in northern areas. Across large parts of Australia there's been an increase in extreme fire weather and in the length of the fire season there has been a shift towards drier conditions across the south with more frequent years of below average rainfall.
In contrast, northern Australia has been wetter than average over the last 30 years. The intensity of heavy rainfall events is increasing as our climate warms. Oceans around Australia are warming and becoming more acidic, with changes happening faster in recent decades. This warming has led to more frequent marine heatwaves and permanent impacts on the health of our marine ecosystems.
The risk of coastal inundation and damage to infrastructure and communities is increasing with our rising sea levels. With ongoing changes in our weather and climate. Australia must plan for and adapt to the changing nature of climate risk now for future generations. To read the full report, visit our websites.
Need an accessible version of these documents? Contact us about your needs.