About the anticyclone timeseries graphs
Anticyclone indices
High pressure systems (often called anticyclones) are so called since they represent regions of increased atmospheric pressure. Regions of increased atmospheric pressure are associated with clear skies and no rainfall. In Australia, high pressure systems are also associated with warm daytime temperatures and cool overnight temperatures.
High pressure systems are associated with an anticyclonic rotation of air about a central high point in atmospheric surface pressure, which is anticlockwise in the southern hemisphere. The depth of the central atmospheric pressure and the gradient in pressure determine the strength of the anticyclone. In terms of climate change monitoring, long-term changes in the nature or number of high pressure systems in a given region may indicate either an increase or decrease in stable atmospheric conditions. For example, an increase in the occurrence of high pressure systems or an increase in central atmospheric pressure over time generally indicates clearer conditions and reduced rainfall.
Here, we provide two measures of high pressure systems:
(a) Anticyclone density represents a count of the number of anticyclones for a given area for a given season. This is expressed per degree of latitude (a grid area of 111 km by 111 km) squared as an average number.
(b) Anticyclone intensity represents the average central pressure of the high pressure systems (in hPa) for a given region over a given season.
Analyses available
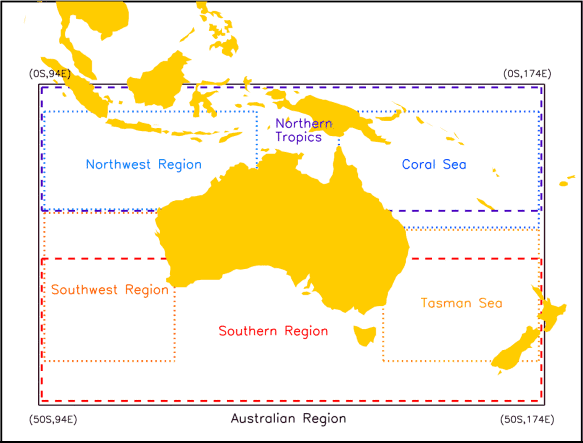
Mean anticyclone density and anticyclone central intensity are provided from 1950 to present for a boxed region around Australia (from 0° to 50°S and from 94°E to 174°E), as well as for six regions within this box: the Northern Tropics (0 °S-22 °S, 94 °E-174 °E), the Southern Region (30 °S-50 °S, 94 °E-174 °E), the Southwest Region (22 °S-46 °S, 94 °E-116 °E), the Northwest Region (4 °S-22 °S, 94 °E-130 °E), the Coral Sea (4 °S-26 °S, 142 °E-174 °E) and the Tasman Sea (26 °S-46 °S, 150 °E-174 °E).

Timeseries are determined for the seven regions shown above.
Data used
The data used to analyse anticyclone density and anticyclone central pressure are the NCEP/NCAR, 6-hourly, surface pressure reanalysis. These data are available from the National Center for Environmental Prediction (NCEP) website http://www.ncep.noaa.gov/. The analysis method makes use of the cyclone tracking algorithm developed at the Bureau of Meteorology and the University of Melbourne described in Jones and Simmonds (1994). The intensity of anticyclones in terms of gradients of pressure is required to be at least 0.075 hPa per degree of latitude squared, as averaged within a 5 degree (~550 km) radius of the centre of the anticyclone.
Please note that any use of the data analysed on these web pages should be acknowledged to the Bureau of Meteorology. Apart from the purposes of study, research, criticism and review, no part of these data may be reproduced, or redistributed for any commercial purposes, or distributed to a third party for such purpose, without written permission from the Director of Meteorology.
The actual data values used to produce each graph are available via the "Raw dataset" link. The format for these data is:
<start year><start month><end year><end month> <value>
The "Sorted dataset" link provides the timeseries as a sorted list in order to place recent values in historical context.
Further information
Murray RJ and Simmonds I 1991. A numerical scheme for tracking cyclone centres from digital data. Part I: Development and operation of the scheme. Australian Meteorology Magazine, 39, 155166.
Jones DA and Simmonds I 1994. A climatology of southern hemisphere extratropical anticyclones. Climate Dynamics, 10, 333-348.
Pezza AB, Simmonds I and Renwick JA 2007. Southern hemisphere cyclones and anticyclones: recent trends and links with decadal variability in the Pacific Ocean. International Journal of Climatology, 27, 1403-1419.


