


Australia's 2025–26 northern wet season

Issued
Summary
- Averaged across Australia, north of 26°S, the wet season (October 2025 to April 2026) rainfall was 683.8 mm, which was 44% above the 1961–1990 average of 476.4 mm, and the seventh-highest wet season total on record since 1900–01.
- Rainfall was above average to very much above average for the Northern Territory, most of Queensland, north of 26°S, and the Kimberley region in Western Australia.
- Rainfall was below average for southernmost parts of Queensland and inland parts of the Pilbara and Gascoyne regions of Western Australia north of 26°S.
- The northern rainfall onset date (the date when rainfall accumulated since 1 September reaches 50 mm) was earlier than average in most parts of the Western Australian Kimberley, the Top End and northern Queensland. It was later than average for areas in the Pilbara in Western Australia, and interior parts of the Northern Territory and Queensland.
- The mean maximum temperature across northern Australia for the wet season was 0.71 °C above the 1961–1990 average, and the mean minimum temperature was 1.10 °C above average, the seventh-warmest wet season on record since 1910–11.
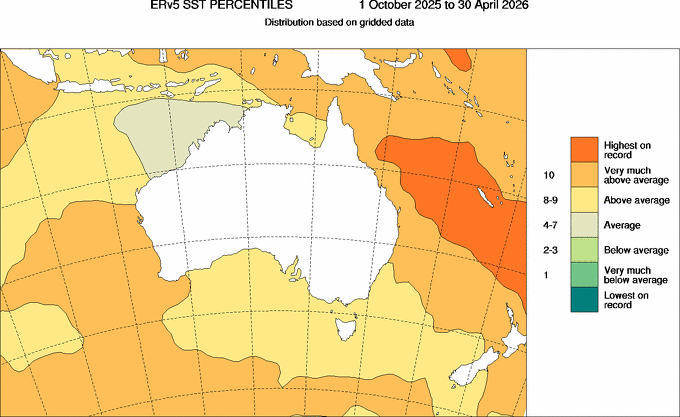
- Sea surface temperatures (SSTs) around northern Australia were the fourth-warmest on record since the 1900–01 wet season, at 0.71 °C above the 1961–1990 average. SSTs in the Coral Sea were the warmest on record for the second consecutive wet season, at 0.99 °C above average.
- Wetter than average conditions across the season saw increases in soil moisture and high inflow to water storages across northern Australia. Major storages, including Lake Argyle, Tinaroo Falls, Fred Haigh, Burdekin Falls, and Teemburra Dam, finished the season at full supply capacity.
- There were 11 tropical cyclones in the Australian region from October 2025 to April 2026, just above the average of 10 for all tropical cyclone seasons since 1980–81.
- Seven tropical cyclones reached severe intensity (Category 3 or stronger) in the Australian region; the proportion is above the average over all seasons but similar to recent years.
- Four systems (Fina, Luana, Hayley and Narelle) made landfall on the Australian mainland at tropical cyclone strength (at least Category 1) and two (Mitchell and Koji) made landfall at tropical low strength.
Temperature
Maximum temperature
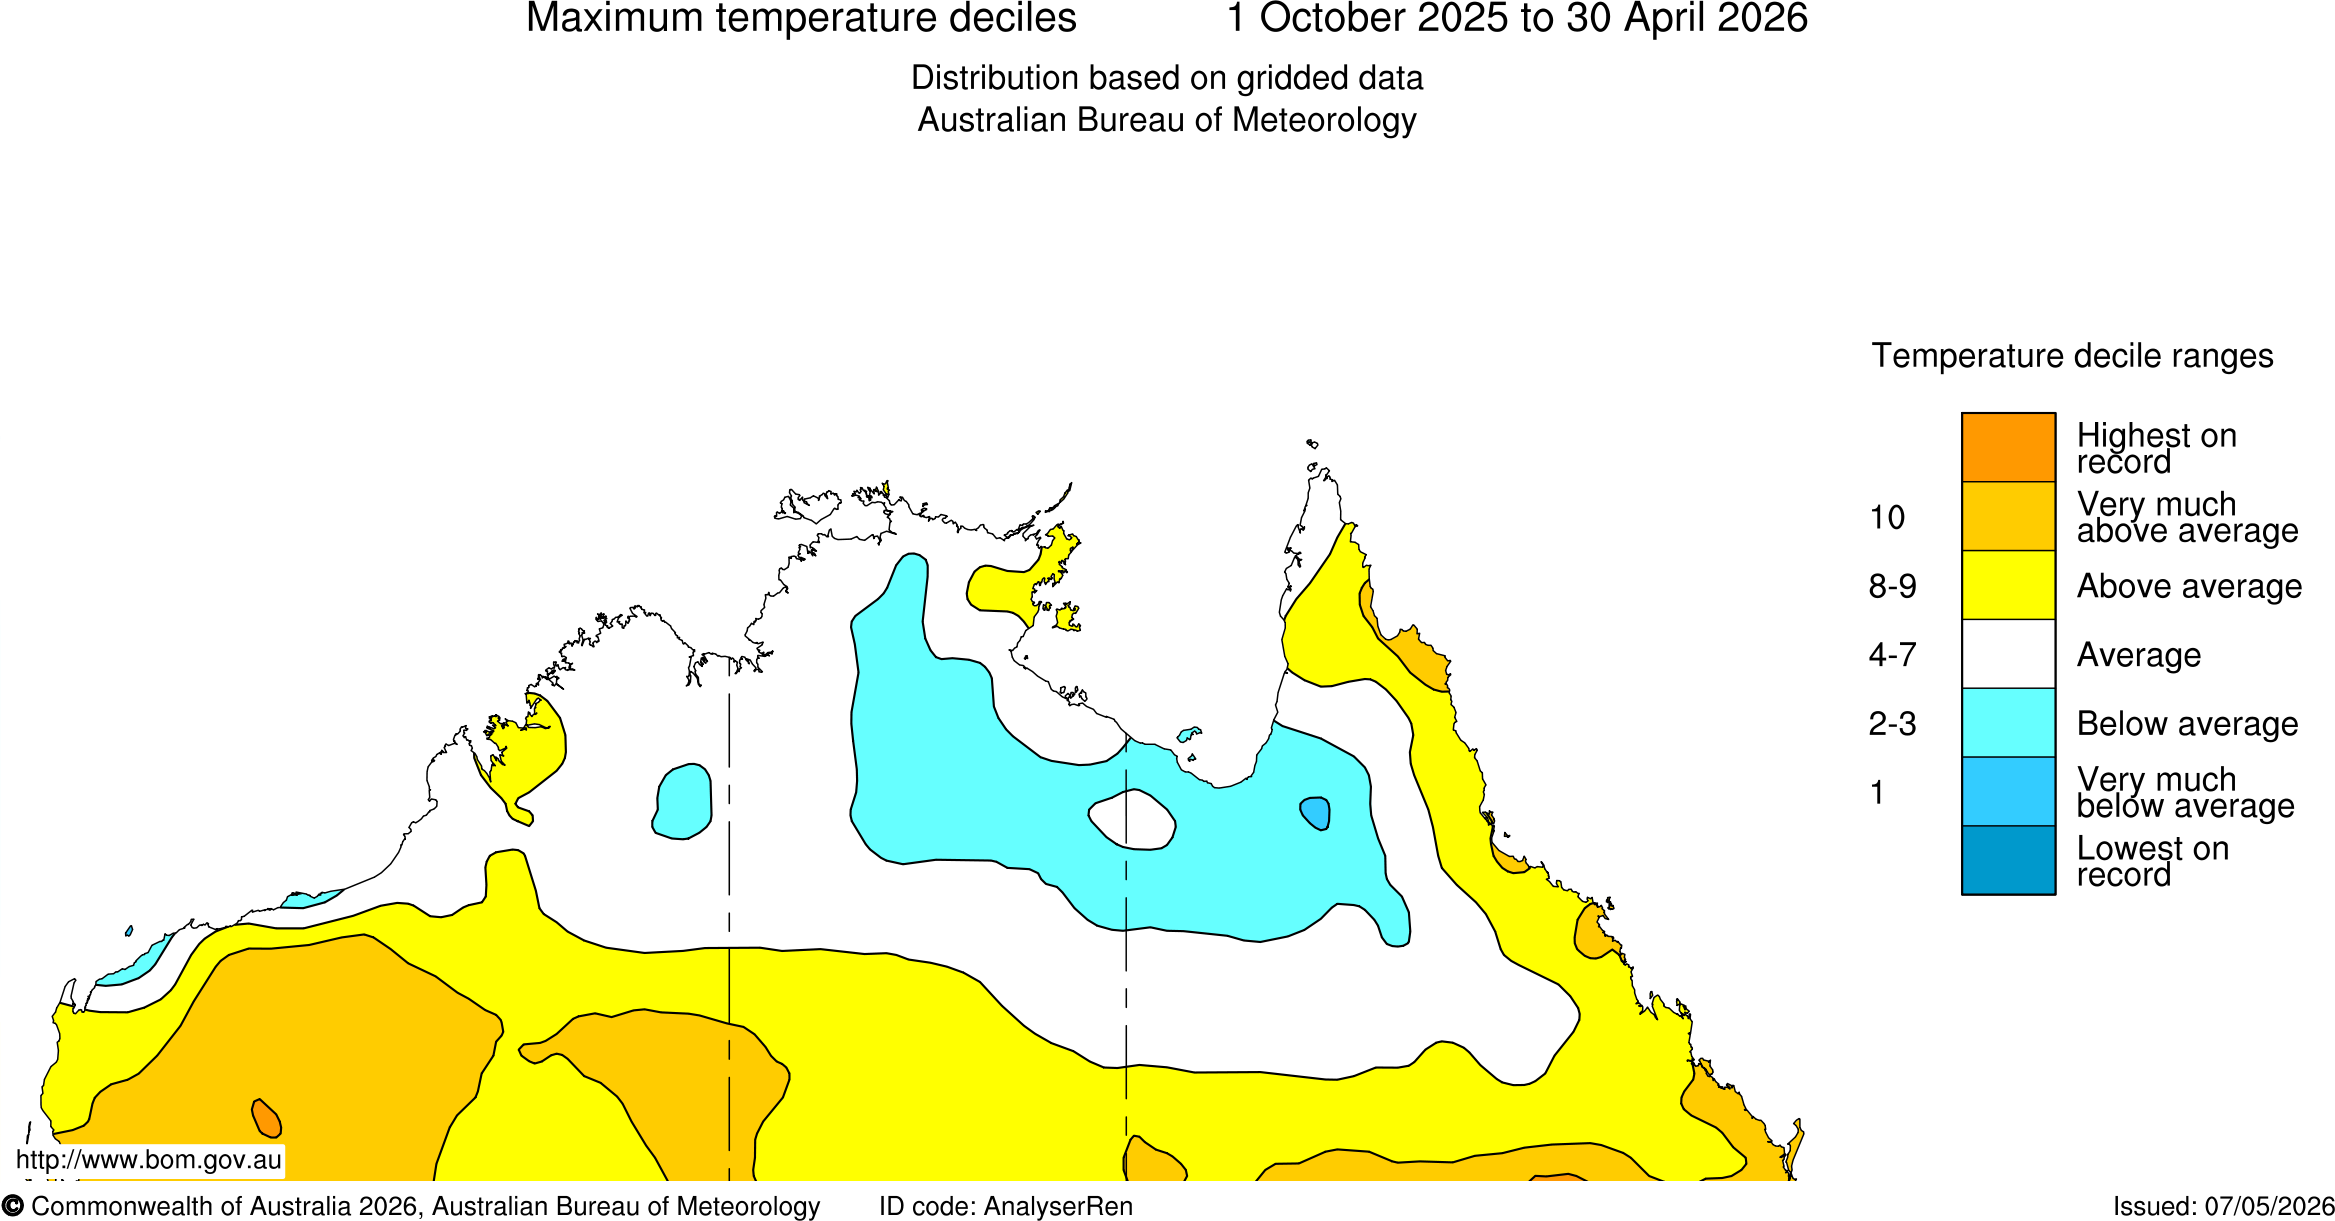
The mean maximum temperature across northern Australia (north of 26°S, the Northern Territory/South Australia border) for the 2025–26 northern wet season (October 2025 to April 2026) was 0.71 °C above the 1961–1990 average.
Mean maximum temperatures were above average to very much above average (in the highest 10% of all wet seasons since 1910–11) for the east coast and southern Queensland, the south of the Northern Territory, and northern interior parts of Western Australia.
Mean maximum temperatures were below average for much of the Northern Territory's north, western Queensland and parts of the Kimberley region in Western Australia, due to increased cloud cover from tropical activity.
Northern Australia's area-averaged maximum temperature was warmer than average for October, November, December, January and April. The October 2025 area-averaged maximum temperature of 3.00 °C above average was the highest on record for the month. For February and March 2026, area averaged maximum temperatures were cooler than average, and the lowest since 2014 and 2012 respectively for those months.
Minimum temperature
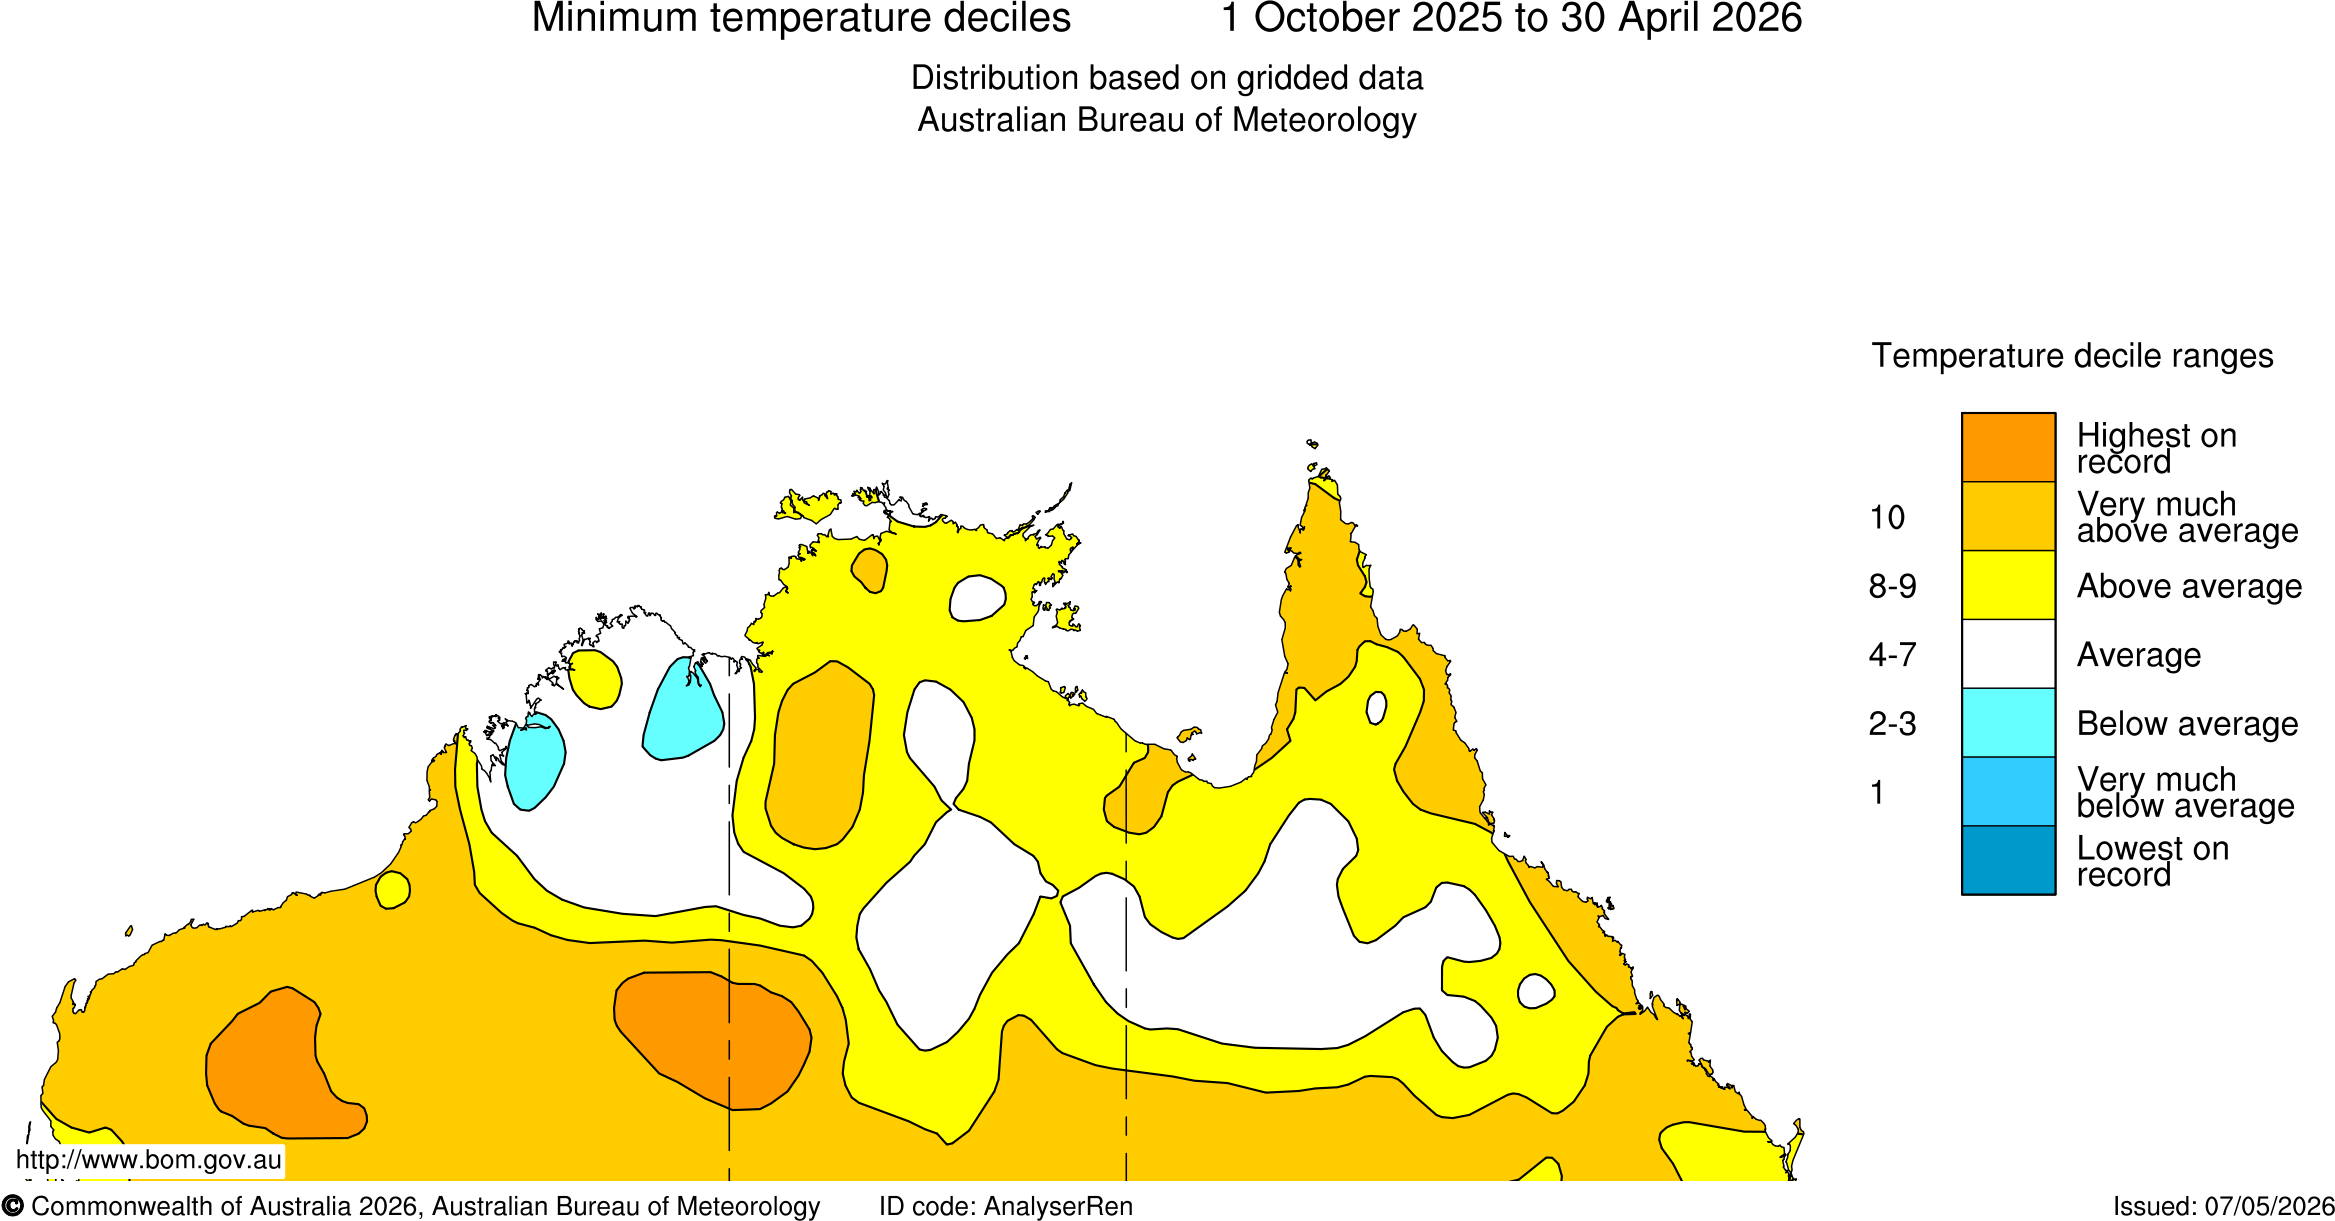
The mean minimum temperature averaged across northern Australia was 1.10 °C above the 1961–1990 average, the seventh-warmest wet season on record. Mean minimum temperatures were above to very much above average across most of northern Australia, except for some parts of inland Queensland and the Northern Territory, and the Kimberley region in Western Australia.
Mean minimum temperatures were highest on record for parts of the Pilbara and Interior districts in Western Australia, and in adjoining parts of the Lasseter and Tanami Districts in the Northern Territory.
Northern Australia's area-averaged minimum temperature was warmer than average for each month of the wet season. The October 2025 area-average minimum temperature was 2.74 °C above average, the highest on record for the month. The January and February 2026 area-average minimum temperatures were the fifth and eighth highest on record, respectively, for those months.
Rainfall
Total rainfall
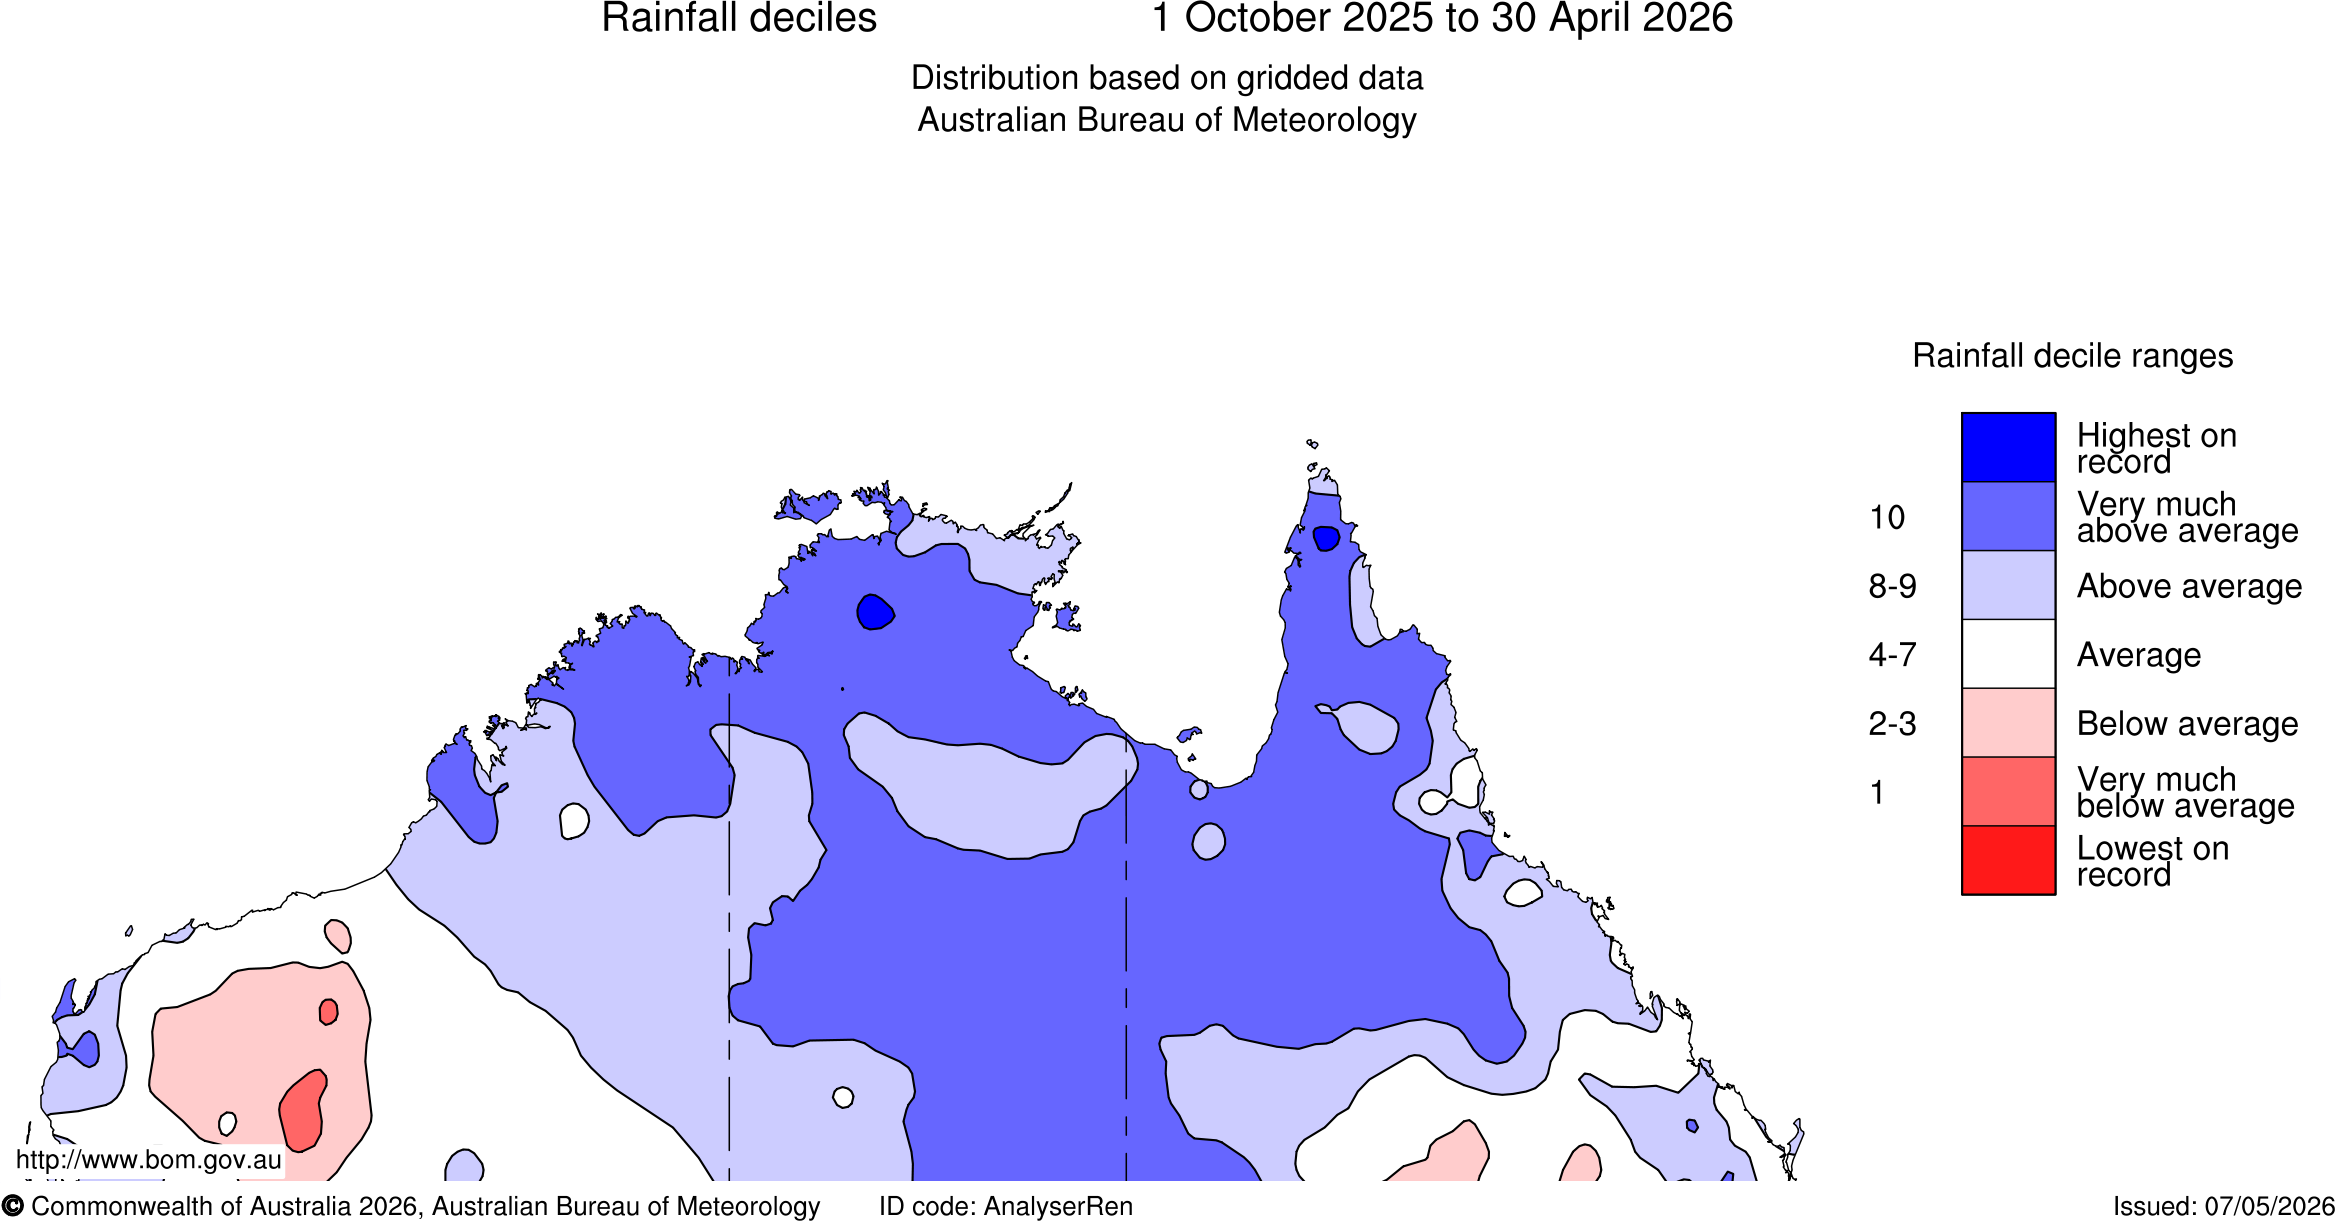
The total area-averaged rainfall for northern Australia over the 2025–26 wet season (October 2025 to April 2026) was 683.8 mm, which was 44% above the 1961–1990 average of 476.4 mm. It was the seventh-highest wet season rainfall on record (since 1900–01), comparable to 2022–23.
Rainfall was above average to very much above average (in the highest 10% of all wet seasons since 1900–01) for the Northern Territory, most of Queensland north of 26°S, and the Western Australia Kimberley region. This included small pockets of highest on record rainfall, most notably in the Katherine and Daly river catchments in the Northern Territory and parts of northern Cape York Peninsula in Queensland.
Rainfall was average to below average for the southernmost parts of Queensland north of 26°S as well as parts of the inland Pilbara and Gascoyne regions in Western Australia.
Rainfall onset
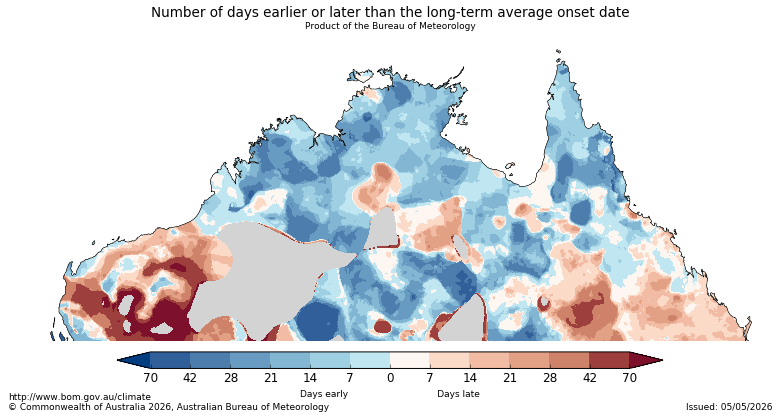
Much of northern Australia saw an earlier than average northern rainfall onset date (the date when the rainfall accumulated since 1 September reaches 50 mm) relative to wet seasons in the 1981–2010 period. Some parts of northern Queensland and the Northern Territory, and inland in the Kimberley region in Western Australia, had an onset date at least 4 weeks earlier than average. The remaining parts of the Kimberley, the Top End and far northern and north-western Queensland were generally 1 to 2 weeks earlier than average.
In contrast, parts of the Pilbara region in Western Australia, parts of the Northern Territory interior and central Queensland experienced later than average onset dates.
Monthly rainfall
The wet season started with above average rainfall for October, November and December 2025, with totals 31%, 61% and 71% above average, respectively. These rainfall totals were driven respectively by warm conditions and tropical moisture in October, Severe Tropical Cyclone Fina in November, and the arrival of the monsoon across northern Australia in December.
A monsoonal low led to the highest December rainfall on record for parts of Queensland's Gulf Country and adjoining inland areas, and very much above average rainfall for eastern parts of the Northern Territory. January rainfall was close to average overall, with above average rainfall along the northern coastline from Broome to Gladstone and very much below average rainfall in the interior.
Rainfall in February and March was very much above average across northern Australia with rainfall totals 67% above average for both months. February rainfall was the fourth-highest on record and highest since 2000, and March rainfall was eighth-highest on record.
In February, tropical low 21U, which eventually became Severe Tropical Cyclone Mitchell, was responsible for widespread rainfall in northern parts of the Northern Territory and Western Australia. A sequence of inland troughs and lows also brought widespread heavy rainfall to Central Australia and western Queensland in February. The Lake Eyre Basin (the drainage division for Kati Thanda – Lake Eyre) received more than 3.5 times its monthly average rainfall, and its third-highest total for any month since 1900.
In March, the slow-moving Tropical Low 31U and monsoonal conditions brought record rainfall to parts of the Top End, particularly around the Katherine River catchment, with numerous stations receiving March or annual daily record totals. In Queensland, Tropical Low 29U brought widespread rainfall to much of eastern Queensland north of 26°S. Further surface troughs through the interior also brought follow up rainfall to central Australia. From mid– to late-March, Severe Tropical Cyclone Narelle brought weekly rainfall totals of over 200 mm along its path, including some stations along the Pilbara coast and inland Gascoyne in Western Australia setting March daily rainfall records.
The end of the wet season was drier, with below average rainfall across much of northern Australia in April. Parts of the eastern Northern Territory and north-western Queensland received above average rainfall, mainly from the remnants of ex-Tropical Cyclone Maila in the middle of the month.
Water
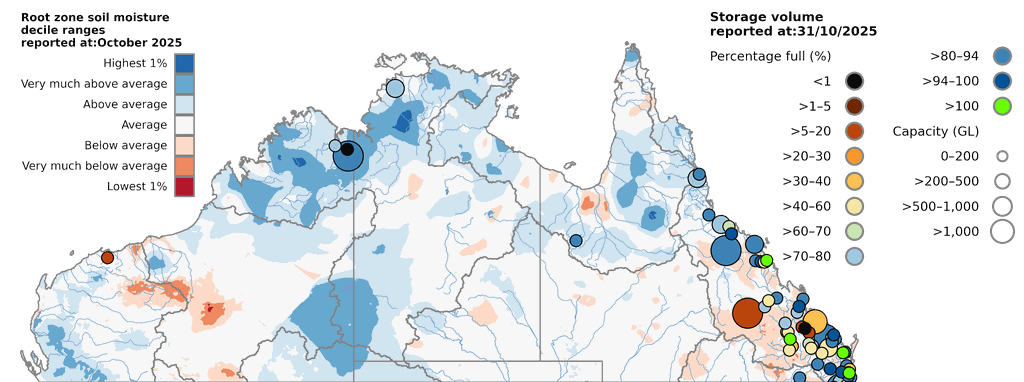
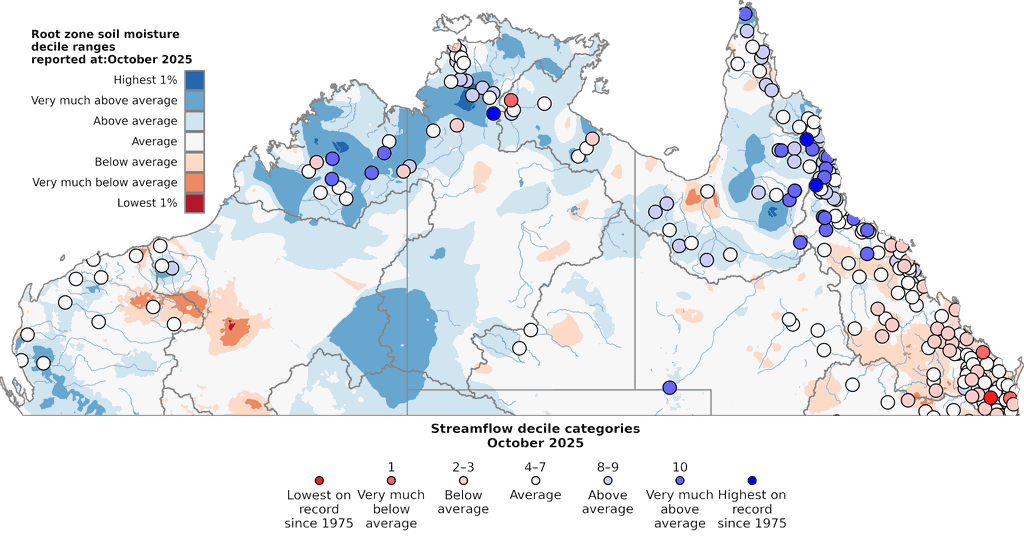
October 2025
At the start of the 2025–26 northern wet season, above average rainfall in October across northern Australia contributed to above to very much above average (in the highest 10% of all years since 1911) soil moisture in the root zone (top 100 cm depth) in areas across northern parts of Western Australia, the Northern Territory and Queensland.
In contrast, some areas in southern parts of Queensland experienced above average potential evaporation, i.e. more energy theoretically available for evaporation and transpiration, and below average rainfall. This resulted in below average soil moisture in some areas.
Streamflow at most gauges were close to average, except for some in the Top End and northern coastal Queensland, which were the highest flows on record for October (since 1975) due to localised heavy rainfall. Several storages, including Tinaroo Falls, were above 90% full at the end of October.
November 2025 to January 2026
Above average rainfall and below average potential evapotranspiration in November, December and January across much of northern Australia helped to increase soil moisture across large parts of the Gulf country and northern Queensland. Tropical Cyclones Fina, Hayley, Koji and Luana all brought heavy rainfall to areas of northern Australia during this period. Further low pressure troughs in January bringing rainfall led to very above average soil moisture in northern Queensland. Very much above average streamflow was observed in January at many sites, with associated riverine and flash flooding in those catchments. High streamflow increased water levels in storages, with a number of large storages, including the Lake Argyle, Burdekin Falls, Teemburra Dam and Tinaroo Falls, over 90% capacity at the end of January.
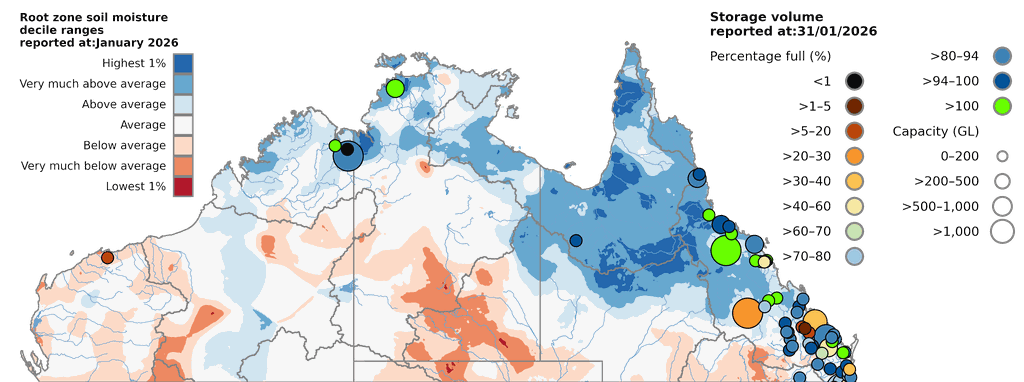
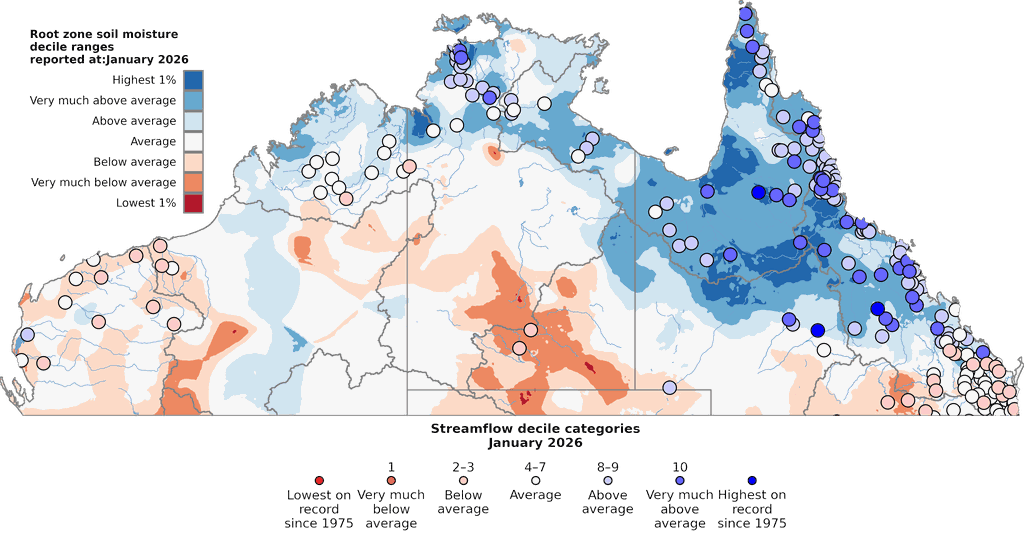
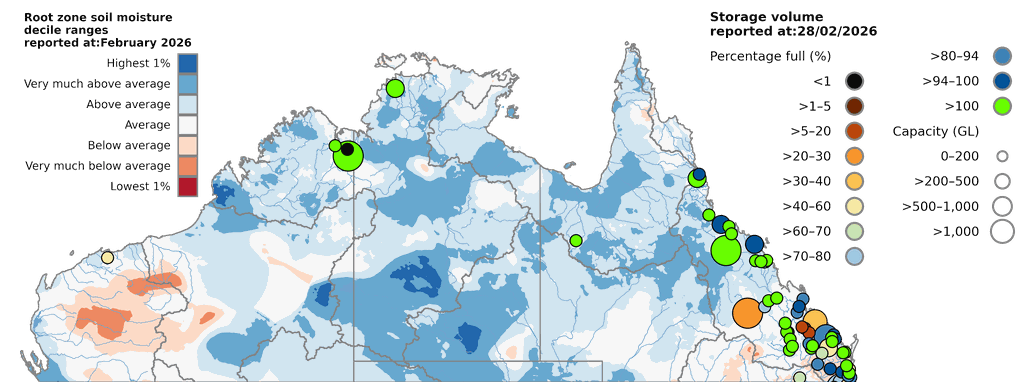
February 2026
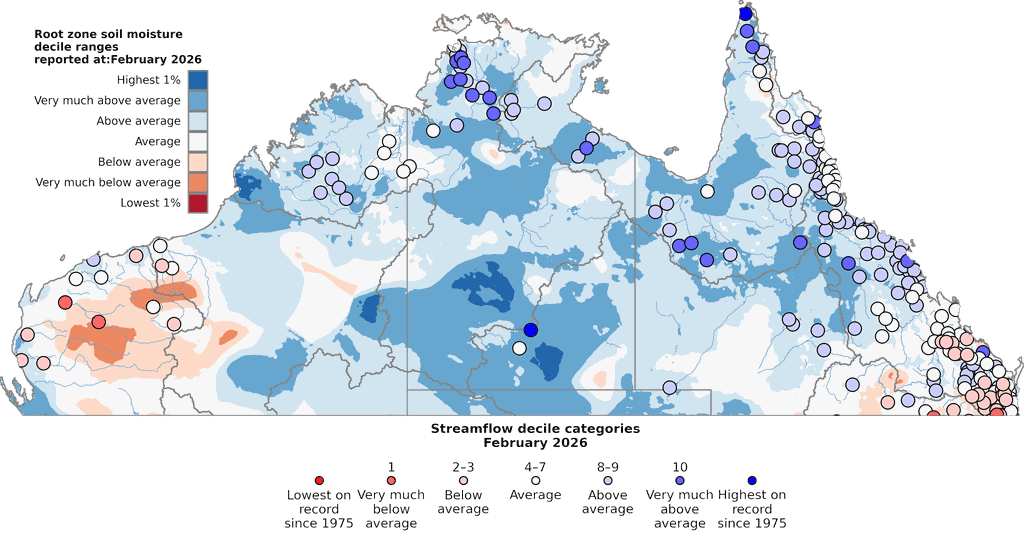
Northern Australia received its highest February rainfall since 2011, resulting in very much above average soil moisture across much of central northern Australia. Wet conditions were reflected in above average streamflow at sites across northern Australia. Severe Tropical Cyclone Mitchell brought heavy rainfall across the Top End and to parts of Western Australia's Kimberley, Pilbara and Gascoyne regions. Many storages across the north reached their full capacity, including Lake Argyle, the Darwin River and Burdekin Falls.
March and April 2026
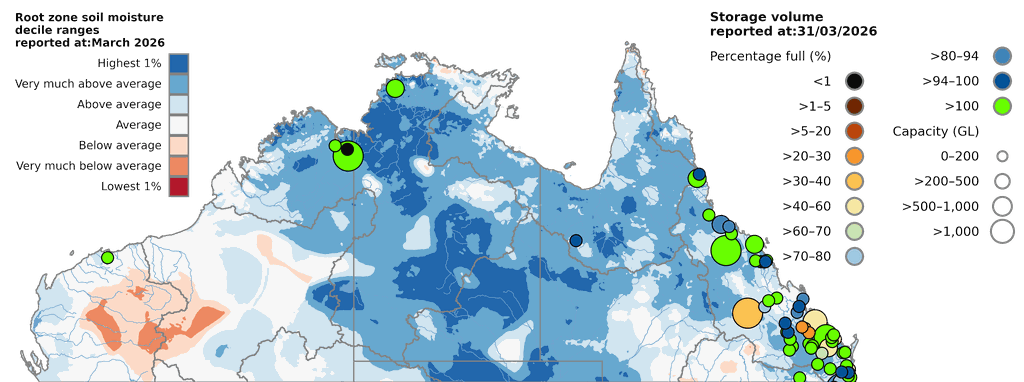
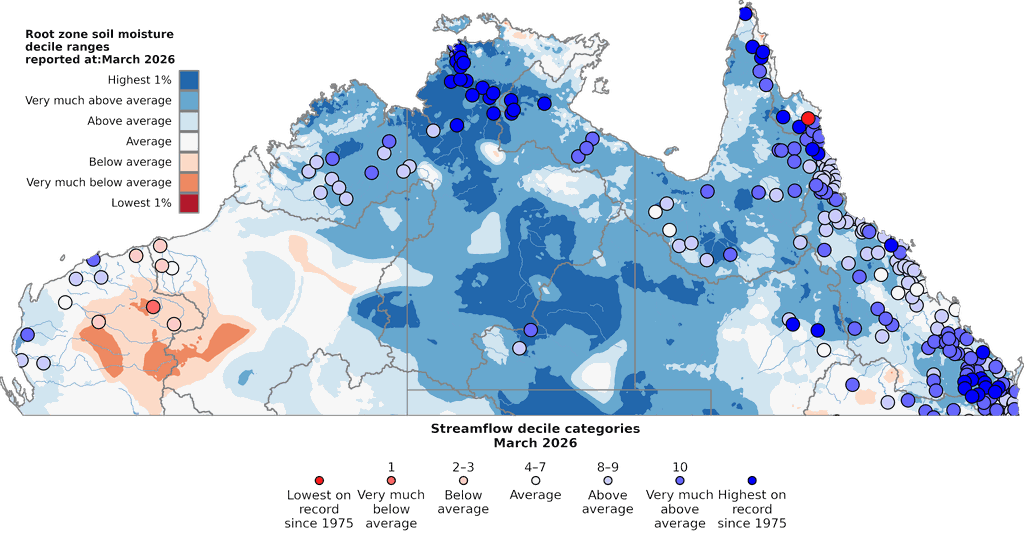
In March 2026 Severe Tropical Cyclone Narelle brought heavy rainfall to Far North Queensland, the Top End and northern Western Australia resulting in major, widespread riverine flooding across areas of inland Queensland. This significantly increased soil moisture in these areas, particularly across the Lake Eyre Basin (the drainage division for Kati Thanda – Lake Eyre). Some streamflow gauges along Queensland's tropical north coast recorded their highest flows on record for March.
In April 2026, above to very much above average rainfall across the eastern Northern Territory and north-western Queensland from the remnants of ex-Tropical Cyclone Maila led to increased soil moisture in these areas. Most river flows were above average, and most water storages were full. However, for coastal parts of northern Western Australia and much of the Kimberley and central Australia average to below average rainfall combined with above average potential evapotranspiration led to below to very much below average soil moisture.
Atmosphere and oceans
(NOAA Extended Reconstructed Sea Surface Temperature dataset, ERSST v5).
The monsoon onset at Darwin for the 2025–26 wet season was observed on 23 December 2025, close to the average date of 29 December for all wet seasons since 1957–58. Monsoonal conditions began developing from around 20 December across the southern Indian Ocean and Australian longitudes.
The Madden–Julian Oscillation (MJO) was active in the Australian region several times during wet season:
- from late October to late November 2025 a moderate to strong pulse moved through the Maritime Continent into the Western Pacific
- in January 2026 a moderate to strong pulse was in the Western Pacific
- from late February to early March 2026 a weak pulse moved through the Maritime Continent and Western Pacific
- in early April 2026 a weak pulse was in the Maritime Continent, before increasing mid-month to moderate strength in the Western Pacific.
These periods saw increased tropical activity over much of northern Australia. Inland and monsoonal troughs, and tropical lows, brought widespread heavy rain, storms and extensive flooding to much of northern Australia.
For the northern tropical region overall (defined as waters between 4°S and 22°S, and 94°E and 174°E), the 2025–26 northern wet season Sea Surface Temperatures (SSTs) were the fourth-warmest on record since 1900–01, at 0.71 °C above the 1961–1990 average.
SSTs in the Coral Sea were the warmest on record at 0.99 °C above average, exceeding the previous record of 0.92 °C in the 2024–25 wet season. Monthly SSTs in the Coral Sea from October 2025 to February 2026 were in the top 3 on record for their respective months, before cooling slightly in March and April.
SSTs in the north-west region were 0.47 °C above average for the 2025–26 northern wet season, equal-16th warmest on record. In the Arafura Sea and off the north-west coast of Australia, waters were generally warmer than average for the October to December period, and close to historical averages, around 28 to 30 °C, for the January to April period.
In the central tropical Pacific, a weak La Niña pattern was established in October 2025 and continued until March 2026. SSTs warmed rapidly in April 2026 but remained at El Niño-Southern Oscillation (ENSO) neutral levels. The Southern Oscillation Index (SOI), representing an atmospheric component of ENSO, was above the La Niña threshold (+7.0) during November 2025 and from January to March 2026. This suggests some influence of La Niña on large-scale conditions in the Australian region. In particular, enhanced trade winds likely contributed to the build up of unusually warm waters in the Coral Sea.
The Indian Ocean Dipole (IOD) was in a negative phase from late July to early December 2025. This warmed waters off the north-west coast of Australia, while cooling them off the Horn of Africa. At its peak, around the end of October 2025, it was one of the strongest negative IOD events on record. In the long-term monthly SST data, the October 2025 monthly IOD index value of −1.05 °C was in the coolest 2% of all months (since 1900). However, unlike historical events, atmospheric conditions in the Australian region in 2025 were less favourable for the negative IOD to bring large volumes of moist tropical air over the continent.
The weekly IOD index had positive values from late January to early March 2026, due to warmer SSTs in the west Indian Ocean. Although this SST gradient was sustained for several weeks, there was no development of a positive IOD phase and the pattern's influence on Australian weather was minimal. SSTs off the north-west coast of Australia remained relatively cool throughout February, with increased cloudiness and tropical activity in the region.
Wet season rainfall over northern Australia is influenced by a complex relationship between large-scale factors. While an active MJO is typically the strongest influence, it is not possible to attribute all the rainfall patterns in any one wet season to an exact combination of influences.
Tropical cyclones
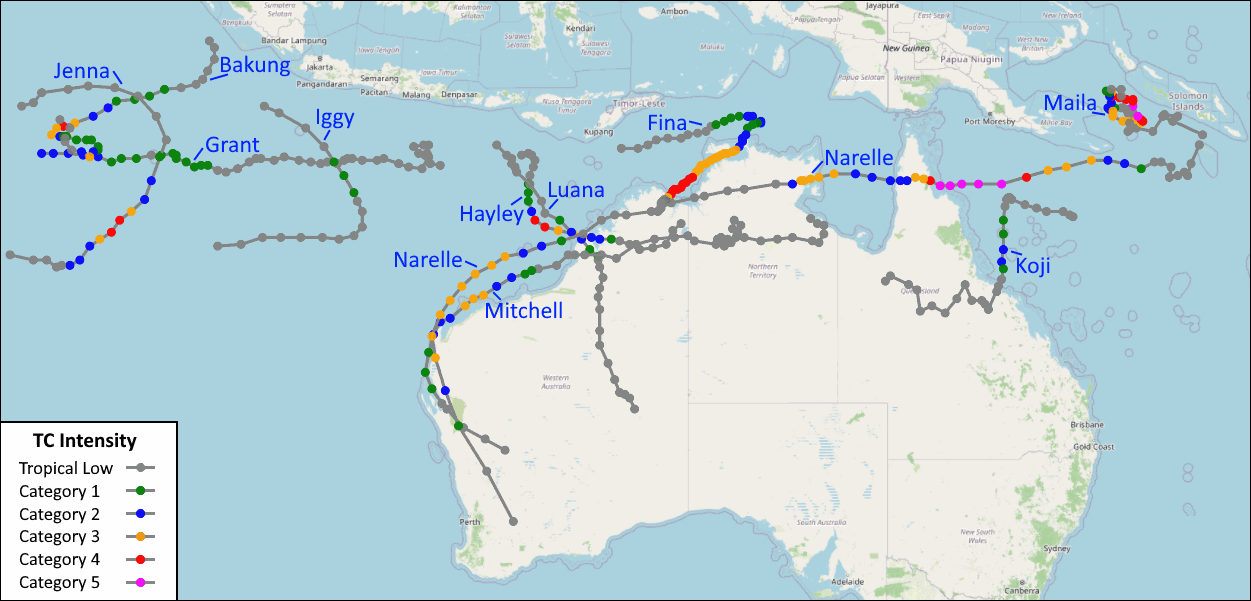
- Eleven tropical cyclones formed in, or moved into, the Australian region (90°E–160°E, south of the equator) during the northern wet season.
- For all seasons since 1980–81, the average number of tropical cyclones in the Australian region has been 10, making this season slightly above average.
- Seven tropical cyclones reached severe intensity (Category 3 or greater) while in the Australian region, including two, Severe TC Narelle and Severe TC Maila, which reached Category 5 strength.
- Tropical cyclone activity was concentrated in the western Australian region, which experienced 9 tropical cyclones between 90°E and 125°E, with 3 occurring in the eastern tropical region.
- Four tropical cyclones (Fina, Luana, Hayley and Narelle) made landfall at tropical cyclone strength (at least Category 1), and two systems (TC Mitchell and TC Koji), crossed at tropical low strength.
- Severe Tropical Cyclone Fina in November 2025 was the most intense tropical cyclone on record in the Australian region for November, and was the equal earliest on record to make landfall on Australia.
- Severe Tropical Cyclone Narelle was another highly significant system, becoming only the second cyclone, to have made landfall on Australia 3 times at severe category intensity, since reliable estimates of tropical cyclone intensity began in 1980–81.
Severe Tropical Cyclone Fina
- Tropical low 02U formed in the Indian Ocean north of the Kimberley, Western Australia, on 15 November and tracked eastwards.
- The low intensified to a tropical cyclone on 18 November and was named Tropical Cyclone Fina offshore to the north of Darwin.
- TC Fina intensified to a Category 2 strength before turning westwards and briefly weakening to Category 1 strength.
- TC Fina re-intensified to Category 2 strength prior to making landfall on the Cobourg Peninsula on the evening of 21 November. This was the equal earliest landfall on record for the Australian region, matching Severe TC Ines on 21 November 1973.
- TC Fina strengthened further to Category 3 intensity as it tracked west south-westwards across the Van Diemen Gulf, making a second landfall over the southern part of Melville Island on 22 November before continuing south-westwards.
- While the very destructive core missed the greater Darwin region, the city experienced damaging winds, with a estimated maximum gusts of 120 km/h.
- TC Fina reached its peak intensity as a high-end Category 4 system on 24 November, making it the most intense cyclone on record for the Australian region during November.
- The system weakened to Category 3 intensity prior to making a third landfall on the north-east Kimberley coast near the Berkeley River Mouth on 24 November, before rapidly weakening inland.
- TC Fina produced weekly rainfall totals from 18 to 24 November ranging from 50 mm to more than 400 mm across large areas of the Northern Territory's Top End.
- Several daily rainfall records were set across the Top End, including 430.0 mm at Middle Point to 9 am on 23 November, which is the highest daily rainfall total ever recorded in the Northern Territory in November and the fourth-highest anywhere in Australia.
Severe Tropical Cyclone Bakung
- Tropical low 05U formed west of Sumatra, Indonesia, on 10 December and intensified to tropical cyclone strength on 12 December, when it was named Bakung by the Jakarta Tropical Cyclone Warning Centre.
- TC Bakung tracked west-south-westwards well to the north of Cocos (Keeling) Islands, entering Australia's Area of Responsibility between 13 and 14 December. The system briefly intensified to Category 4 strength on 14 December before weakening.
- TC Bakung strengthened again to a Category 3 system on 17 December.
- TC Bakung weakened on 17 December at it turned north-westwards and subsequently moved northwards out of the Australian region (north of 10°S).
- Severe Tropical Cyclone Bakung did not impact the Australian mainland or island communities.
Tropical Cyclone Grant
- Tropical low 03U developed in the Indian Ocean to the south of Indonesia on 16 December and moved westwards.
- The system reached tropical cyclone strength on 23 December and was named Tropical Cyclone Grant.
- TC Grant briefly weakened below tropical cyclone strength as it passed to the north of Cocos (Keeling) Islands on 25 December, bringing gale force winds to the Islands.
- TC Grant subsequently redeveloped and reached its peak intensity in the Australian region as a Category 2 system on 26 December before moving west of 90°E into the La Réunion's Area of Responsibility on 27 December.
Severe Tropical Cyclone Hayley
- Tropical low 08U formed in the Indian Ocean on 28 December and tracked southwards.
- The system strengthened on 29 December, was named Tropical Cyclone Hayley, and rapidly intensified to its peak at Category 4 strength while turning eastwards and approaching the Dampier Peninsula, Western Australia.
- TC Hayley weakened slightly to Category 3 strength as it tracked towards the coast and made landfall on the Kimberley coast near Djarindjin and Lombadina at around 5:00 pm AWST on 30 December. The cyclone then moved across King Sound and tracked north of Derby at Category 2 intensity.
- TC Hayley weakened below tropical cyclone strength on 31 December.
- Heavy rainfall and damaging winds impacted the Dampier Peninsula. Daily rainfall totals included 108.0 mm recorded at Cygnet Bay to 9 am on 31 December and 182.2 mm at Lansdowne to 9 am on 1 January. A peak wind gust of 158 km/h was recorded at Lombadina AWS on 31 December.
- TC Hayley was the second tropical cyclone of the 2025–26 season to make landfall on the Australian coast.
Tropical Cyclone Iggy
- Tropical low 10U formed to the south-west of Sumatra in the Indian Ocean on 30 December and tracked south-eastwards.
- The system entered the Australian Area of Responsibility on 31 December and passed to the east of Christmas Island, bringing heavy rainfall. Rainfall totals of 57.8 mm were recorded in the 24 hours to 9 am on 31 December 2025 and 93.4 mm to 9 am on 1 January 2026.
- The low intensified to tropical cyclone strength and was named Tropical Cyclone Iggy on 1 January, briefly peaking at Category 1 intensity.
- TC Iggy weakened below tropical cyclone strength less than 24 hours later on 2 January and turned westwards well away from Australia.
Severe Tropical Cyclone Jenna
- Tropical low 11U developed on the 3 January as it tracked eastwards then southwards towards the Cocos (Keeling) Islands.
- The system reached tropical cyclone strength to the east of the Cocos (Keeling) Islands on 5 January and was named Tropical Cyclone Jenna.
- TC Jenna rapidly strengthened as it moved south-westwards away from the islands, reaching Category 4 intensity on 6 January.
- TC Jenna weakened rapidly on 7 January, falling below tropical cyclone strength before moving westwards out of the Australian region (90°E) on 9 January.
- TC Jenna brought strong winds and heavy rainfall to the Cocos (Keeling) Islands early in its development.
Tropical Cyclone Koji
- Tropical low 12U formed in the Coral Sea on 7 January and tracked westwards.
- The low turned southwards on 9 January and intensified to tropical cyclone strength. It was named Tropical Cyclone Koji on 10 January and reached its peak at Category 2 intensity that day.
- TC Koji weakened on approach to the north Queensland coast and fell below tropical cyclone strength before crossing the coast between Ayr and Bowen at around 10:00 am AEST on 11 January.
- The system tracked across northern Queensland for several days, producing widespread heavy rainfall and embedded storms, along with strong winds, resulting in minor to major flooding across the region.
- Weekly rainfall totals from 6 to 12 January of 50 to 300 mm, and locally higher, were recorded across much of tropical and eastern Queensland.
Tropical Cyclone Luana
- Tropical low 16U formed in the Indian Ocean south of Indonesia on 21 January.
- The system reached tropical cyclone strength and was named Tropical Cyclone Luana on 24 January while moving south-eastwards towards the Kimberley coast and reaching Category 2 intensity.
- TC Luana made landfall at Category 2 intensity at around 2:00 pm AWST on 24 January on the Dampier Peninsula, Western Australia, between Beagle Bay and Cape Leveque, near the same location as Severe TC Hayley.
- TC Luana tracked southwards inland and weakened to a tropical low on 25 January.
- TC Luana brought strong winds and heavy rainfall, resulting in flash flooding and inundation across the western Kimberley, Western Australia and into central Australia.
- Daily rainfall totals of 100 to 200 mm were recorded across large areas of the Dampier Peninsula and western Kimberley to 9 am AWST on 25 January, including Curtin Airport with 231.8 mm.
- Peak wind gusts of 106 km/h were recorded at Lombadina and Curtin Aero on 24 January.
- TC Luana was the third tropical cyclone of the 2025–26 season to make landfall on the Western Australian coast.
Severe Tropical Cyclone Mitchell
- Tropical low 21U formed over the western Gulf of Carpentaria on 29 January and tracked westwards across the Northern Territory and the Kimberley, Western Australia.
- The system moved offshore and intensified to a tropical cyclone to the north-east of Port Hedland, where it was named Tropical Cyclone Mitchell on 6 February.
- TC Mitchell moved west-south-west and intensified to Category 3 strength between 7 and 8 February, before beginning to weaken as it turned southwards parallel to the Western Australian coast.
- TC Mitchell weakened below tropical cyclone strength prior to crossing the coast near Shark Bay around 12:00 am AWST on 10 February, before continuing inland and bringing widespread rain, showers and thunderstorms to large parts of the south-west of Western Australia.
- The system produced several days of heavy rainfall and flooding across the Northern Territory and northern and south-western Western Australia. Weekly rainfall totals of 50 to 300 mm, and locally higher totals, were recorded across much of the Top End of the Northern Territory between 30 January and 5 February, and in parts of the northern and south-western Western Australia between 5 to 11 February.
- Daily rainfall records from the system included 183.0 mm at Gilnockie (Northern Territory) on 2 February and 144.2 mm at Cattle Creek (Northern Territory) on 3 February.
- The system was also associated with strong winds, impacting offshore operations, the Carnarvon area and some parts of the Wheatbelt, Western Australia.
Severe Tropical Cyclone Narelle
- Tropical low 34U formed south of the Solomon Islands on 15 March and moved westwards.
- The system reached was named Tropical Cyclone Narelle on 17 March.
- On 19 March, TC Narelle rapidly intensified to Category 5 strength.
- TC Narelle weakened to Category 4 intensity before crossing the Far North Queensland coast between Lockhart River and Coen on 20 March.
- The system weakened to Category 2 intensity as it moved across the Cape York Peninsula and entered the Gulf of Carpentaria, where it re-intensified to Category 3 strength.
- TC Narelle continued westwards and made a second landfall at Category 3 intensity on the eastern Northern Territory coast between Nhulunbuy and Groote Eylandt on 21 March.
- Narelle weakened below tropical cyclone strength as it moved across the Top End of the Northern Territory, into the Joseph Bonaparte Gulf and across the northern Kimberley, Western Australia, before moving offshore on 24 March.
- The system re-intensified to severe tropical cyclone strength to the north of the Pilbara coast on 25 March and turned south-south-eastwards, briefly reaching Category 4 intensity.
- TC Narelle made its final landfall on the Western Australian coast south of Coral Bay at Category 3 intensity on 28 March and rapidly weakened as it moved inland.
- Over its lifetime, TC Narelle produced weekly rainfall totals of more than 200 mm across Far North Queensland, the Northern Territory and the north-west of Western Australia.
- Peak wind gusts included 200 km/h at Learmonth Airport on 27 March and 185 km/h at Varanus Island on 26 March.
- TC Narelle is the second on record (since 1970–71) tropical cyclone, after TC Ingrid in 2005, to cross the coast of the Australian mainland 3 times at Severe intensity (Category 3 or stronger) and the third to cross the coasts of each of the three northern states and Territories.
Severe Tropical Cyclone Maila
- Tropical low 37U formed to the south of Honiara in the Solomon Sea on 1 April and tracked north-westwards.
- The system reached tropical cyclone intensity on 4 April and was named Tropical Cyclone Maila by Papua New Guinea National Weather Service, the first time a TC has formed in the Papua New Guinea region since November 2007.
- TC Maila intensified rapidly, reaching severe tropical cyclone intensity on 5 April and peaking at Category 5 strength on 6 April.
- Severe TC Maila moved slowly in Australia's Area of Responsibility between 6 and 11 April, briefly re-entering the Papua New Guinean Area of Responsibility between 9 and 10 April.
- TC Maila began to weaken from 9 April and fell to below tropical cyclone strength by 11 April.
- The system produced strong winds and heavy rainfall, leading to flash flooding and structural damage across parts of the Solomon Islands and Papua New Guinea.
- Severe TC Maila is likely to have been the strongest tropical cyclone on record in the Solomon Sea.
Data currency
All values in this statement were compiled from data available as of 7 May 2026. Subsequent quality control and the availability of additional data may result in minor changes to final values.
Related information
- Area-average data and time series charts for the northern wet season period
- Rainfall maps for the 7-months period ending April
- Wet season climate summary for Northern Territory
About the data
The use of current and historical climate information allows for comparison of climate impacts from one year to the next and aligns with other reporting processes that occur over northern wet season periods.
This statement was prepared using the following sources:
- Rainfall maps from the Australian Gridded Climate Dataset (AGCD) analyses.
- Temperature maps from the Australia Water Availability Project (AWAP) analyses.
- Area-average time series for the northern wet season are calculated from the homogenised Australian temperature dataset (ACORN-SAT) and AGCD monthly rainfall.
- Root-zone soil moisture from Australian Water Resources Assessment Landscape model (AWRA-L) 7.0 analyses.
- Water storage information and the Murray-Darling Basin Information Portal.
- Sea surface temperature from the ERSSTv5 dataset.
- Tropical Cyclone information from Australian tropical cyclone season.
![]() Unless otherwise noted, all maps, graphs and diagrams in this page are licensed under the Creative Commons Attribution 4.0 International Licence
Unless otherwise noted, all maps, graphs and diagrams in this page are licensed under the Creative Commons Attribution 4.0 International Licence
