


There are currently no formally monitored deficiency periods
During the absence of large-scale rainfall deficiencies over periods out to around two years' duration, the Drought Statement does not include any formally monitored deficiency periods. We will continue to monitor rainfall over the coming months for emerging deficiencies or any further developments.
Rainfall history
 Australian rainfall history
Quickly see previous wet and dry years in one (large) screen.
Previous three-monthly rainfall deciles map
See also: Rainfall maps | Rainfall update
Soil moisture details are reported when there are periods of significant rainfall deficits.
Soil moisture data is from the Bureau's Australian Water Resources Assessment Landscape (AWRA-L) model, developed through the Water Information Research and Development Alliance between the Bureau and CSIRO.
See also: Australian Water Outlook: Soil moisture
See also: Murray-Darling Basin Information Portal
Previous issues
Related links
Significant easing of rainfall deficiencies in the Northern Territory
November rainfall was the 10th-highest on record for Australia as a whole, with the national area-average 76% above the 1961–1990 average. Area-averaged rainfall was amongst the five highest on record for November (compared with all Novembers since 1900) for the Northern Territory, Western Australia and Victoria.
Rainfall was above or very much above average for most of Australia, and the highest on record since 1900 for parts of the Kimberley in Western Australia and adjoining areas of the Northern Territory. Rainfall was below average in the Northern Rivers district in north-eastern New South Wales, south-eastern Queensland and in seasonally-dry areas of the Pilbara and Gascoyne in Western Australia.
The wet conditions in the north of the Northern Territory significantly eased rainfall deficiencies in that region. For the period starting December 2021, serious rainfall deficiencies (totals in the lowest 10% since 1900) remain in western Tasmania and part of south-west Western Australia. November rainfall in those regions was close to average, only slightly easing the rainfall deficiencies.
Multi-year rainfall deficiencies, which originated during the 2017–2019 drought, have been almost entirely removed from the eastern states. The largest area of remaining multi-year rainfall deficiencies is in the Goldfields District of Western Australia, with smaller pockets in south-west Western Australia and the north of the Northern Territory.
The long-range forecast released on 1 December 2022 indicates rainfall for December to February is likely to be above median in eastern parts of eastern states, with the high probabilities occurring in December. Below median rainfall is likely for large parts of Western Australia.
Deficiencies for the 12 months since December 2021
Rainfall for November was the 10th-highest on record since 1900 for Australia as a whole, and was amongst the five highest on record for the Northern Territory, Western Australia and Victoria.
November rainfall was below average in north-eastern New South Wales and south-eastern Queensland, and in the Pilbara region of Western Australia. Rainfall was close to average in parts for south-west Western Australia, south-western Tasmania and much of the east coast from New South Wales to southern Queensland. Rainfall was above average or very much above average (highest 10% of all Novembers since 1900) for most of the rest of Australia and highest on record for parts of the Kimberley region in Western Australia and adjoining areas of the Northern Territory.
For the 12-month period ending in November 2022, serious rainfall deficiencies (in the lowest 10% since 1900) are in place for western Tasmania and a small pocket of south-west Western Australia. Compared with the 11-month period ending in October 2022, rainfall deficiencies have slightly decreased in western Tasmania but have worsened slightly in south-west Western Australia.
November rainfall for the Northern Territory overall was the fifth-highest on record since 1900, with frequent thunderstorms and showers across central and western areas. Total rainfall in these areas was in the highest 10% of all Novembers since 1900, and highest on record in the west. As a result of the rain, deficiencies in the 12-month period ending in November 2022 were significantly decreased compared with the 11-month period ending in October. This has almost removed the deficiencies accumulated during the poor end to the 2021-22 wet season. A small pocket of serious rainfall deficiencies remains near Elliott in the Barkly district.
NULL
Soil moisture
Root-zone soil moisture (soil moisture in the top 100 cm) for November was higher than average for most of Australia except south-west Western Australia which had average to below average soil moisture. Highest on record soil moisture was recorded for parts of New South Wales, northern Victoria, central and south-east South Australia, the central west of Northern Territory and north-west Western Australia.
In recent months, saturated soil conditions across south-eastern Australia have been a significant contributor to the severity of flooding and have also contributed to increased inflows into inland water storages.
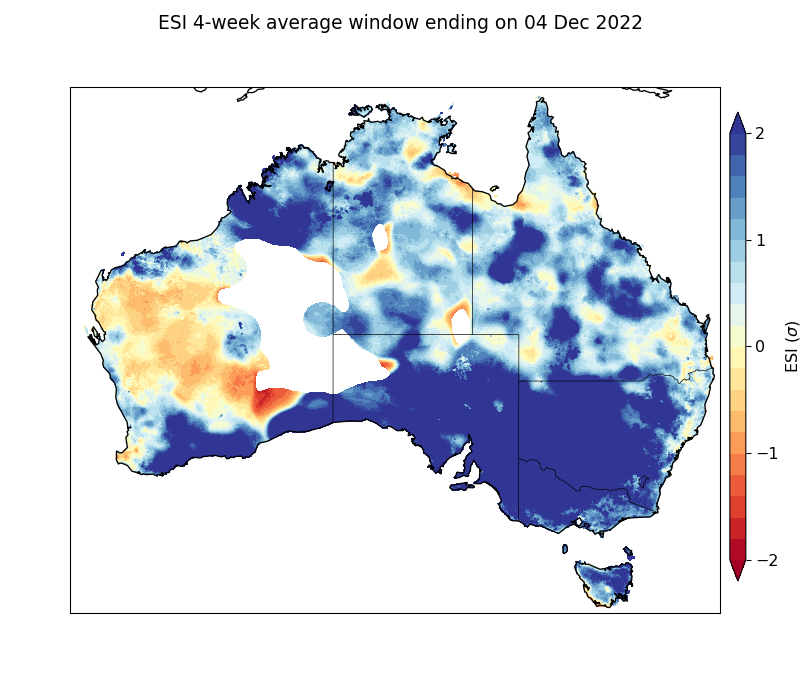
Evaporative stress
Evaporative stress for the 4 weeks ending 4 December 2022 decreased over much of the north of the Northern Territory, and along the south coast of Western Ausrtalia. Evaporative stress remains elevated for much of the Gascoyne and Goldfields districts, and parts of the South West, districts in Western Australia. See the journal publication for further details on calculation and use of evaporative stress index in drought monitoring.
- For Australia as a whole, November rainfall was the 10th-highest on record since 1900, and the Northern Territory, Western Australia and Victoria area-average rainfall were amongst their five highest on record.
- November rainfall was in the highest 10% of all years since 1900 for much of the northern tropics and large parts of the southern mainland.
- Rainfall was below average in north-eastern New South Wales and south-eastern Queensland, and in seasonally-dry areas of the Pilbara and Gascoyne in Western Australia.
- Rainfall across the north of the Northern Territory significantly eased rainfall deficiencies.
- Serious rainfall deficiencies (totals in the lowest 10% since 1900) for the period starting December 2021 remain for western Tasmania and part of south-west Western Australia, and eased slightly in November.
- Soil moisture was above average for most of Australia except for parts of Western Australia.
- Significant flooding continues to affect inland New South Wales, and along the Murray River.
- High streamflows were observed at many southern Australian sites, inland New South Wales and some sites in the north-west Western Australia.
- Low streamflows were observed mostly in south-west Western Australia and north-eastern Australia.
- At the end of November, Australia's total storage volume was 76.2% of full capacity.
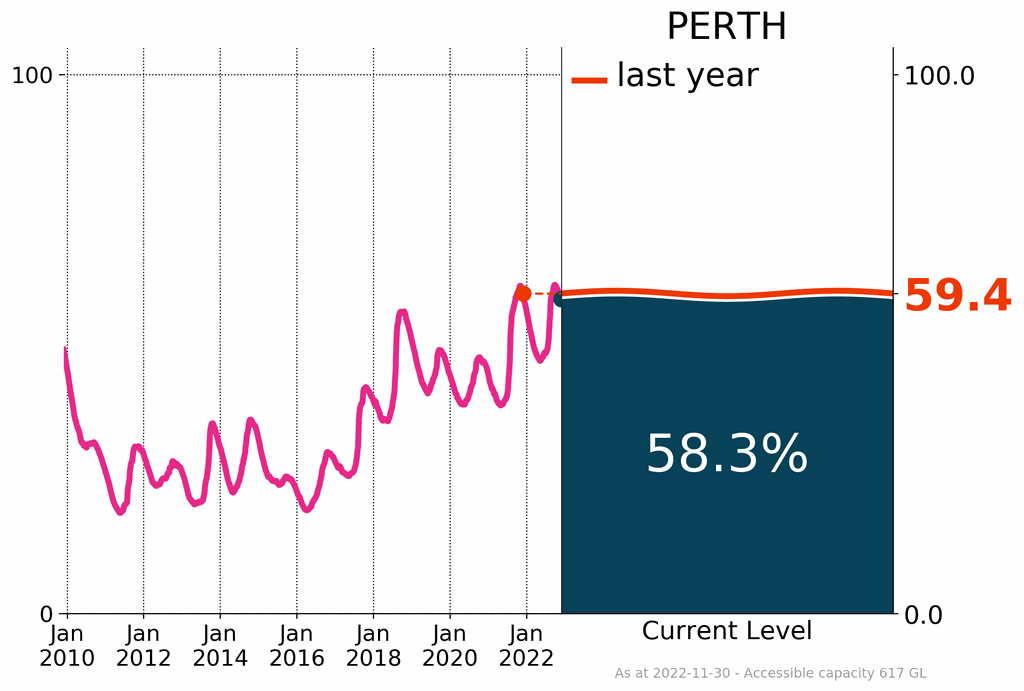
- Urban storages in all capital cities are above 81.9% of capacity except for Perth (58.3%).
- The combined storages in the Murray–Darling Basin were 99% full, up from 95% at the end of November 2021.
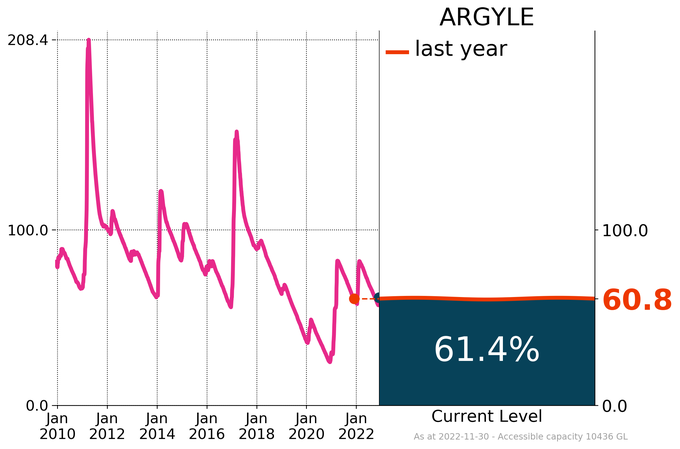
- Storages in Lake Argyle increased 1.8% from last month.
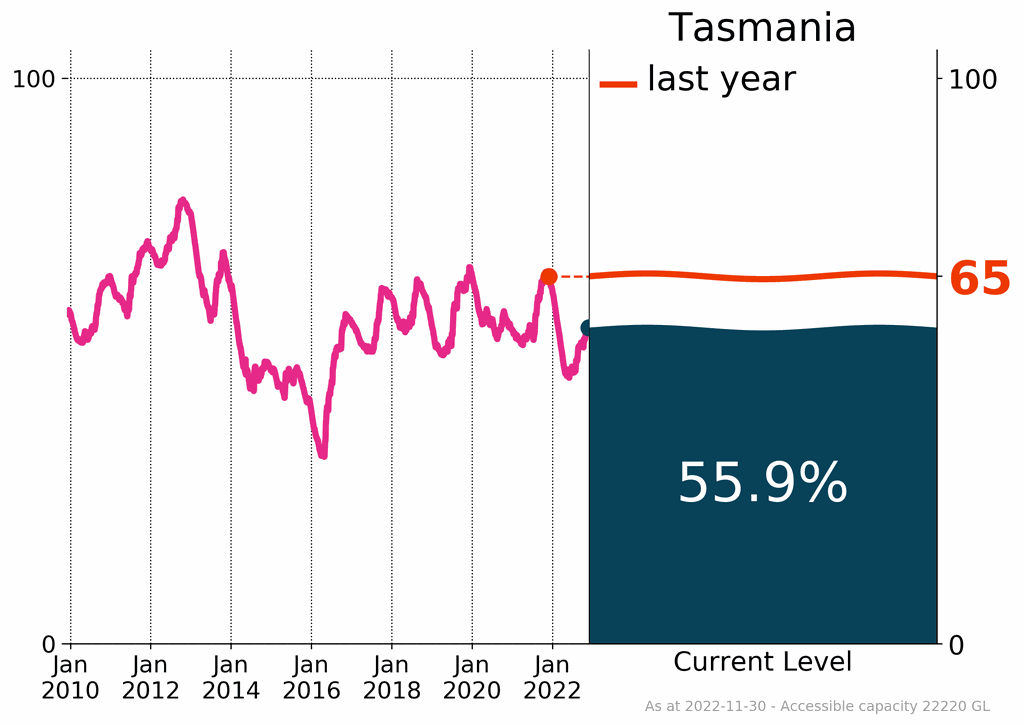
- Low storage conditions continue in some parts of central Queensland, central Tasmania and south-east New South Wales.
Low streamflows in south-west Western Australia
In November, streamflows were average at 14% of sites, mainly in western and eastern coastal areas in Australia. Below average streamflows were observed at 3% of the 880 sites, mostly associated with drier catchment conditions in south-west Western Australia.
With high rainfall and wet soils during November in southern and northern Australia, above to very much above streamflow (based on records since 1975) were observed in Victoria, South Australia, north and eastern Tasmania, most of inland New South Wales; north-west Western Australia and the Top End of the Northern Territory. Numerous flood warnings were issued for catchments across New South Wales and Victoria.

Overall high storage levels across the country, although pockets of low storage remain
In November, most of Australia except for the western part of Western Australia, north-eastern New South Wales and south-eastern Queensland received above to very much above average rainfall. This resulted in an increase in storage levels from October, particularly in southern Australia. By the end of November, the total water storage volume in Australia (across Australia's 306 public storages) was 76.2% of full capacity; slightly higher than the previous month and higher than the same time last year. The combined storages in the Murray—Darling Basin were 99% full, up from 95% at the same time last year. Despite most of the major storage levels being at high levels, there remains several pockets of low storage volumes—particularly in central Queensland, central Tasmania, and south-east New South Wales and some urban storages for Perth.

Perth's surface water storages were just above half capacity at the end of November at 58.3% (down from 59.4% at the same time the previous year). However, with the long-term decline of surface water inflows into storages, the city's water supply is generally more reliant on desalination and groundwater sources than surface water.
Despite above average rainfall during November in northern Australia, the storage volume in Lake Argyle were just above half capacity at the end of November at 61.4% (up from 60.8% at the same time the previous year) and higher (1.8%) than from the previous month.
With drier catchment conditions across south-western Tasmania in previous months, storages volume in Tasmania remain around half of full capacity (55.9%) which is slightly higher (1.5%) than last month but lower than last year.
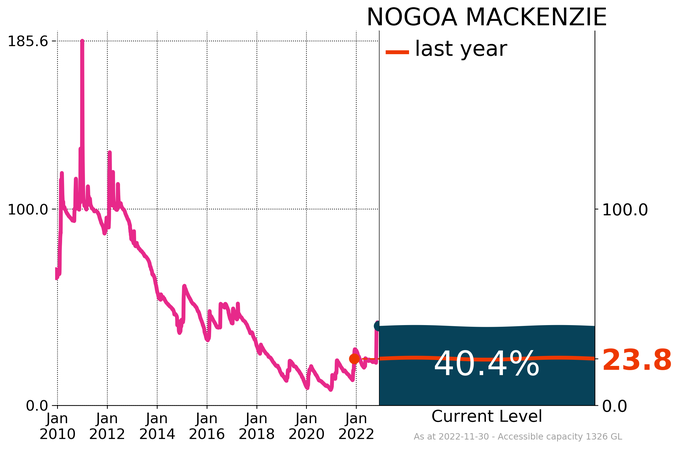
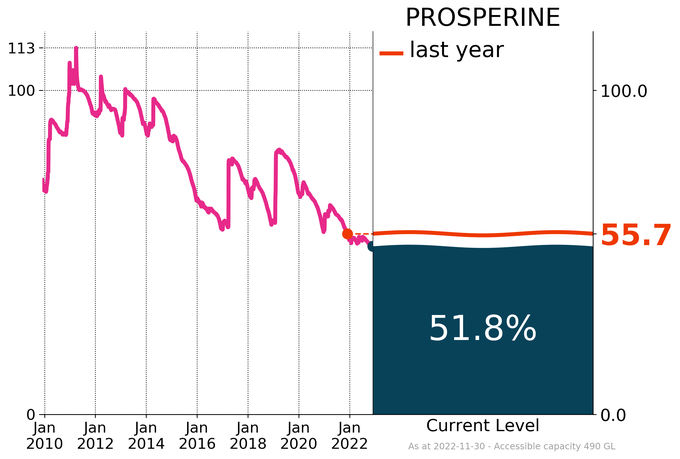
Water levels in the Nogoa–Mackenzie system in central Queensland remain low despite increasing to 40.4% by the end of November compared to 23.8% at the same time last year. On the north-east coast of Queensland, water storage in the Proserpine region was just above half capacity at the end of November at 51.8% (down from 55.7% at the same time the previous year).
Further information
Further detail on individual Murray–Darling Basin catchments can be found in the Murray–Darling Basin Water Information Portal.
An overview of streamflow, stream salinity, and storage levels for Drainage Divisions across Australia can be found in the Monthly Water Update.
Product code: IDCKGD0AR0
![]() Unless otherwise noted, all maps, graphs and diagrams in this page are licensed under the Creative Commons Attribution 4.0 International Licence
Unless otherwise noted, all maps, graphs and diagrams in this page are licensed under the Creative Commons Attribution 4.0 International Licence
