There are currently no formally monitored deficiency periods
During the absence of large-scale rainfall deficiencies over periods out to around two years' duration, the Drought Statement does not include any formally monitored deficiency periods. We will continue to monitor rainfall over the coming months for emerging deficiencies or any further developments.
Rainfall history
 Australian rainfall history
Quickly see previous wet and dry years in one (large) screen.
Previous three-monthly rainfall deciles map
See also: Rainfall maps | Rainfall update
Soil moisture details are reported when there are periods of significant rainfall deficits.
Soil moisture data is from the Bureau's Australian Water Resources Assessment Landscape (AWRA-L) model, developed through the Water Information Research and Development Alliance between the Bureau and CSIRO.
See also: Australian Water Outlook: Soil moisture
See also: Murray-Darling Basin Information Portal
Previous issues
Related links
Below average rainfall in parts of the south
Rainfall was below average to very much below average (in the lowest 10% of Julys since 1900) for:
- for western and central Tasmania
- northern and western Victoria, south-eastern South Australia and southern New South Wales
- pockets of coastal and inland Queensland
- an area of Western Australia's Pilbara extending inland and pockets of the south-west coast.
Rainfall was above average to very much above average (in the highest 10% of Julys since 1900) for:
- much of South Australia, a large area of central and eastern Northern Territory, southern and western Queensland and northern and western New South Wales
- an area of the Queensland tropical north coast
- an area of southern and central Victoria and parts of eastern Tasmania
- the Gascoyne region of Western Australia.
July was the third month of the dry season in northern Australia, and rainfall is usually low through to the start of the wet season in October.
Long-range forecast
The long-range forecast released on 1 August 2024, indicates that for August to October:
- rainfall is likely (60 to 80% chance) to be within the typical seasonal range for much of Australia, including coastal regions of New South Wales and Victoria
- rainfall is likely (60 to 80% chance) to be below average for much of the tropical north and south-western Tasmania
- wetter than average conditions are likely for parts of the south-east, central and far west
Long-term trends
State of the Climate 2022 reported a shift towards drier conditions across the south-west and south-east of Australia, particularly during the cool season months of April to October. There has been a decline of around 16 per cent in April to October rainfall in the south-west of Australia between 1970 and 2023, and around 9 per cent in the south-east since the late 1990s. This is due to a combination of natural variability on decadal timescales and changes in large-scale circulation caused by an increase in greenhouse gas emissions.
Deficiencies for the 6 months since February 2024
For the 6-month period since February 2024, areas with lowest on record, severe or serious rainfall deficiencies (record low rainfall totals or in the lowest 5% or 10% of periods, respectively, since 1900) extend along:
- parts of coastal south-west Western Australia
- agricultural regions of South Australia into western Victoria
- coastal South Gippsland in Victoria and north-eastern ranges into southern New South Wales
- the western half of Tasmania and Bass Strait Islands
Areas with lowest on record rainfall include parts of the Eyre Peninsula, York Peninsula and the south-eastern corner of South Australia extending into western Victoria, north-western Tasmania, and a small area near Albany in south-west Western Australia.
Compared to June, in south-west Western Australia deficiency regions have reduced in size, as the region received average to above average rainfall. Deficiencies in agricultural regions of South Australia have reduced in extent and severity, but lowest rainfall on record areas have expanded in the far south-east. In Victoria, deficiency areas have contracted and eased in the east, and they have intensified in the west of Tasmania.
Deficiencies for the 12 months since August 2023
For the 12-month period since August 2023, areas with lowest on record, severe or serious rainfall deficiencies (record low rainfall totals or in the lowest 5% or 10% of periods, respectively, since 1900) extend over:
- coastal margins of the north-west, an area of Pilbara and Gascoyne, and across the south-west corner of Western Australia including areas with lowest on record rainfall along the south-west coast
- agricultural regions of South Australia, south-west Victoria and much of Tasmania, including some areas with lowest on record rainfall.
Compared with June, in Western Australia lowest on record rainfall areas contracted in the south-west and part of the Pilbara and Gascoyne. For south-eastern Australia, there has been little change in the rainfall deficiency regions.
Deficiencies for the 15 months since May 2023
For the 15-month period since May 2023, areas with lowest on record, severe or serious rainfall deficiencies (record low rainfall totals or in the lowest 5% or 10% of periods, respectively, since 1900) extend across:
- areas of the south-west of Western Australia, Gascoyne and along the Pilbara and south-west Kimberley coast, including areas of lowest on record rainfall north and inland from Perth and in the far south-west
- fringes of the coast and islands of northern and southern Tasmania, parts of the agricultural regions of South Australia, particularly the Mid North district, Cape York, Kangaroo Island and the far south-east
- south-west Victoria which has a band of lowest on record rainfall along the coast
During July, the extent and severity of deficiency areas remained largely unchanged in the west and south-east of Australia.
NULL
Below average soil moisture in the south
July soil moisture deficiencies persisted in the south of the country, with below to very much below average soil moisture in:
- south-west Western Australia west of the Nullarbor
- central-west and south-east South Australia
- western Victoria
- central and northern Victoria into southern New South Wales
- western Tasmania
July rainfall across the south of the country eased soil moisture deficiencies in South Australia, central Tasmania and south-east Victoria. However, July rainfall was mostly close to average in the south-west corner of Western Australia, returning soil moisture deficiencies to that area.
Large areas of southern Australian agriculture rely on cool season rainfall and soil moisture to support seed germination, pasture recovery, and crop growth. Prolonged low root zone soil moisture limits plant growth and is an indicator of agricultural drought.
Severe evaporative stress in large areas of southern Australia
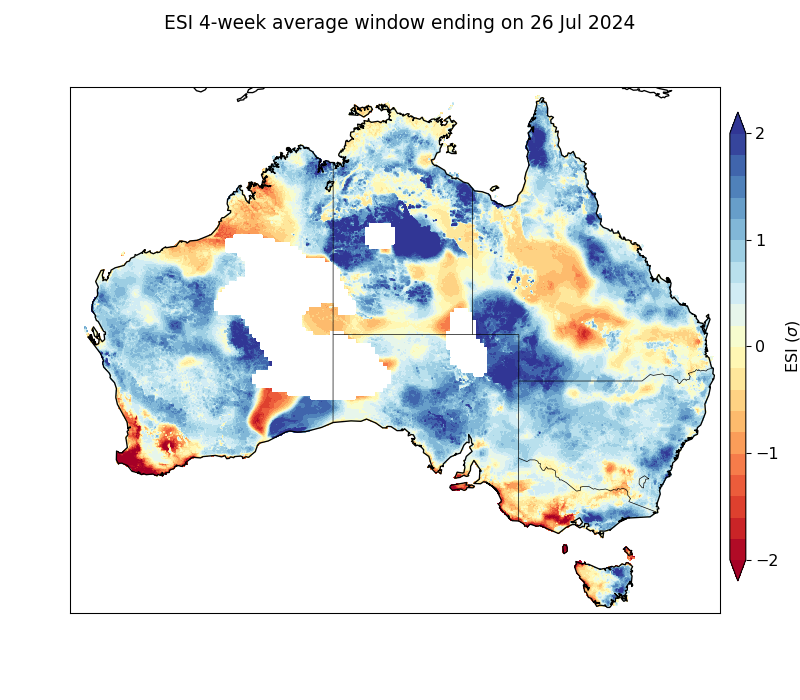
Evaporative stress for the 4 weeks ending 26 July 2024 was elevated (negative Evaporative Stress Index (ESI)) in:
- parts of south-west, inland and north-west Western Australia
- the south-east coastal fringe of South Australia
- south-west Victoria
- along the Victorian ranges into southern New South Wales
- north-west Tasmania
- much of inland Queensland and the Northern Territory
While vegetation moisture stress lessened in most areas over July, significantly elevated ESI values (less than −2) persisted in a smaller area in south-west Victoria and in an expanded area over south-west Western Australia.
The ESI is the standardised anomaly of the ratio of actual evapotranspiration to potential evapotranspiration and represents the influence of a combination of meteorological and land factors on drought conditions. A negative ESI is an indicator of vegetation moisture stress associated with agricultural and ecological drought. See this journal publication for further details on calculation and use of the ESI in drought monitoring.
Rainfall deficiencies and water shortages at the end of July
- July rainfall was below average for parts of northern and southern Western Australia, south-eastern South Australia, northern Victoria and southern New South Wales, western Tasmania, parts of north-eastern Australia.
- Recent rainfall deficiencies have been severe in areas of south-west Western Australia, the agricultural regions in South Australia, in western Victoria and north-eastern ranges into southern New South Wales, and in the western half of Tasmania. Longer-term deficiencies also persist in these areas.
- Soil moisture deficiencies continue in the south-west and south-east of Australia.
- Streamflow was low at a large proportion of sites in south-west Western Australia, western Victoria, South Australia and western Tasmania.
- Most storage levels were low in the west of Western Australia, some large storages were low in central Tasmania and many storages were 10 to 50% lower than this time last year in south-eastern states.
Low streamflow in the south-west of Western Australia, western Victoria and Tasmania
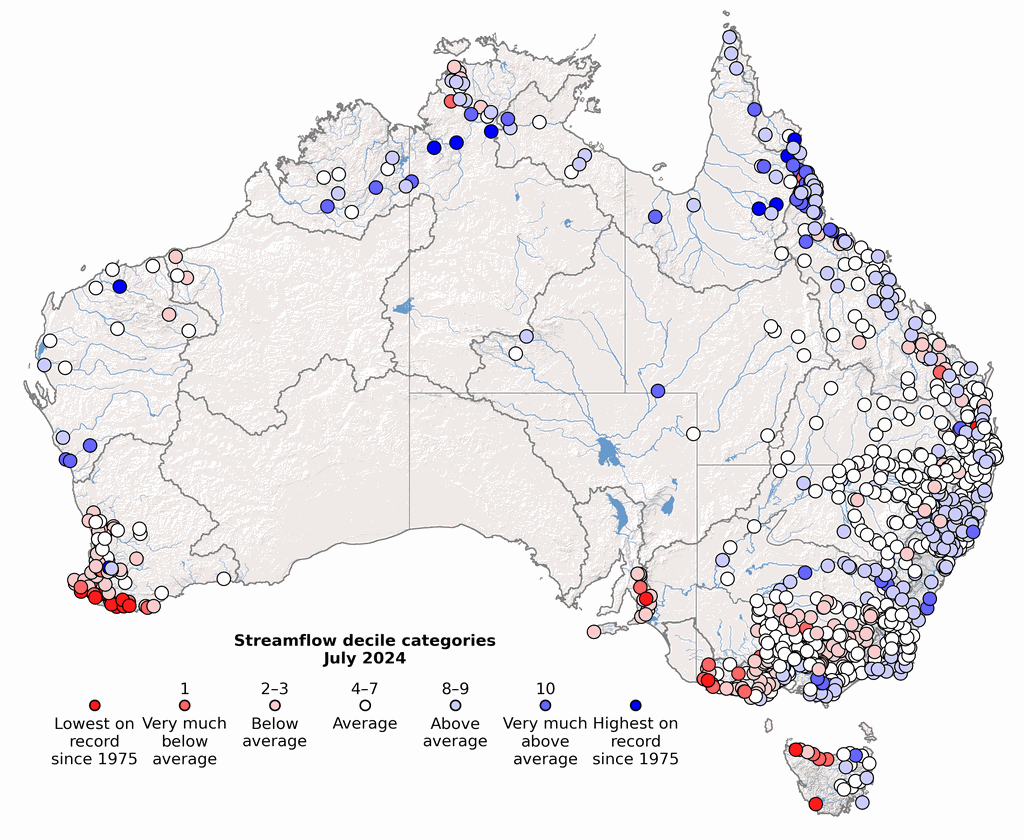
In July, above to very much above average (based on records since 1975) streamflow was observed at 26% of the 875 sites with available data. These were mostly in eastern and northern Australia, including the west of Western Australian where there was high antecedent soil moisture conditions in those catchments.
Below average streamflow was observed in July at 26% of sites. These were mostly associated with below average rainfall and dry catchment conditions. These were observed in:
- south-west of Western Australia
- western Victoria and South Australia
- western Tasmania
- southern New South Wales
- scatted sites in central Queensland
Very much below average streamflow was observed at 6% of sites (including 2% of sites with lowest on record), mainly in south-west of Western Australia, western Victoria, South Australia and western Tasmania.
Streamflow was average at 48% of sites across eastern Australia.
Low storage levels in the west of Western Australia, Southern Australia and Central Queensland
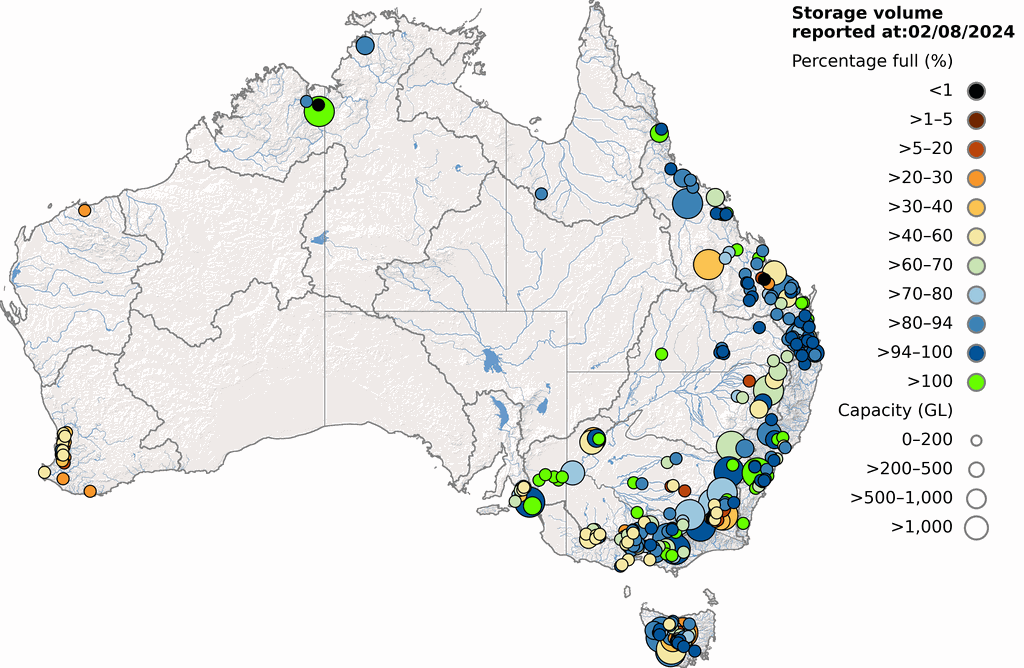
By the end of July, the total water storage in Australia (across 306 public storages) was at 73.9% of capacity, slightly higher (by 0.3%) than the previous month, and slightly lower than at the same time last year (by 4.8%). Despite Australia's overall high storage, volumes decreased in July for 144 public storages. Storages were relatively low in several regions including:
- central Queensland
- the northern Murray–Darling Basin
- south-east of New South Wales
- western Victoria, South Australia and central Tasmania
- urban areas of Perth in Western Australia.
The storage volume decreases were generally in regions that had below average rainfall or dry catchment conditions during July.
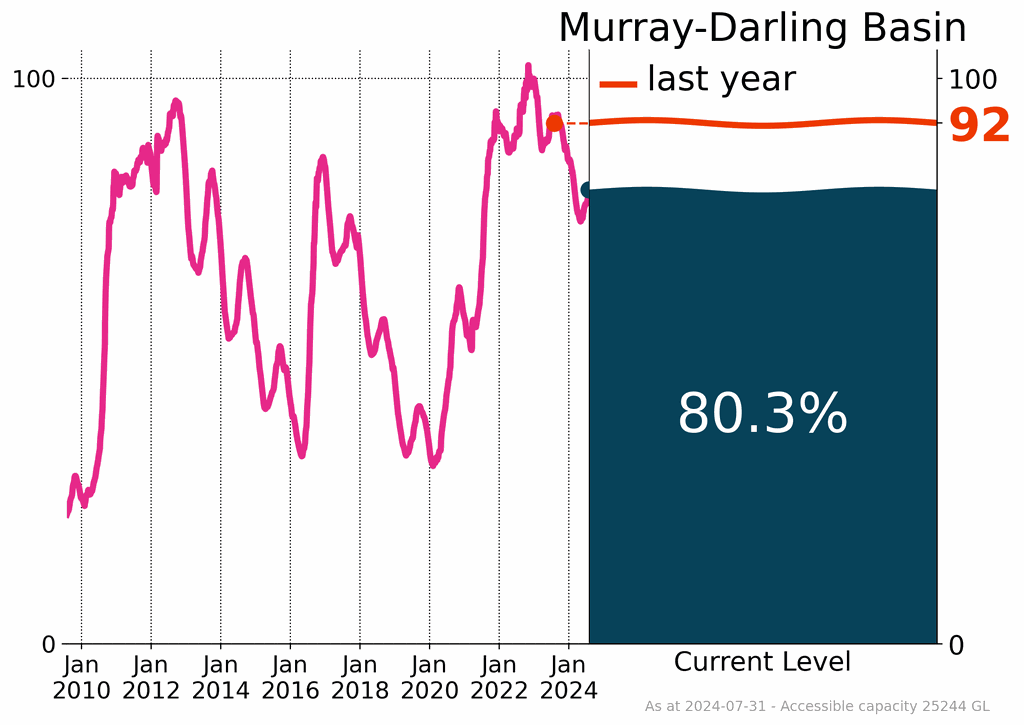
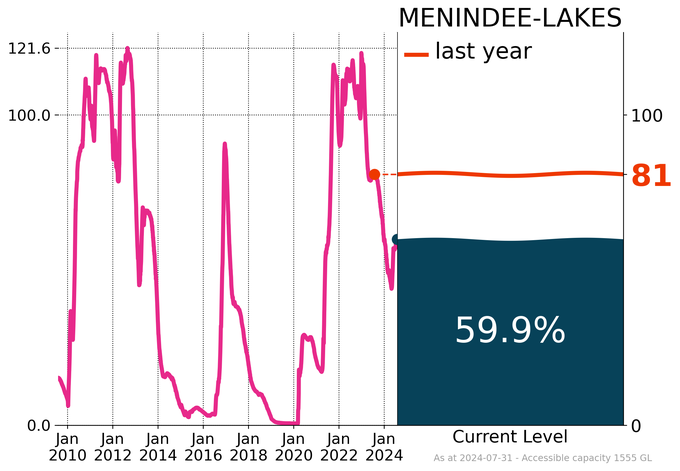
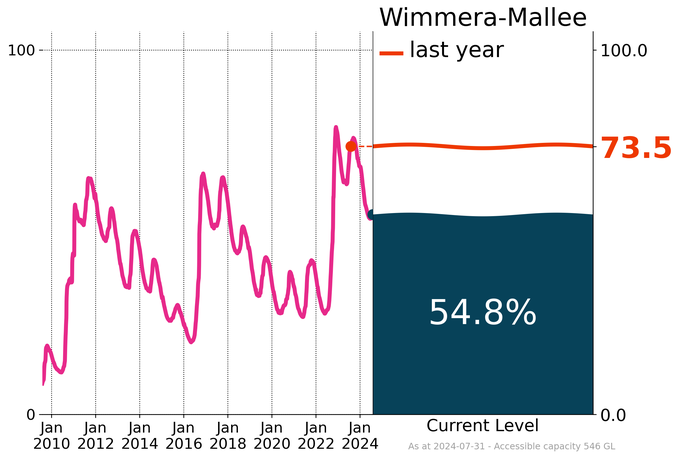
Combined storages in the Murray–Darling Basin were 80.3% full at the end of July, a 2.7% increase from June and a 11.7% decrease from the same time last year. Menindee Lakes, in the west of New South Wales was 59.9% full at the end of July, a 2.7% increase from June and a 21.1% decrease from the same time last year. The combined storages in the Wimmera–Mallee region of the Murray–Darling Basin were just above half full (54.8% of its capacity) at the end of July, mainly due to the below average rainfall during March to June.
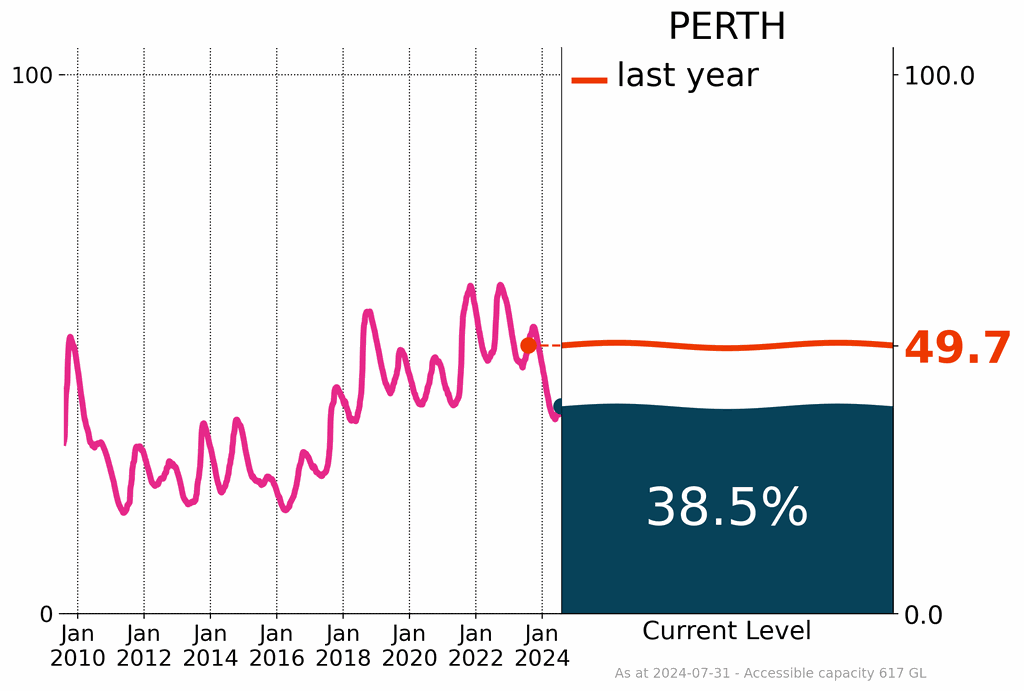
Average to below average July rainfall across south-west of Western Australia resulted in a slight increase in some storage levels. Perth's surface water storages were 38.5% full at the end of July, a 1.6% increase from June, and a 11.2% decrease from the same time last year. Long-term declines in surface water inflows to Perth's storages means the city's water supply is reliant on desalination and groundwater sources.
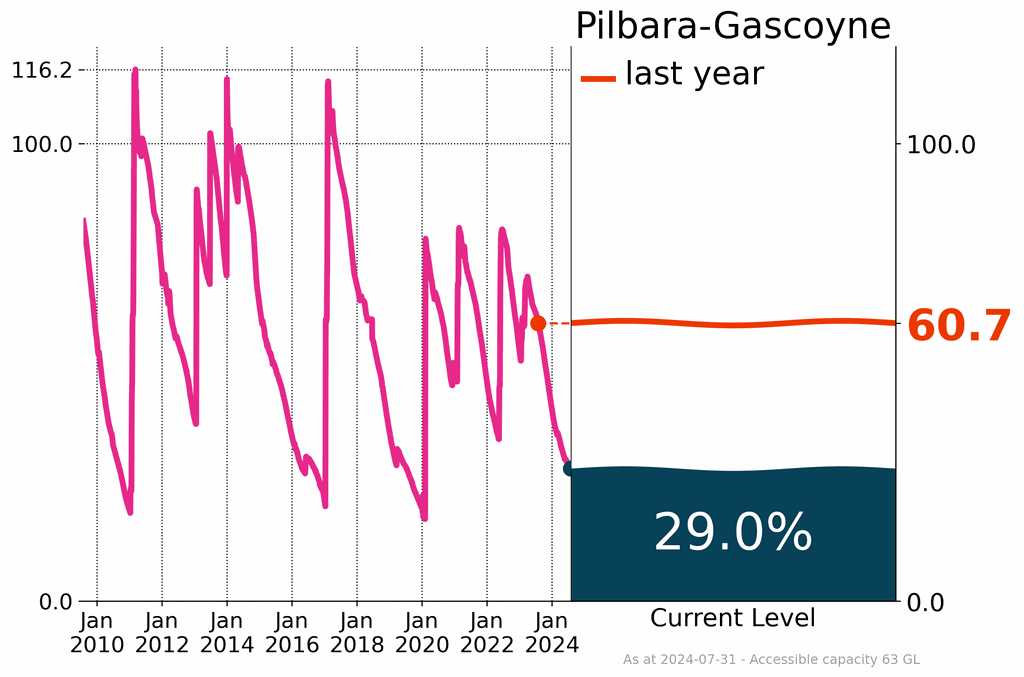
The Harding River storage in the Pilbara–Gascoyne drainage division was at 29.0% of capacity at the end of July, a 1.1% decrease from June and a 31.7% decrease from same time last year.
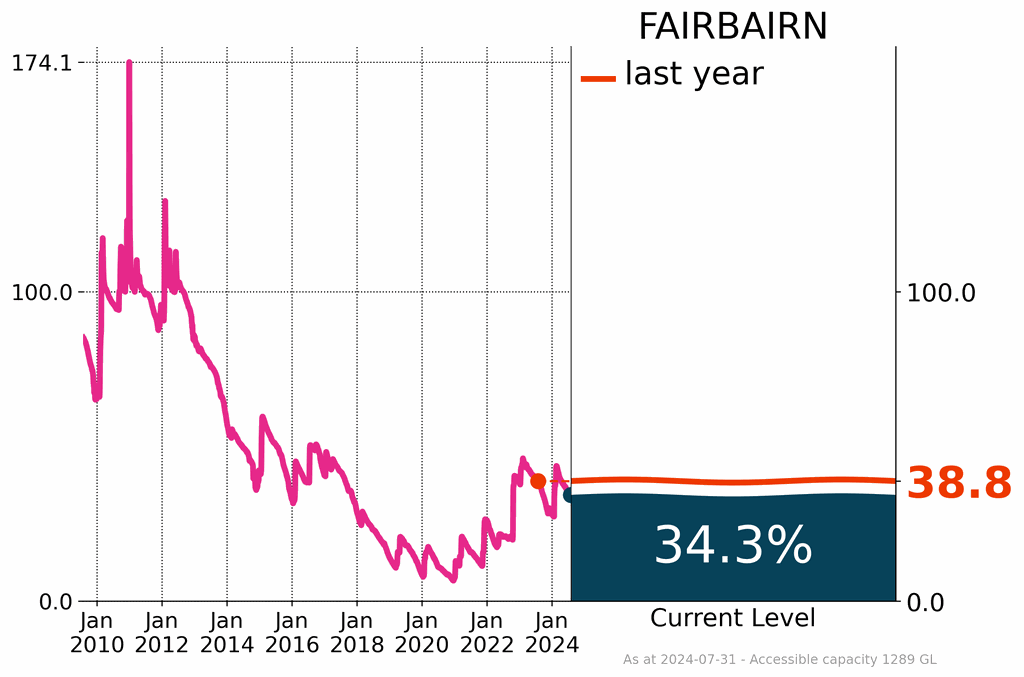
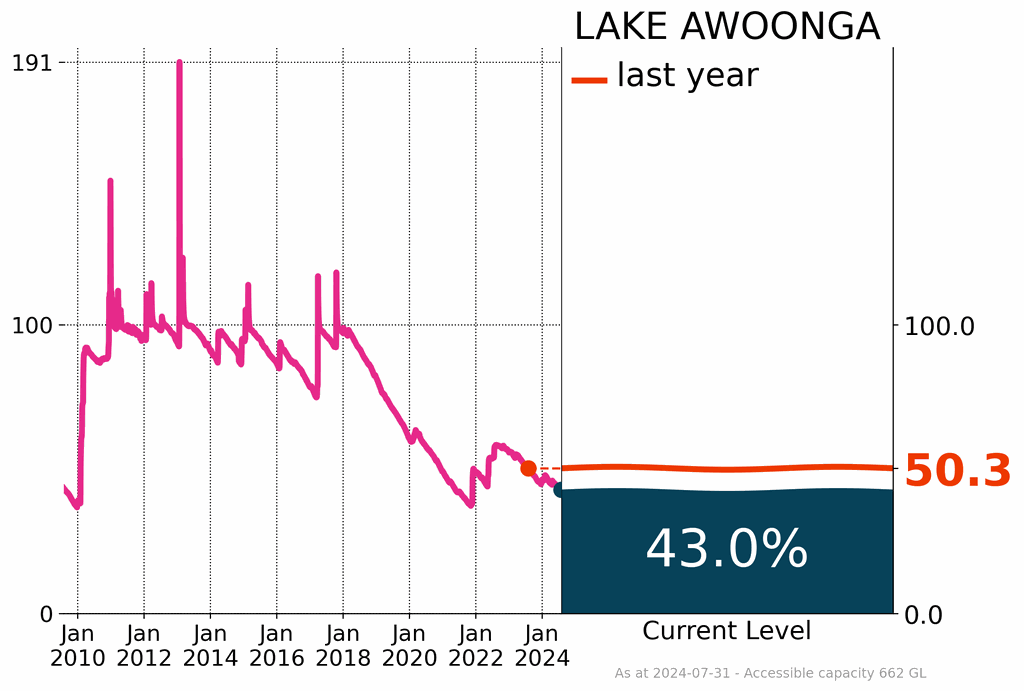
In central Queensland, water storage in Fairbairn was at 34.3% of capacity, a 0.9% decrease from June and a 4.5% decrease from same time last year. Water levels in the Lake Awoonga in south eastern Queensland remain low (43.0% full), at the end of June, a 0.8% decrease from June and a 7.3% decrease from the same time last year.
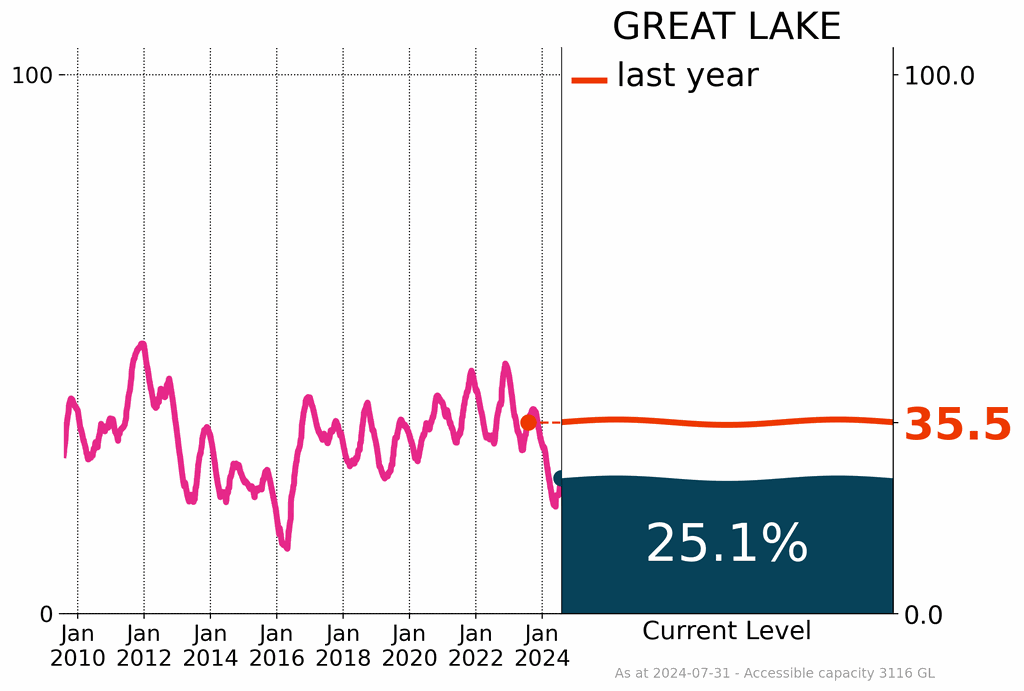
Water storage in Great Lake in central-northern Tasmania was 25.1% full at the end of the month, a 3.4% increase from June but a 10.4% decrease from the same time last year.
Product code: IDCKGD0AR0
 Unless otherwise noted, all maps, graphs and diagrams in this page are licensed under the Creative Commons Attribution 4.0 International Licence