
First issued: 17 April 2026
Australia's rainfall is influenced by more than just the El Niño–Southern Oscillation, or ENSO. Factors like the Indian Ocean Dipole, localised sea surface temperatures, and long-term climate trends also play a role.
The impact of every El Niño is different. How strong an event is, does not always match the strength of its impact on our weather and climate.
Sometimes a weak El Niño can lead to significant impacts on Australia's rainfall and temperature, while a stronger event may have fewer noticeable impacts.
The El Niño–Southern Oscillation is currently neutral – neither La Niña nor El Niño. While models suggest a possible shift to El Niño later this year, its timing and strength is less certain.
Our long-range forecast is the best guide to Australia's likely rainfall and temperature patterns in the coming months. It responds to all the ongoing changes in our climate systems and we update it regularly.
What are the chances of El Niño developing?
Sea surface temperatures in the central tropical Pacific have been progressively warming recently.
Bureau and other models forecast the tropical Pacific to continue warming in the coming months to reach levels consistent with El Niño. The models vary in the timing at which El Niño thresholds may be reached. Some suggest as early as May, while others show a slower warming with thresholds not being met until July.
These sea surface temperatures are only one indicator of ENSO events.
We would also need to see signs that the atmosphere is shifting towards El Niño levels including trade winds, pressure and cloud patterns. This ocean-atmosphere coupling (where the ocean and atmosphere act to reinforce each other) is required for a sustained El Niño state.
We monitor oceanic and atmospheric conditions as well as model forecasts as they evolve.
How strong is this event likely to be?
At this time of the year, forecasts for ENSO conditions in winter and spring are typically less certain due to the autumn predictability barrier. This means it is too early to assign high confidence to the forecasts.
You may sometimes see El Niño events described as 'super' or 'rare' but these descriptions are not used in our El Niño–Southern Oscillation classifications.
Rather than being classified as rare or unusual, El Niño and La Niña events are part of a natural cycle in the Pacific Ocean that can affect global weather. Watch a video about Understanding the El Niño–Southern Oscillation (ENSO).
There is a chance that models can overestimate seasonal fluctuations in the oceans and atmosphere when looking too far ahead. We expect a clearer picture later in autumn.
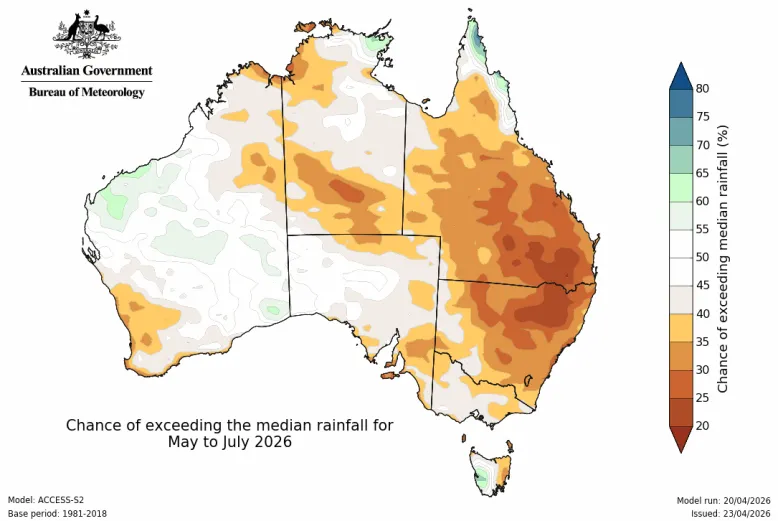
May to July forecast
The current long-range forecast for May to July 2026 (issued 23 April) shows:
- rainfall is likely to be below average for much of eastern and parts of south-west Australia
- for most other areas, there is no clear signal for either wetter or drier conditions, meaning there are roughly equal chances of above or below average rainfall
- May marks the beginning of northern Australia's dry season when most of the tropical north, except for the east coast of Cape York Peninsula, typically receives very little rainfall.

What does this forecast mean for rainfall?
While there's an increased chance that May to July rainfall will be below average in parts of eastern Australia, a range of outcomes are still possible.
Visit the long-range forecast and select your location to explore the chances of possible amounts of rainfall for your area.
Watch our video to learn more about using the long-range forecast to find out how much rainfall you're likely to get.
Video: How much rainfall will I get?
Here we're looking at the rainfall forecast for Bathurst, New South Wales for August to October 2025. The shaded bars in the graph show the chance of rainfall totals ranging from low to high.
Deciles 1 and 2 represent the lowest 20% of rainfall that Bathurst has observed in the past across August, September and October, which here is anywhere up to around 93 mm.
At the other end, deciles 9 and 10 show the highest 20% of that historical range. That could be anything above 224 mm.
You could look at these deciles as buckets. The smallest bucket represents historically low rainfall totals in Bathurst from August to October. The largest bucket represents historically high amounts of rainfall.
This forecast is showing it's more likely that the total amount of rainfall will be in the mid to higher ranges over these 3 months.
View our other spotlight videos for more tips on using the long-range forecast, and visit our website for the latest updates.
When was the last El Niño?
A moderate to strong El Niño developed from spring 2023 and continued into early 2024.
Its development coincided with a strong positive Indian Ocean Dipole, and August to October 2023 was Australia's driest 3-month period on record.
However, El Niño events typically have less influence during the summer with 2023–24 being no exception. Between December 2023 and March 2024 widespread storms affected parts of the east coast, and 4 tropical cyclones impacted northern Australia – bringing widespread above average rainfall.
A history of ENSO events is available on our website.
What would an El Niño event mean for the winter–spring forecast?
The forecast state of the Pacific Ocean is likely to be an influence in the long-range forecast.
Historically, El Niño has generally had a drying influence over areas of central and eastern Australia, but ENSO is only one part of a complex system that impacts global weather and climate and all events are different.
The long-term drying trend over southern Australia in recent decades is also likely to be a contributing factor.
While models show an increased chance of El Niño forming later this year, any impact on Australia's winter–spring rainfall will depend on many factors.
Follow the long-range forecast for the latest information. We update long-range forecasts regularly:
- 1 and 2-week forecasts are updated daily
- monthly and seasonal forecasts are updated weekly.