
It’s what we wonder about as we plan each day: 'Is it likely to rain today?' The daily rainfall forecast has the answer. Let's take a closer look so you're across all the information it contains.
Cloudy with a chance of ...
Weather forecasts describe likelihoods, not certainties.
Rainfall forecasts are based on many weather models, both Australian and international.
We run the models on our supercomputer and forecast the weather up to a week ahead. Models create a virtual planet Earth, simulating the atmosphere, ocean, land surface and sea ice, and use mathematical equations to predict future weather.
Each model produces different possible outcomes. Our forecasters apply expertise and local knowledge to assess these outcomes, then communicate the result as a forecast.
Rainfall forecasting aims to answer the most asked questions: Is rain likely at my location? How much rain might fall?
Rainfall forecasts are probabilistic. This means they provide a possible range of rainfall amounts, and then the chance of receiving at least that amount of rain. This is different to a maximum or minimum temperature forecast, which is represented by one single number.
By understanding the numbers in our rainfall forecasts, you can better plan your day.
What makes up the rain forecast
Depending on the weather situation, rainfall amounts over short distances can vary a lot.
Because of this variation, rainfall forecasts show a range of possible amounts, and the likelihood of reaching those amounts.
This is unlike maximum or minimum temperature which doesn’t vary by as much over short distances.
When rain is forecast, the website and BOM Weather app show the possible rainfall range as 2 numbers.
The first number has a high (75%) chance of occurring, while the second number has a low (25%) chance of occurring. This range has been chosen because it captures the range of rainfall scenarios that are most likely to occur, and the confidence in that forecast.
This is based on our meteorologists' assessment of a range of computer models. We also take other factors into account such as local influences.
Take the following as an example:
The forecast for Port Augusta shows a 75% chance of at least 7 mm of rain and a 25% chance of at least 25 mm of rain.
In this example, the forecast rainfall range of 7 to 25 mm means:
- There is a high chance (75%) of receiving at least 7 mm of rain.
- There is a low chance (25%) of receiving at least 25 mm of rain.
For extra detail, the 'Show more about today' section also displays the medium (50%) chance of at least a certain amount of rain.
While the rainfall range shows the most likely rainfall range at a location, it is important to remember that amounts of rain outside of this range are still possible.

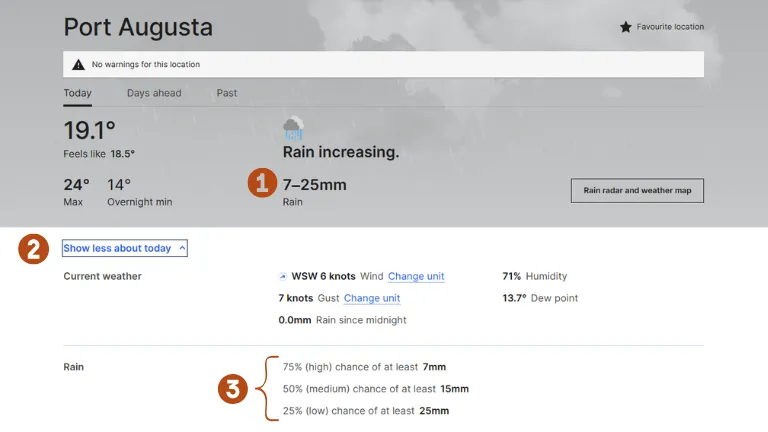
The forecast for Port Augusta shows a 75% chance of at least 7 mm of rain and a 25% chance of at least 25 mm of rain (1). In the expanded 'Show more about today' (2) section, the Rain row (3) displays the low, medium and high chance of rain forecast amounts.
Not all ranges are showing
You may not always see the 75%, 50% and 25% chances in the Rain section.
Sometimes, only the 25% and 50% chances, or just the 25% chance of rainfall will be displayed.
These will only be shown when the measurable rain threshold of 0.2 mm at these percentages is met. This 0.2 mm amount is based on the rain gauge we use.
Let's use the Boonah forecast below for chances of very low rainfall:
- a high (75%) chance of at least 0.05 mm
- a medium (50%) chance of at least 0.1 mm
- a low (25%) chance of at least 1 mm.
In this scenario, the 75% and 50% chances will drop away as both are less than 0.2 mm, and only the 25% chance will be displayed.

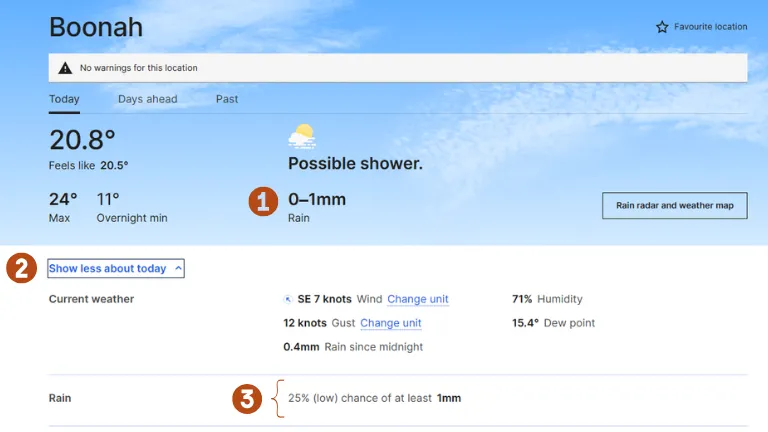
The forecast for Boonah shows a small amount of rainfall is possible (1). In the expanded 'Show more about today' (2) section, the Rain row (3) displays the low chance of rain forecast amount. The 75% and 50% ranges are not showing as these are less than the 0.2 mm threshold.
A forecast of no rain
When rain is unlikely, the forecast will show 'No rain'.
This occurs when the high (75%), medium (50%) and low (25%) chances are all less than the measurable rain threshold of 0.2 mm.
However, you might still see a percentage chance, such as very high (95%). This is to provide extra detail to help understand the level of confidence that no rain will be observed.
In the hourly forecast table you will see 'no rain' expressed as 0 mm.
So why don't we say there's a 5% chance of 0.2 mm?
We lead with the chance of no rain to emphasise that no rainfall is the most likely outcome.
Community research and feedback shows us that when we talk about chance of rain many people ignore the percentage and focus on 'rain'. This means people are more likely to notice 'chance of 0.2 mm', rather than there being a very high chance of no rain.
Why type of precipitation matters to the forecast
There are several factors that explain why the rainfall range can be quite small, and in some cases quite large. The type of precipitation plays a major part in this.
We generally see 2 types of precipitation: convective and stratiform.
Convective precipitation
Convective precipitation is associated with showers and thunderstorms. These often produce more isolated and variable bursts of rain.
As a result, observed rainfall is not uniformly distributed. A heavy shower or severe thunderstorm may pass directly over a town or suburb, producing a large amount of rain. The next town or suburb over may receive nothing at all.
When convective precipitation is forecast, the rainfall range tends to be larger, for example 5–50 mm. This accounts for the possibility that some areas could receive a little or a lot, depending on where showers and thunderstorms develop. In this scenario, keeping an eye on the radar and any Severe Thunderstorm Warnings will help you to see where rain is likely in the upcoming period.
This is typical during the warmer months, when thunderstorms are common over northern and eastern Australia.
Stratiform precipitation
Stratiform precipitation is associated with 'layered' clouds found in the low and middle levels of the atmosphere.
These clouds tend to produce more uniform and widespread rainfall. As a result, observed rainfall will vary less between locations.
When stratiform precipitation is forecast, the rainfall range tends to be smaller, for example 5–10 mm. This tells us that we can have a higher level of confidence of a narrower band of rainfall scenarios. However, rainfall totals outside this range are still possible.
This is typical during the cooler months, when cold fronts and northwest cloud bands are common over southern Australia.
Why rainfall forecasts can sometimes change
When the forecast extends beyond a few days, there are still a range of scenarios possible. Computer model outputs can vary, and depending on the weather situation this can produce vastly different rainfall amounts. For example, one computer model may be forecasting a rain band, while another has clear skies.
Newer observations and information feed into computer models leading to updated rainfall forecasts. As confidence in a particular scenario grows due to a shorter timeframe, a human forecaster can add their own skill and expertise. This includes knowledge of local topographic effects, converging winds and model biases.
It's always best to regularly check for rainfall updates and warnings.