
Our cyclone warning services
Tropical cyclones are dangerous storms that threaten lives, property and infrastructure. To help keep communities safe, we provide:
- 24-hour tracking of developing and active tropical cyclones
- a 7 day forecast of tropical cyclones around Australia
- Tropical Cyclone Advice, including watches and warnings, for communities likely to be affected
- maps that show forecast tracks of cyclones
- technical bulletins and data files for specialists.
For information to help you prepare, respond and recover, visit the National Emergency Management Agency.
Australia's role in global cyclone monitoring
An international network of Regional Specialised Meteorological Centres and Tropical Cyclone Warning Centres monitor and warn about tropical cyclones around the world. This global effort to protect communities is coordinated by the World Meteorological Organization.
For an international map featuring current cyclones and other severe weather, visit the World Meteorological Organization's Severe Weather Information Centre website.
Australia's area of responsibility
We're part of this global effort, responsible for warnings, advice and information for tropical cyclones affecting the Australian region.
This includes the coastal waters and land areas of Australia, incorporating:
- Christmas Island
- Cocos (Keeling) Islands
- Lord Howe Island
- Norfolk Island.
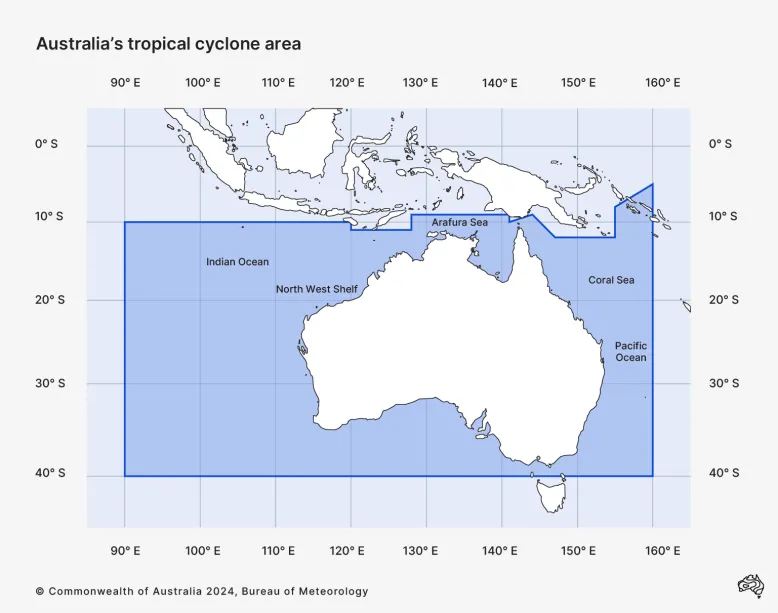
Australia's area of responsibility for cyclone tracking and warnings
Advice – watches and warnings
We issue a Tropical Cyclone Advice when a tropical cyclone is likely to cause winds at 63 km/h or greater (gale force) over Australian communities within the next 48 hours.
For each coastal community in the forecast path, this advice includes a:
- Tropical Cyclone Watch, updated every 6 hours when gales are expected to start within 24–48 hours
- Tropical Cyclone Warning every 3 hours when gales are expected within 24 hours or already happening.
For the latest Tropical Cyclone Advice, see Warnings and alerts.
About track maps
We issue a Tropical Cyclone Forecast Track Map for each tropical cyclone:
- in the Australian region, or
- likely to affect communities around Australia.
The map shows:
- forecast movement – a shaded area indicates where the cyclone centre may move
- intensity
- watch or warning zones.
If there is a watch or warning for the tropical cyclone, the map is issued at the same time and reflects all the information in that advice.
Video: Understanding tropical cyclone forecast track maps
We keep you informed when a tropical low or tropical cyclone forms, or is expected to form, through our tropical cyclone 7 day forecast.
The easy‑to‑follow forecast shows the anticipated location and the chance a tropical low will develop into a tropical cyclone up to 7 days in advance.
When a tropical cyclone is forecast to impact coastal communities within the next 48 hours, we issue a tropical cyclone advice and a tropical cyclone forecast track map. The tropical cyclone advice tells you the expected impacts and includes recommended actions from emergency services.
The track map shows important information about the cyclone's forecast movements, intensity and its potential areas of impact, to help you prepare. Let's take a look at how the track map works.
The first step is tracking where the cyclone has been and how strong it is. The number in the centre of the cyclone symbol is the intensity category of the cyclone. The categories range from 1 to 5. The higher the number the stronger the intensity, with category 5 being the most severe. Coloured circles show the extent of damaging, destructive and very destructive wind gusts.
The next step is to predict where the cyclone may go and estimate its likely intensity and likely time of arrival at locations in its path. The centre line with the arrows shows the cyclone's most likely path. Either side of this line, the grey zone shows where the cyclone centre could be in the next 72 hours. Impacts can extend beyond the grey zone, so be prepared for any sudden change in the cyclone's predicted path.
Finally, the track map also includes wind warnings for nearby areas.
The darker orange shading shows the warning area that might experience gale force or destructive winds within the next 24 hours. The lighter orange shading shows the watch area where gale force or destructive winds might occur within the next 24 to 48 hours.
You can access the tropical cyclone 7 day forecast, track maps and advice on the Bureau's website so you can prepare and stay safe during a tropical cyclone. Stay up to date with the latest forecasts and warnings on the Bureau's website or BOM Weather app. Activate notifications for the latest warnings in your area.
How to read a Tropical Cyclone Forecast Track Map
Step 1 – Check your location
Check whether your location is in:
- the forecast path (grey line and arrows)
- a warning area (dark orange) – gale-force or stronger winds are expected in the next 24 hours
- a watch area (light orange) – gale-force or stronger winds might happen in the next 24–48 hours.
You can still be at risk if you are outside the range of possible tracks (grey cone).
Step 2 – Follow the cyclone track
The track on the map shows:
- where the cyclone has been (black line and arrows)
- its current location and intensity (blue text)
- its most likely track for the next 72 hours (grey line and arrows).
Step 3 – Check cyclone intensity and wind impact
To check the forecast intensity:
- along the track, look for the cyclone symbols with time and date
- the number in each symbol shows the tropical cyclone intensity category.
Higher numbers indicate more intensity. Category 5 is the strongest.
Coloured circles show the radius of:
- the very destructive core (dark red)
- destructive winds (red)
- gale-force winds (light red).
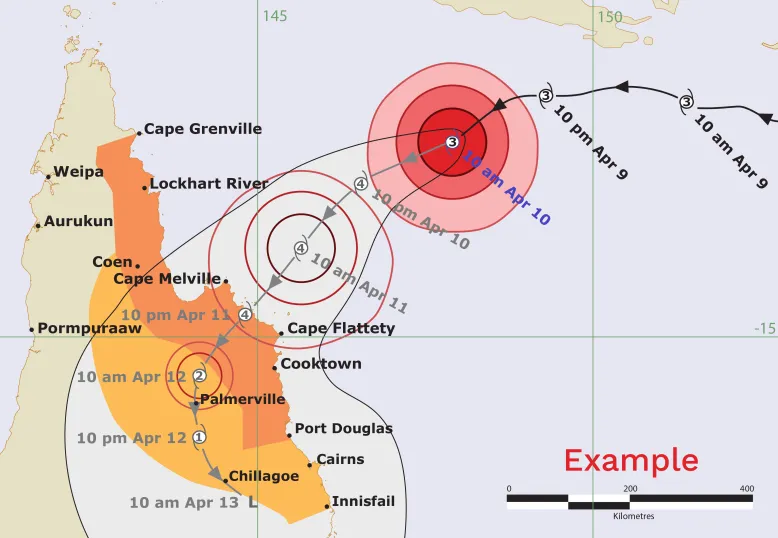
An example of the Tropical Cyclone Forecast Track Map
Forecast, bulletins and data
We provide a range of information to help Australians prepare for and understand cyclone activity in our region. This includes a 7 day forecast, bulletins and data files.
7 day forecast
We issue the 7 day forecast:
- twice daily all year around for Australia's area of responsibility, and
- more frequently when there is an active watch or warning.
For each significant tropical low or cyclone, the forecast includes a:
- map showing the likely location up to 7 days ahead, updated at least twice daily
- table giving the likelihood that it will be a tropical cyclone at each time step
- description including key points about its expected development.
Seasonal planning
We provide detailed seasonal information for Australia and the South Pacific, including:
- typical numbers of tropical cyclones
- peak season frequency
- heat maps
- recent trends and projections.
This helps with preparation and planning, ahead of and during the tropical cyclone season.
Technical bulletin
Our Tropical Cyclone Technical Bulletin communicates technical details about a cyclone for specialists. This formatted text bulletin includes data and scientific commentary. It's issued once every 6 hours during the life of the cyclone.
Cyclone data in XML
Analysed and forecast data for tropical and extra-tropical cyclones is available in a standard format – Cyclone XML (CXML). This format can be read by humans and most automated applications.
CXML products are issued at the same time as the Tropical Cyclone Technical Bulletin.
You can search the product catalogue for tropical cyclone CXML bulletins using product identifier codes for these states and territories. For more details, visit the CXML page.
Service level specification for tropical cyclones
This document describes our publicly available tropical cyclone services within the Australian Region. It also outlines some other services we provide to support emergency management, aviation, and meteorological services in neighbouring countries.