Delivering accurate and timely forecasts
Measuring the accuracy and timeliness of our forecasts is a key part of assessing how we are performing. We do this by comparing:
- forecasts to actual weather data recorded by our observation network, and
- when we issued forecasts with timeframes we set for delivery. Find out about timeliness of our forecasts.
Improving accuracy
To improve the accuracy of our forecasts, we:
- research the atmosphere to improve understanding
- improve the computer weather models we use to produce forecasts
- increase the number and type of observations used by these models
- build the skill and knowledge of our forecasters, staying up to date with the latest science.
Temperature forecasts
Temperature forecasts are considered accurate if they were within 2 °C of actual temperatures.
For 2025–26, next day maximum temperature forecasts were accurate 91.0% of the time. Overnight minimum temperature forecasts were accurate 83.3% of the time.
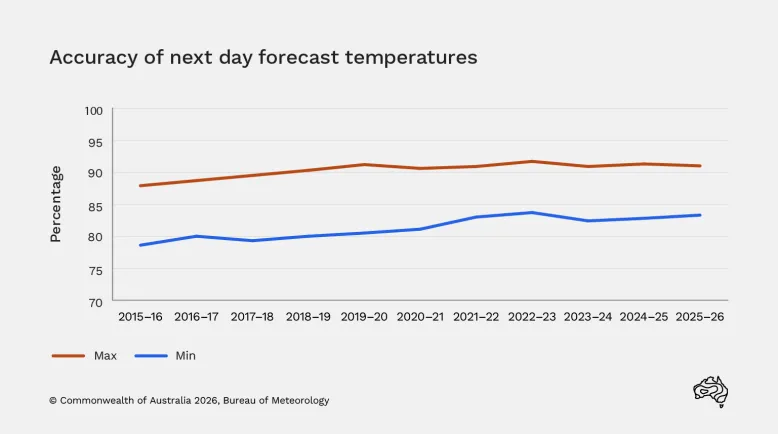
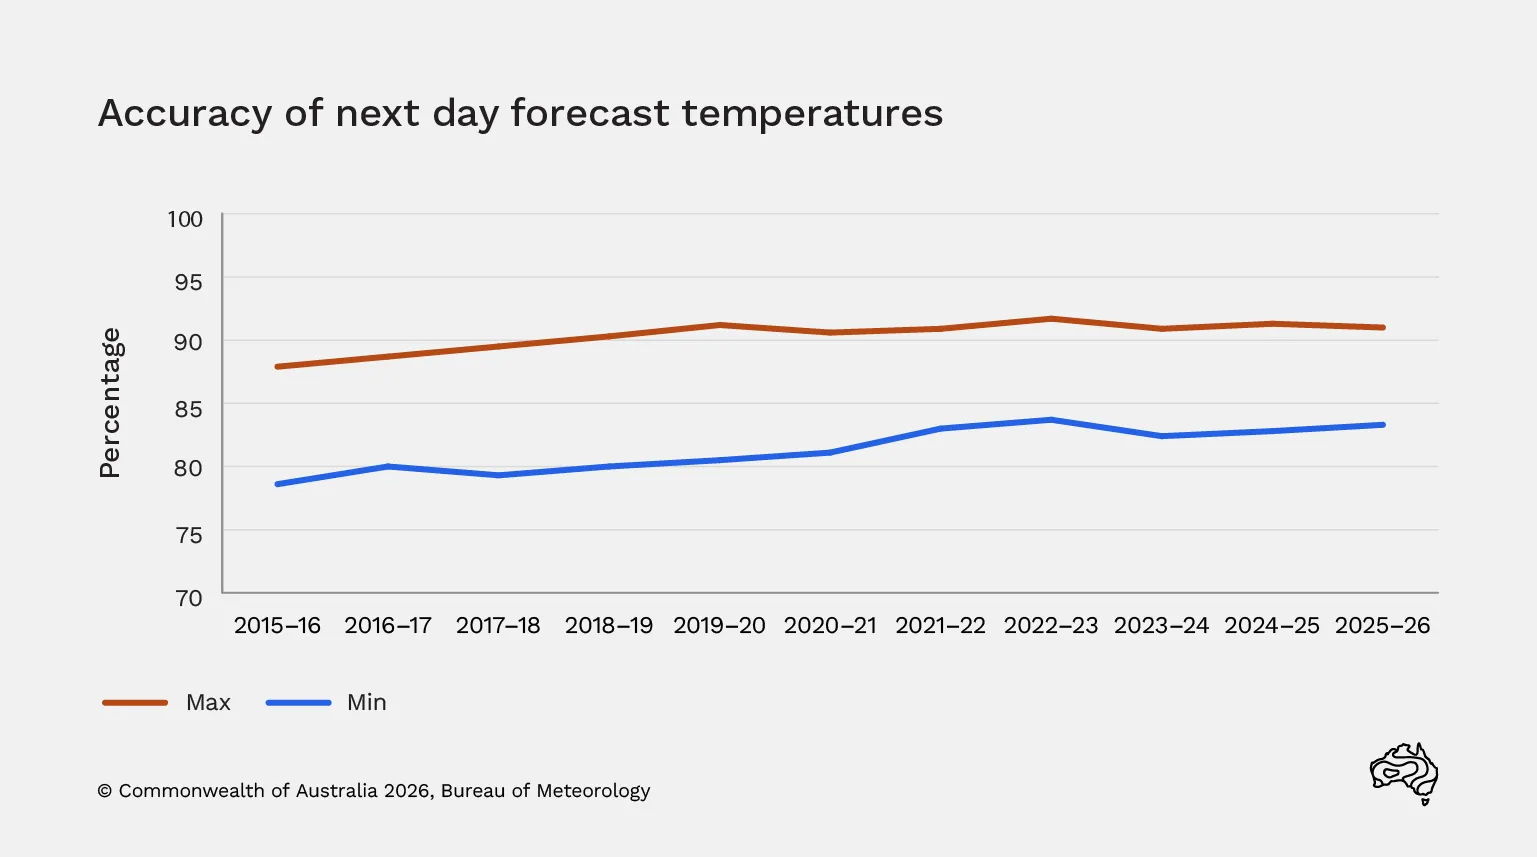
Forecast maximum and minimum temperatures for the next day that were accurate to within 2 °C, across 500 locations with reliable observations
Rainfall forecasts
Temperature and wind are often similar across large areas, but rainfall can vary significantly over short distances. A shower may bring heavy rain to one place while nearby areas receive little or none. That's why our forecasts include information about the possible rainfall range.
The possible rainfall range indicates the rain that a location may receive. An example of a possible rainfall range is 2–6 mm. We say there is a:
- 75% chance of more rain than the lower value in the range when it's above zero, and
- 25% chance of more than the higher value.
For our next day rainfall range forecasts in 2025–26, the actual rainfall was greater than the lower forecast value 79% of the time. Since this is close to the ideal target of 75%, it indicates our forecasts were reliable.
Actual rainfall was greater than the higher forecast value 20% of the time. Again, this is close to the ideal target (25%), indicating that the upper range of our forecasts is reliable.
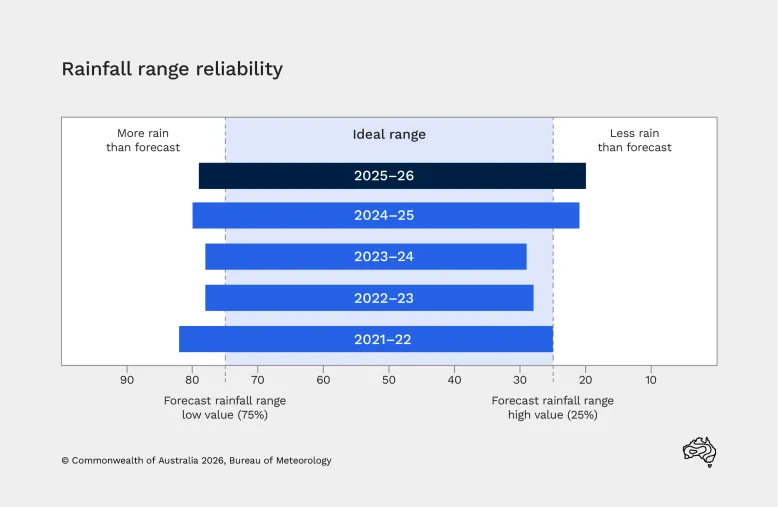
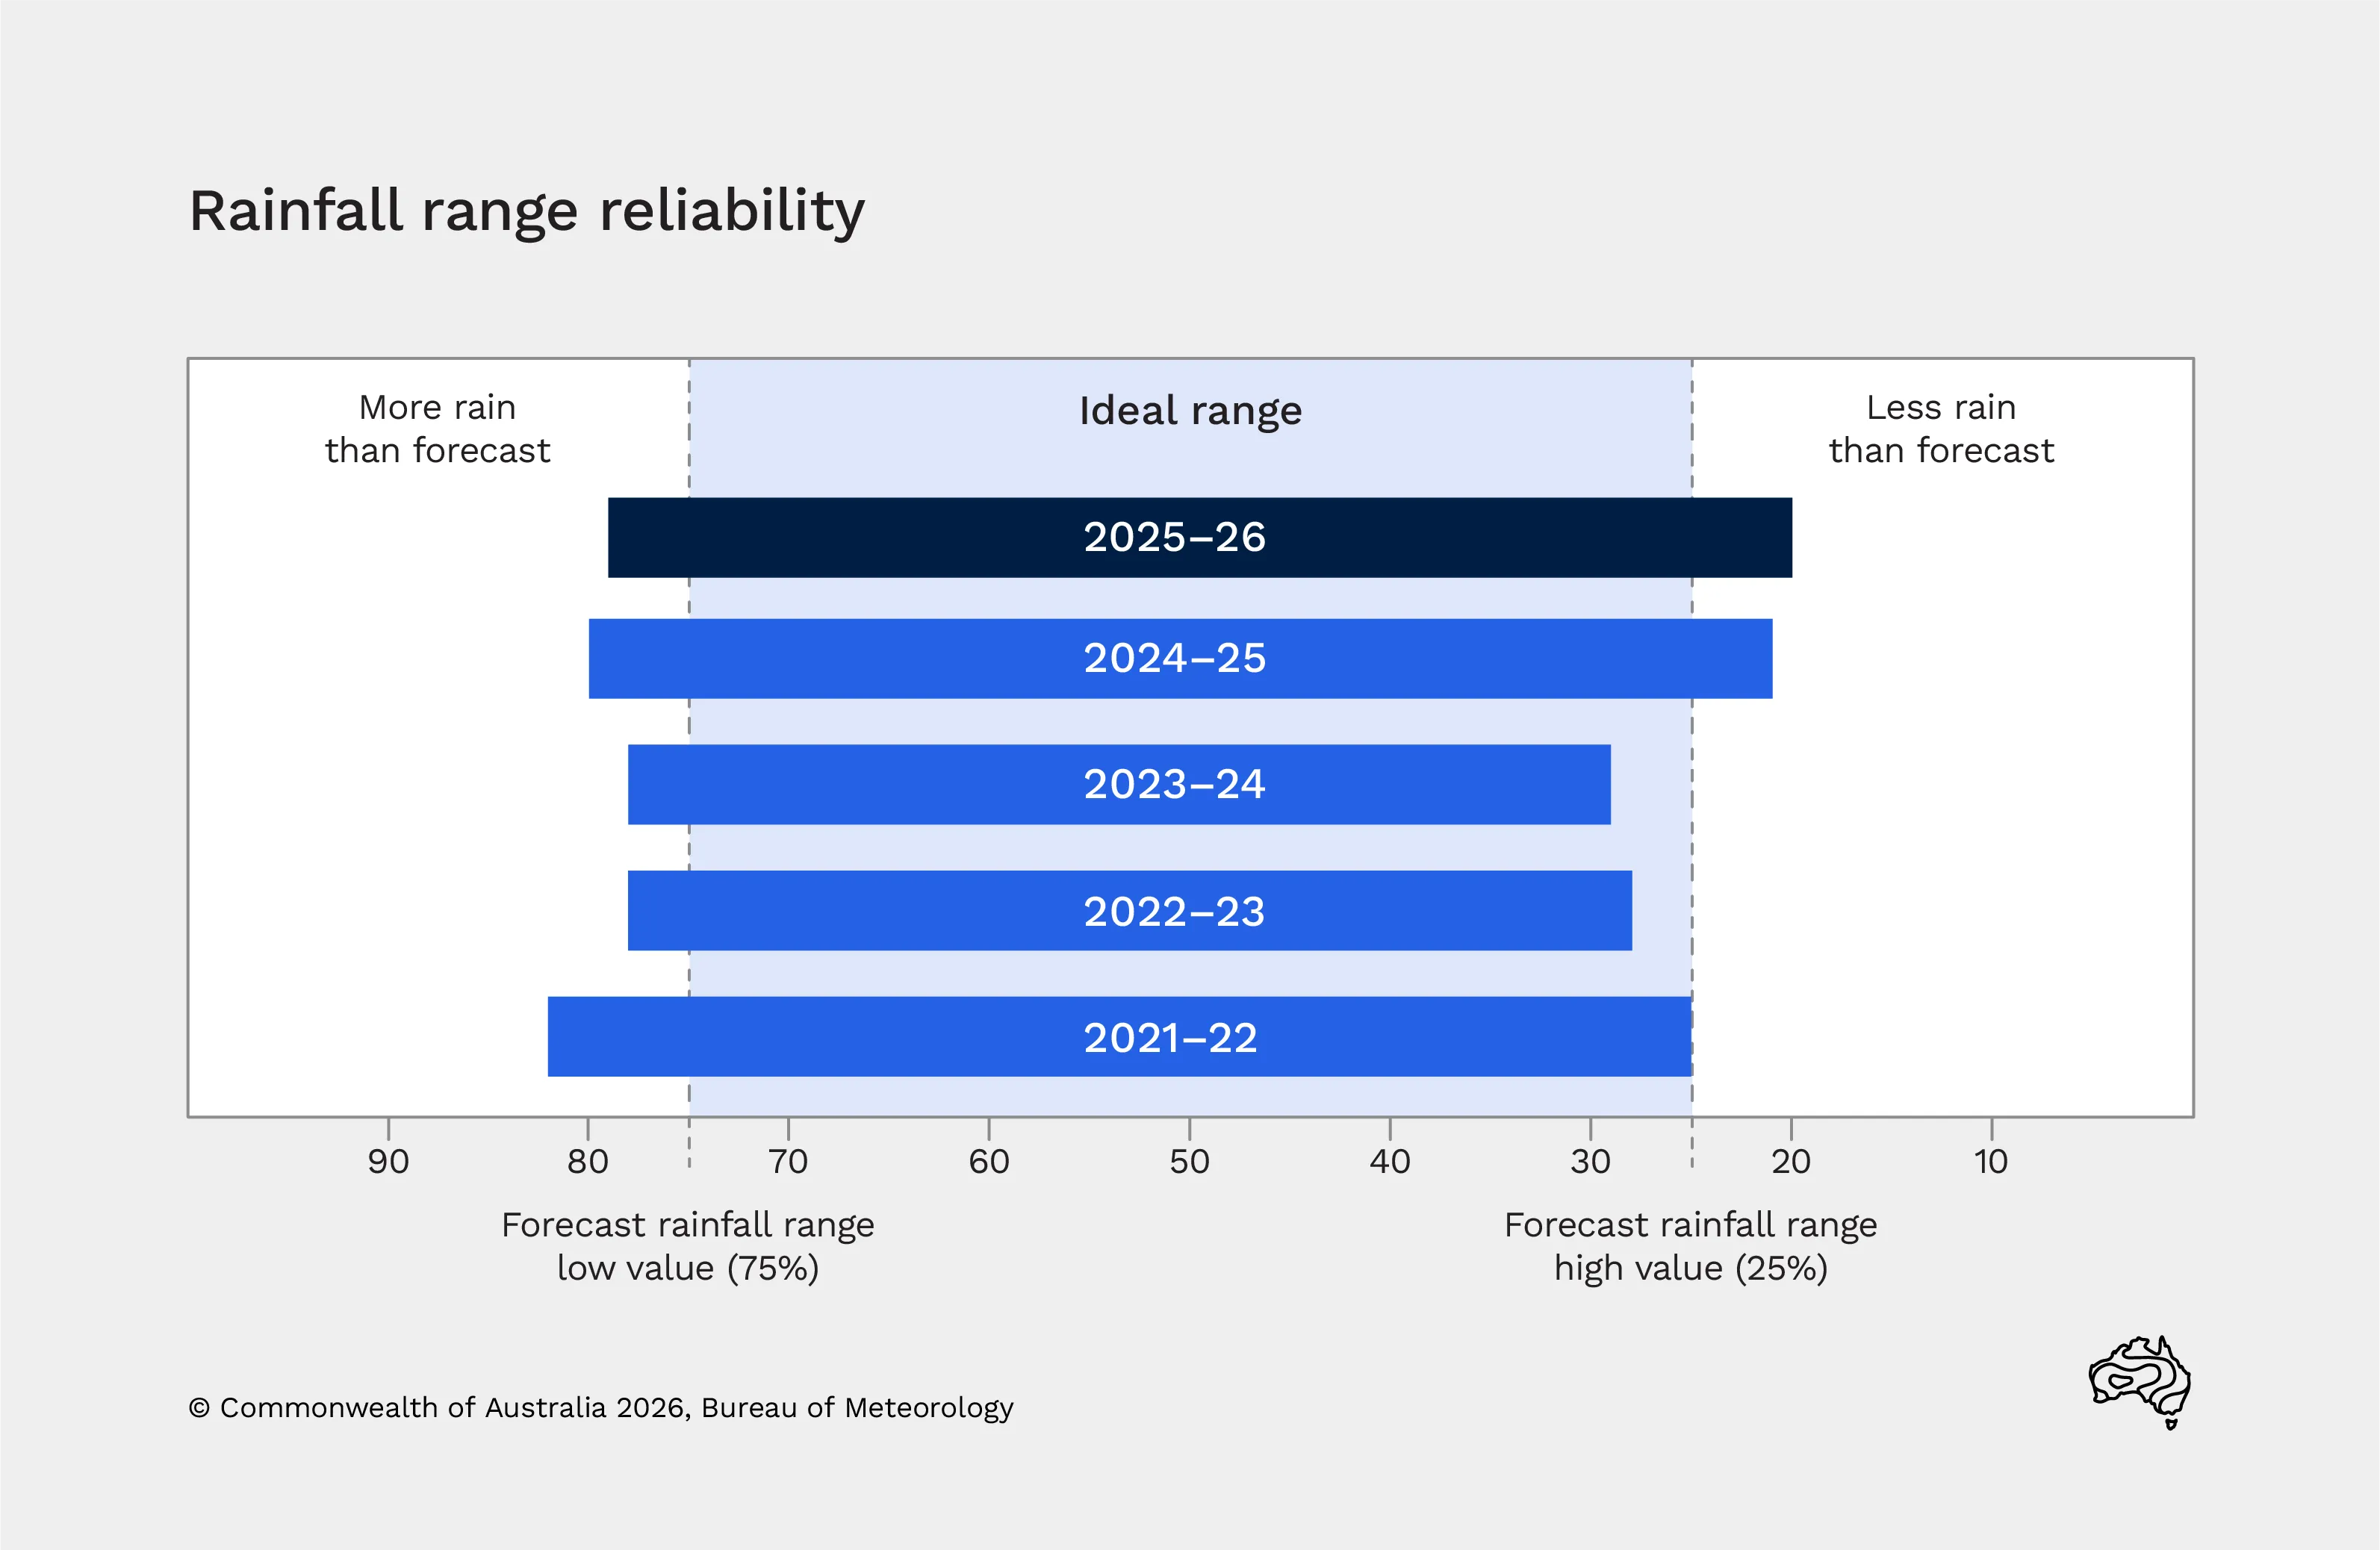
Percentage of next day low and high rainfall range forecasts that were exceeded by observed rainfall, across more than 500 locations with reliable observations
Wind forecasts
Wind information, particularly wind speed and direction, is important for marine activities, aviation, energy and agriculture. We have a network of wind recorders to verify wind forecasts at points across a range of urban, rural and coastal areas.
Across all urban, rural and coastal areas in 2025–26, 90.6% of wind speed forecasts for the next day were accurate to within 5 knots (about 10 km/h).
When looking at only coastal areas, 86.7% of forecast wind speeds were accurate to within 5 knots.
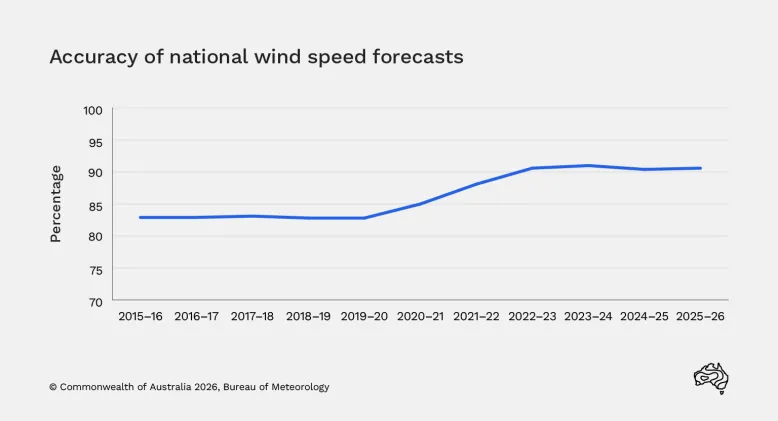
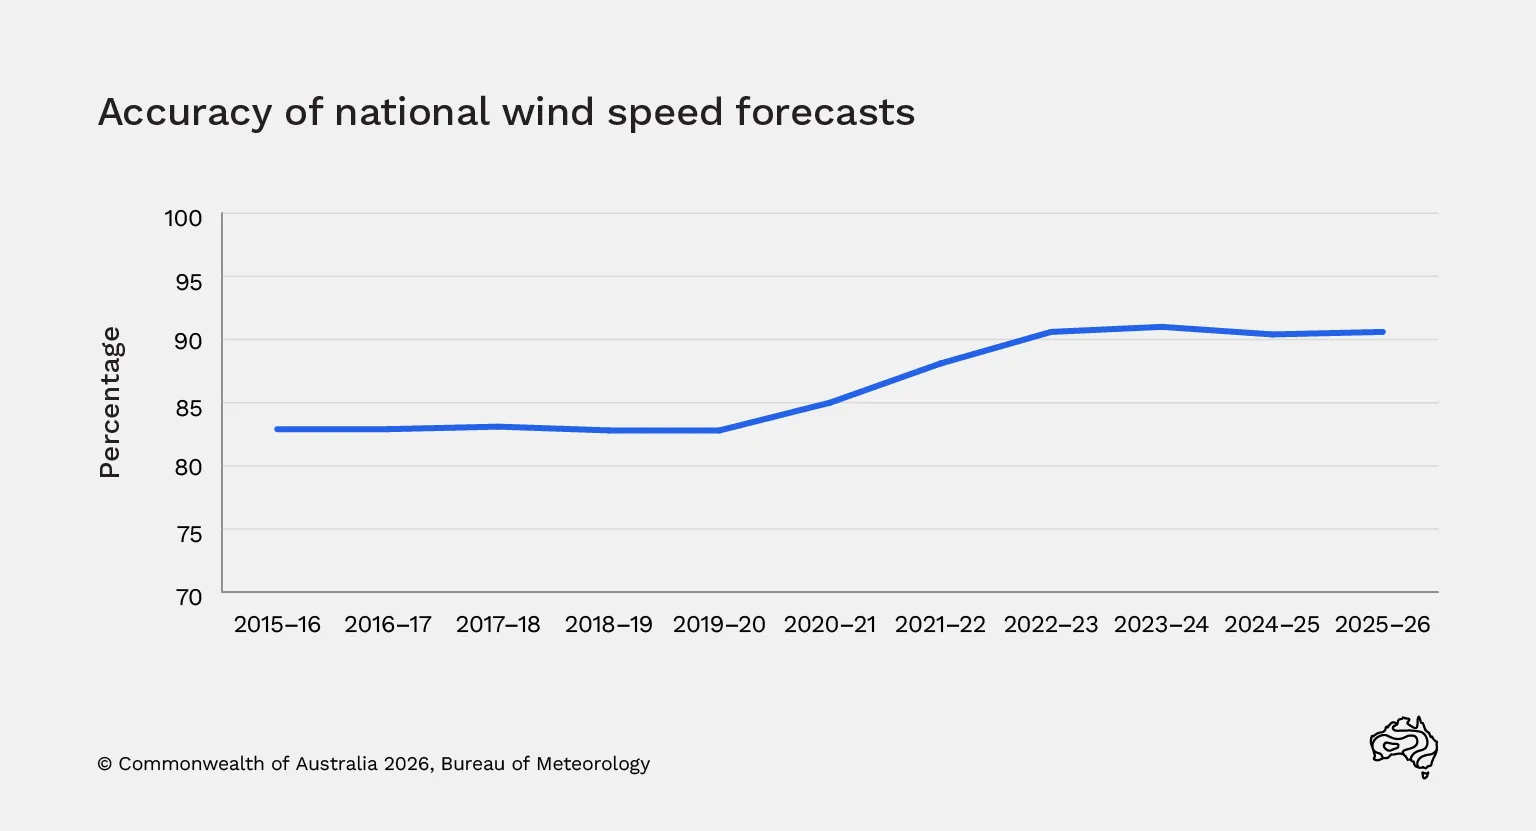
Percentage of wind speed forecasts for the next day that were accurate to within 5 knots, across more than 500 locations with reliable observations
Wave forecasts
Information about significant wave height is important for marine activities. Find out how we measure and forecast wave height.
We use a network of bureau and third-party waverider buoys to verify our wave forecasts. These are mostly deployed along Australia's southern and eastern coastlines.
In 2025–26, 87.3% of significant wave height forecasts were within 0.5 m of observations.
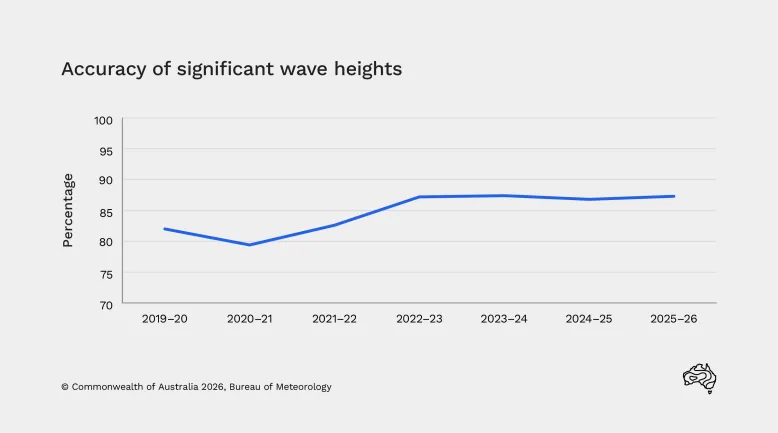
Percentage of significant wave height forecasts for the next day that were accurate to within 0.5 m. The forecasts were verified at about 25 waverider buoy locations.
Flood forecasts and warnings
We provide flood forecasting and warning services for most major rivers in Australia. To do this, we work with other government authorities, such as:
- state and territory emergency services
- water agencies
- local councils.
We measure the percentage of:
- peak river height predictions within a specified range of the observed peak – for example, 0.3 m
- forecasts that meet service level specification targets for lead time to customers.
In 2025–26:
- 73% of flood forecast peak height predictions met service level specification targets (typically within 0.3 m)
- 65% of flood forecast lead times met service level specification targets, which vary in lead time for each location.
Learn more about flood service level specifications.
Timeliness of our forecasts
Every day, we issue weather forecasts for more than 15,000 locations found on our website. Each forecast is updated 4 times per day at scheduled times. You can find your local forecast by searching for your location on this website or the BOM Weather app.
We also issue detailed (long text) forecast descriptions for well-known locations and regions. These include forecasts for:
- towns and cities
- states and districts
- coastal waters
- high seas.
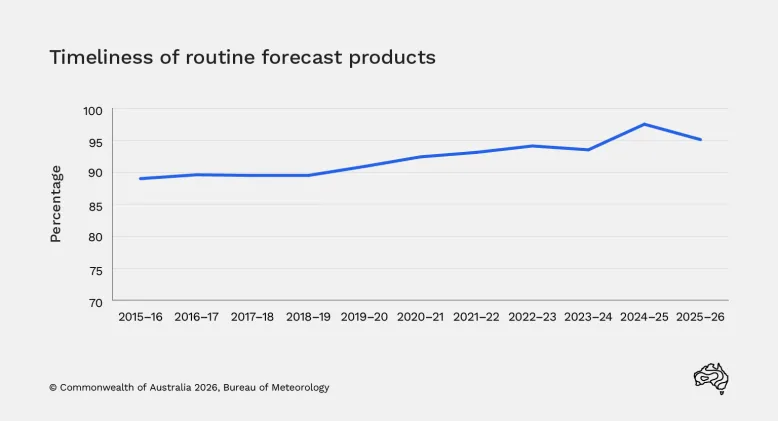
In 2025–26, 95.1% of our routine forecast products were issued on time.