


High rainfall through inland Australia, below average in parts of the west, east and far south
February rainfall was below to very much below average (in the lowest 10% of all Februarys since 1900) for:
- part of north-eastern Tasmania
- parts of the south-west and north-west of Western Australia
- parts of north-eastern New South Wales and small areas in the south-east of Queensland
- parts of coastal south-western Victoria
- a small area east of the Mount Lofty ranges in South Australia.
February rainfall was above to very much above average (in the highest 10% of all Februarys since 1900) for most of:
- the Northern Territory and South Australia
- eastern and southern Western Australia
- western and central Queensland
- western New South Wales
- northern and eastern Victoria.
Rainfall was the highest on record (for all Februarys since 1900) for:
- parts of the Simpson and Tanami districts in the Northern Territory
- parts of north-western Queensland
- much of the north-east of the Lake Eyre Basin, in the South Australia, Queensland and New South Wales border region.
February rainfall was the fifth-highest on record for Australia overall, third-highest on record for the Northern Territory and the second-highest on record for South Australia.
Further details: Monthly climate summaries, Latest National climate summary
Summer

Over the last 3 months, between December 2025 and February 2026, rainfall was below average across:
- areas in the west and south-west of Western Australia
- much of the agricultural areas of South Australia
- southern Victoria
- much of Tasmania
- much of eastern New South Wales
- south-eastern Queensland.
This was in large part due to below average rainfall across December and January.
Summer rainfall was above average to very much above average (in the wettest 10% of all summers since 1900) for northern and central inland areas and two areas in the south-west of Australia.
Multi-year rainfall deficiencies

Rainfall for the 36 months ending in February 2026 has been below to very much below average for:
- large areas of the west and south-west of Western Australia
- the agricultural areas in South Australia
- much of Victoria and Tasmania
- areas of southern New South Wales
- small eastern inland areas.
Maps: Recent and historical rainfall maps
State of the Climate 2024 reported that there has been a shift towards drier conditions across southern Australia, especially for the cool season months from April to October. Despite occasional wetter seasons in some areas, southern Australia has recorded below-average April–October rainfall (area-averaged) in 26 of the 32 years from 1994 to 2025.
The decline in southern Australia's cool season rainfall is linked to rising surface pressure and shifts in large-scale weather patterns, with more high-pressure systems and fewer rain-producing lows and cold fronts.
Long-range forecast for April to June
The long-range forecast, released on 5 March 2026 for April to June 2026 shows:
- Rainfall is likely to be below average for most of Australia.
- Daytime temperatures are very likely to be above average across most of Australia except in parts of the tropical north.
- Overnight temperatures are likely to be above average across much of Western Australia, Tasmania and the eastern and southern coasts of mainland Australia, with no clear warm or cool signal elsewhere.
Deficiencies for the 14 months since January 2025
The start of 2025 saw dry conditions across much of south-eastern Australia, which persisted in some areas throughout the year.
For the 14-month period since January 2025, areas with severe or serious rainfall deficiencies (rainfall totals in the lowest 5% or 10% of periods, respectively, since 1900) include parts of:
- the Gascoyne region of Western Australia
- south-eastern South Australia
- north-western, southern and eastern-central Victoria
- southern New South Wales
- Tasmania.
From late February 2026 moisture from a tropical low brought significant rain to inland Australia, extending to parts of the south-east. This cleared rainfall deficiencies in inland areas of Western Australia, the Northern Territory and South Australia, but deficiencies only contracted slightly in the south-east. Rainfall deficiencies expanded in the Gascoyne region of Western Australia and in parts of the south-east.
The rainfall from this system continued into early March in the south-east. This may further reduce shorter term rainfall deficiencies in the region.
Deficiencies for the 24 months since February 2024
For the rolling 24-month period ending in February 2026, which includes the last two southern cool seasons (April to October), areas with severe or serious rainfall deficiencies (rainfall totals in the lowest 5% or 10% of periods, respectively, since 1900) extend across:
- agricultural regions of south-eastern South Australia
- most of Victoria, except East Gippsland and parts of the north
- parts of southern New South Wales
- some generally coastal areas in Tasmania
- small areas in the south-west of Western Australia.
Areas with lowest on record rainfall (compared to all respective periods since 1900) include:
- parts of Eyre and Yorke peninsulas, and large areas of the Mid North and Murraylands districts in South Australia
- areas in north-western and southern Victoria.
Compared to January 2026, deficiency areas for the last 24-months contracted in the west of the Eyre Peninsula extending inland and in parts of northern Victoria, but have remained generally similar elsewhere. The heavy rainfall since late February and into early March across central Australia and the south-east has not yet significantly eased the longer-term rainfall deficiencies.
.
Soil moisture below average across parts of the east, south-east and west
February root zone soil moisture (0–1 m) was below to very much below average (in the lowest 10% of all Februarys since 1911) for:
- north-eastern New South Wales into south-eastern Queensland
- pockets of southern New South Wales
- parts of southern Victoria and southern South Australia
- Tasmania, except for most of the south-east
- the far south-west and parts of central Western Australia.
During February, areas of root zone soil moisture deficiencies expanded and intensified across:
- north-eastern New South Wales
- much of Tasmania
- southern Victoria
- inland parts of the Pilbara-Gascoyne region in Western Australia.
Significant rainfall during February eased root zone soil moisture deficiencies in:
- parts of south-west Western Australia, including the wheatbelt
- most of South Australia
- the Northern Territory's south
- much of western New South Wales
- the north-west of Victoria.
Low soil moisture for long periods of time is an indicator of agricultural drought, affecting ongoing crop growth, and pasture growth required for livestock. During cropping seasons, low soil moisture can impact crop emergence, establishment and growth.
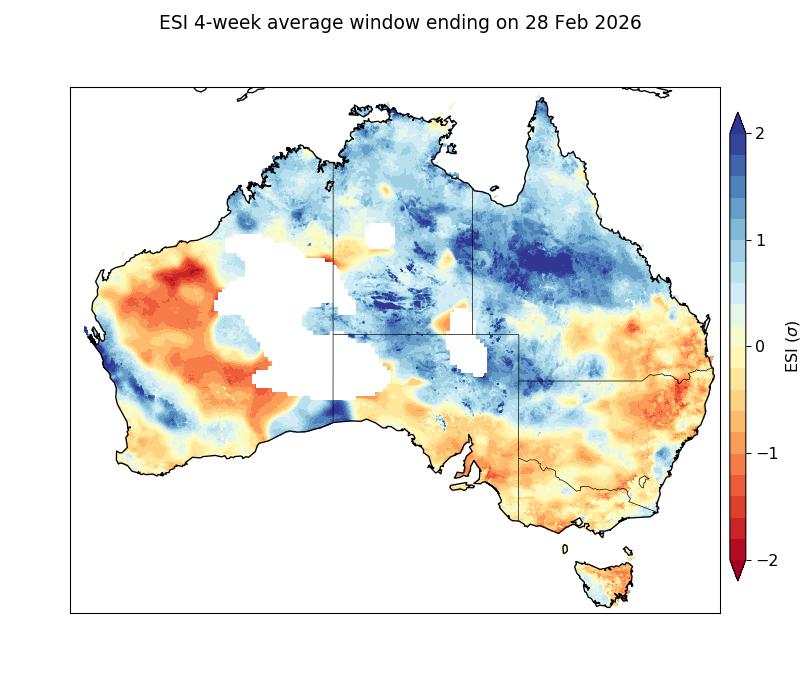
Evaporative stress elevated in parts of the east and west
Evaporative stress for the 4 weeks ending 28 February 2026 was elevated (negative Evaporative Stress Index (ESI)) in:
- north-east and southern New South Wales
- south-east Queensland
- Victoria
- Tasmania except for the south-west
- much of southern South Australia
- parts of the south-west and central Western Australia.
During February, evaporative stress intensified in north-eastern New South Wales into south-east Queensland as well as in parts of the Pilbara in Western Australia and Tasmania’s north-east. However, evaporative stress generally eased, with large parts of central and southern Australia having a positive ESI, or a less negative value compared to the end of January. The region of significantly elevated ESI (below −2) was reduced and mostly confined to an area of the Pilbara around Marble Bar.
See this journal publication for further details on the calculation and use of the ESI in drought monitoring. Negative ESI values can indicate vegetation moisture stress reflecting agricultural and ecological drought. A rapid decrease in ESI values can be an indicator of flash drought.
Rainfall deficiencies and water storage at the end of February
- February rainfall was average or above average across most of Australia except for Tasmania and north-eastern New South Wales.
- Rainfall deficiencies for the 14-month period since January 2025 cleared in areas of central inland Australia, and rolling 24-month rainfall deficiencies contracted in parts of South Australia.
- Soil moisture deficiencies have intensified in parts of the east and west but eased in much of central and southern Australia.
- Streamflow was lower than average at many sites across southern and south-eastern Australia, and southern Queensland.
- Some water storages in the eastern and southern states have declined by up to 50% compared to this time last year.
Low streamflow in southern and south-eastern Australia and southern Queensland
Streamflow was lower than average at 39% of the 886 sites with available data across Australia in February (based on records since 1975). These were mostly associated with average to below average rainfall, which reduced root zone soil moisture and runoff across many catchments. Regions with a high proportion of sites with lower than average streamflow included:
- the South East Coast (Victoria) drainage division (37% of 98 sites)
- the South Australian Gulf drainage division (60% of 10 sites)
- sites in the north and east of Tasmania (73% of 22 sites)
- across the Murray–Darling Basin (51% of 326 sites) and far south and northern areas of the South East Coast (New South Wales) drainage division (53% of 107 sites)
- southern areas of the North East Coast (18% of 162 sites)
- the central west of the South West Coast drainage division of Western Australia (35% of 76 sites) and some sites in the Pilbara–Gascoyne drainage division (50% of 14 sites).
Very much below average streamflow (in the lowest 10% of years since 1975) was recorded in February at 8% of sites , including:
- in the north and south-east areas of the Murray–Darling Basin (10% of 326 sites)
- ten sites in South East Coast (New South Wales), eight sites in the west areas of the South East Coast (Victoria), two sites in the South Australian Gulf drainage division, and nine sites in the Tasmania
- four sites in the south of the North East Coast drainage division
- five sites in the South West Coast drainage division of Western Australia and two sites in the Pilbara–Gascoyne drainage division.
Streamflow in February was average at 41% of sites, spread across the country.
Higher than average streamflow was recorded at 19% of sites, with 3% of sites observing very much above average streamflow (in the highest 10% of years since 1975). Regions with higher than average streamflow included:
- the Tanami–Timor Sea Coast drainage division (63% of 27 sites), across the Carpentaria Coast drainage division (87% of 32 sites) and in the Lake Eyre Basin drainage divisions in Queensland (89% of 9 sites)
- across the North East Coast drainage division in Queensland (37% of 162 sites)
- two sites in the South East Coast (New South Wales) drainage division and north and eastern areas of the Murray–Darling Basin (12% of 326 sites)
- west and central east areas of the South East Coast (Victoria) drainage division (8% of 98 sites)
- the South West Coast drainage division of Western Australia (14% of 76 sites) and four sites in the Pilbara–Gascoyne drainage division.
Higher than average February rainfall and root zone soil moisture increased runoff in parts of northern Australia including the north and west of Queensland, contributing to the above average February streamflow in those catchments.

Low storage levels in western Victoria, the southern Murray–Darling Basin and central Queensland
By the end of February, total water storage across Australia—based on 303 public storages—was at 66.3% of capacity, remaining steady (up by 0.1%) from the previous month and 2.4% lower than at the same time last year. Storage volumes decreased in 175 storages during February, with relatively low, below 50% observed in several regions, including:
- the southern and eastern Murray–Darling Basin
- Victoria, particularly in western areas
- central eastern Queensland
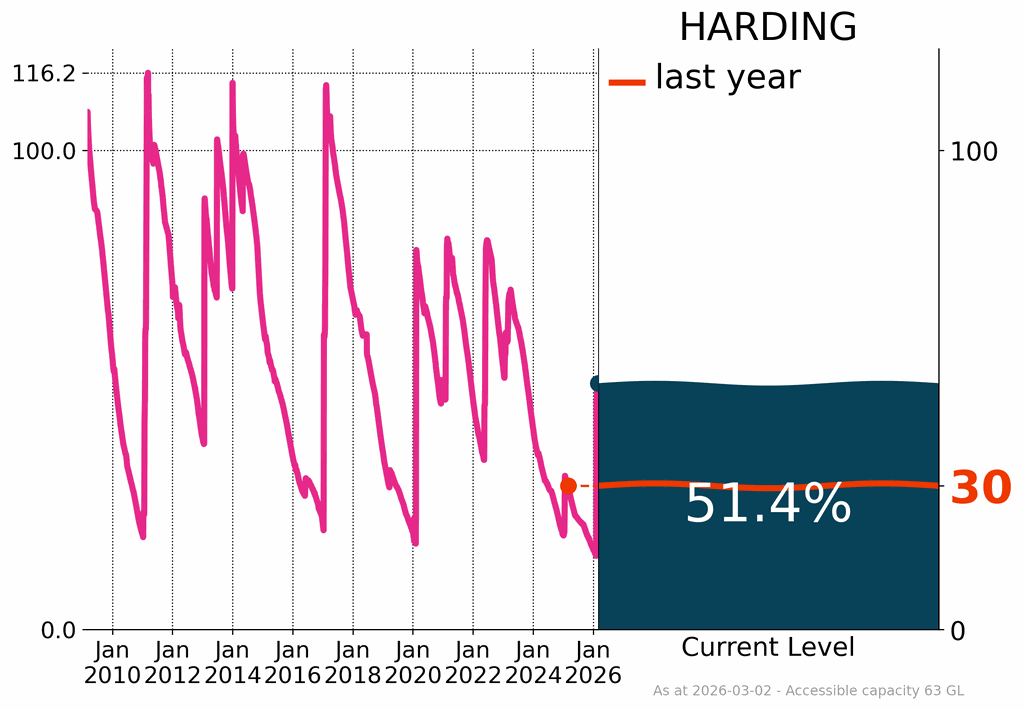
- the Harding storage in the Pilbara–Gascoyne drainage division
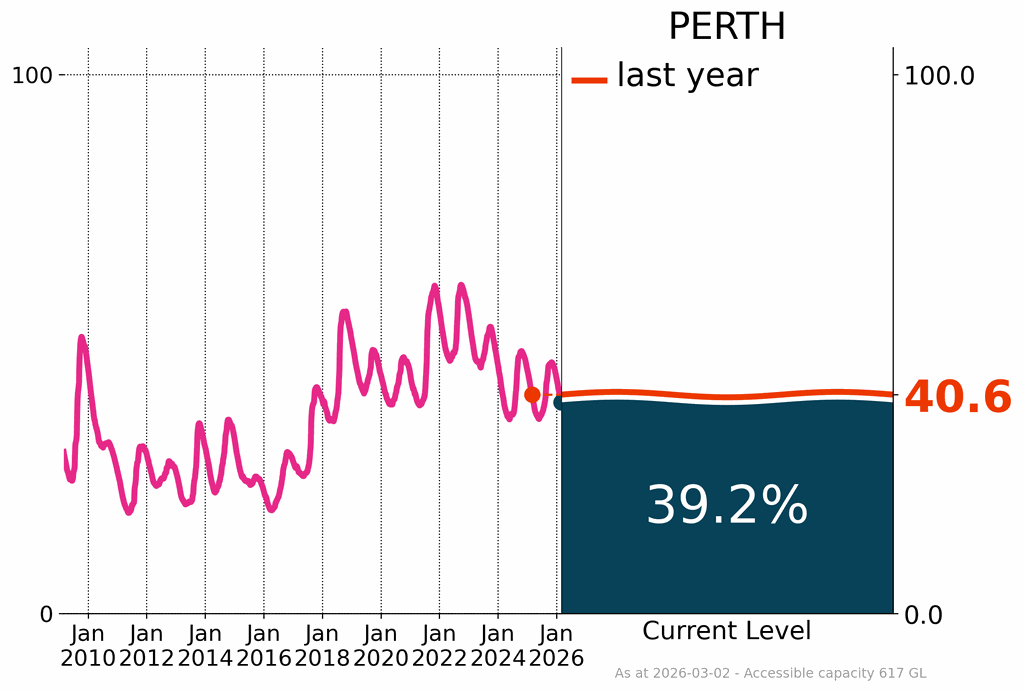
- Perth urban storages
- central Tasmania.
Declines in storages in eastern and southern New South Wales and south-east Queensland were generally due to below average rainfall and soil moisture content. Extremely dry conditions since 2023 in Victoria have reduced inflows to the storages and large volumes were diverted for agriculture during the spring and summer high-demand period. Extended dry spells over many years have kept storages low in south-west Western Australia.

North East Coast
Overall, storages across the North East Coast drainage division were at 80.9% of capacity at the end of February, an increase of 3.9% compared to the previous month and 3.7% higher than at the same time last year.
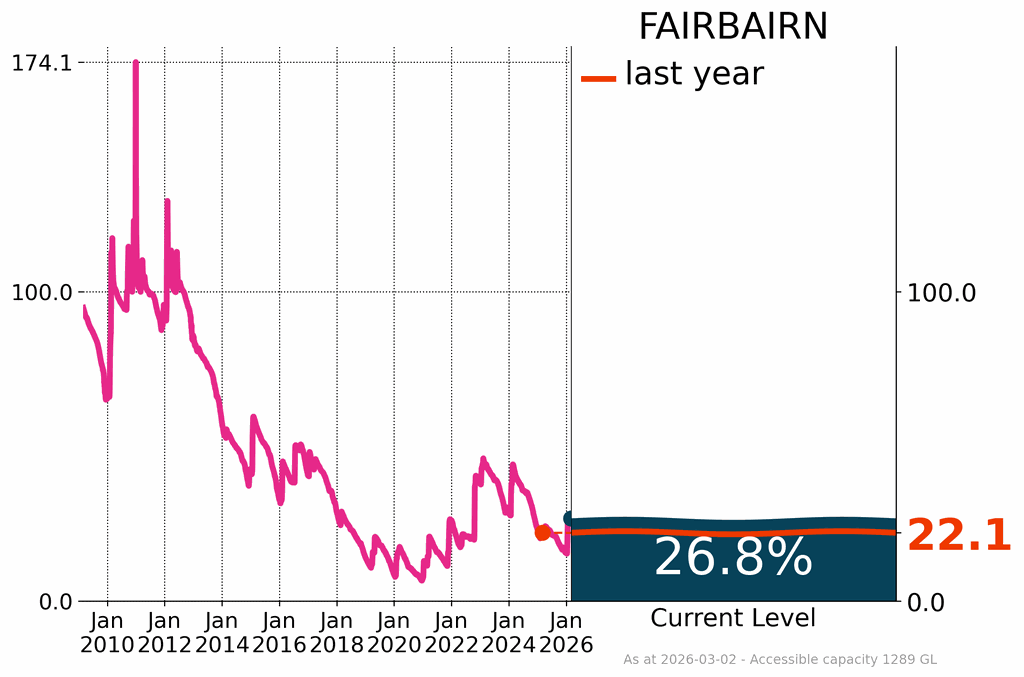
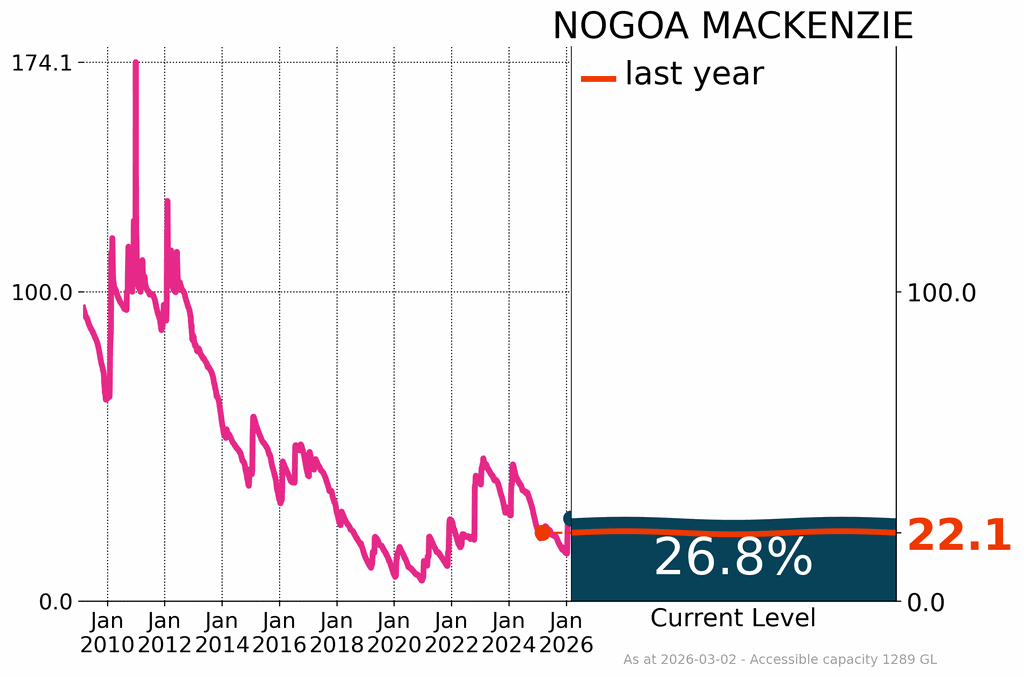
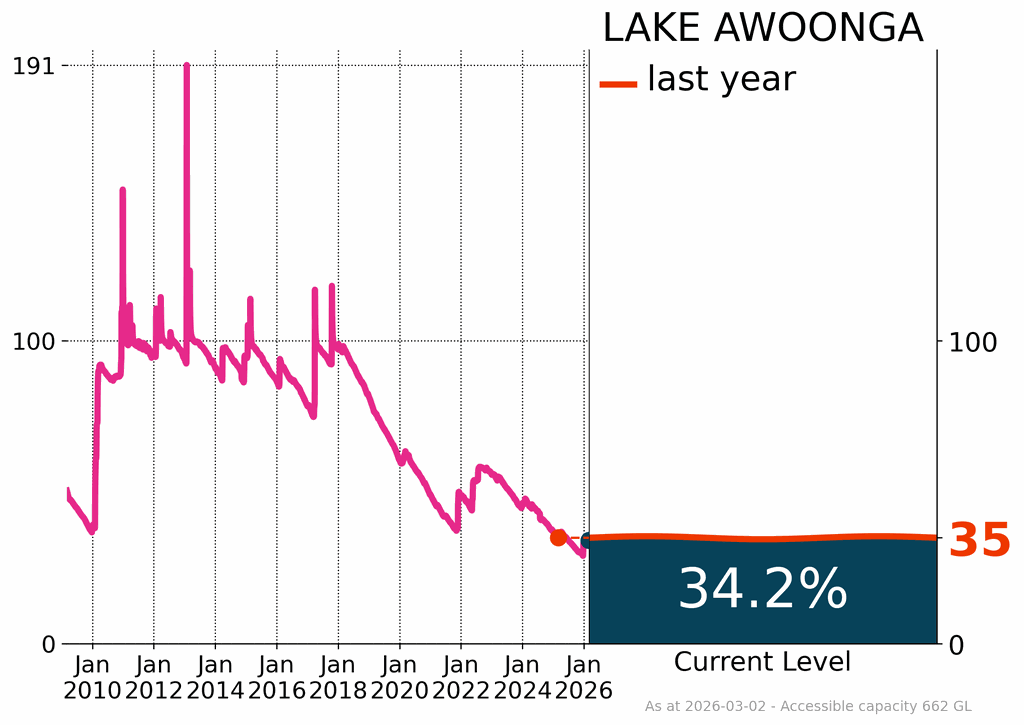
Some storages were at full capacity and increased from last month but several storages remained below 50% of capacity at the end of February, notably Fairbairn and Lake Awoonga, Queensland’s second- and fourth-largest storages respectively.
Fairbairn increased slightly by 0.2%, finishing the month at 26.8%. This increase at Fairbairn slightly raised the volumes in the Nogoa-Mackenzie system to 26.8% of capacity in February. This system supplies water to rural communities across central Queensland. Lake Awoonga had a small decrease, 0.9% in February ending at 34.2%, 0.8% lower than at the same time last year.
South-eastern Australia
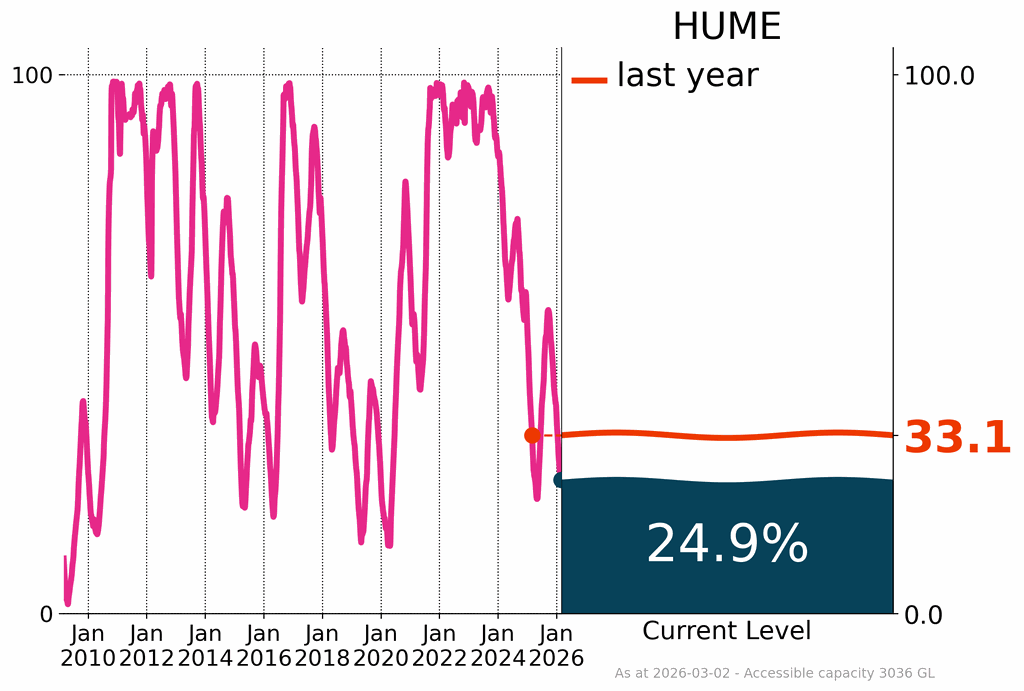
Many storages across the Murray–Darling Basin and the South East Coast (Victoria) drainage division were below or close to 50% of capacity at the end of February, including Hume Dam, Australia’s seventh-largest reservoir, and Lake Eucumbene. Hume Dam decreased by 2.9% during February, finishing at 24.9%, 8.2% lower than at the same time last year. Menindee Lakes in western New South Wales decreased by 6.1%, finishing at 32.7% of capacity at the end of February.
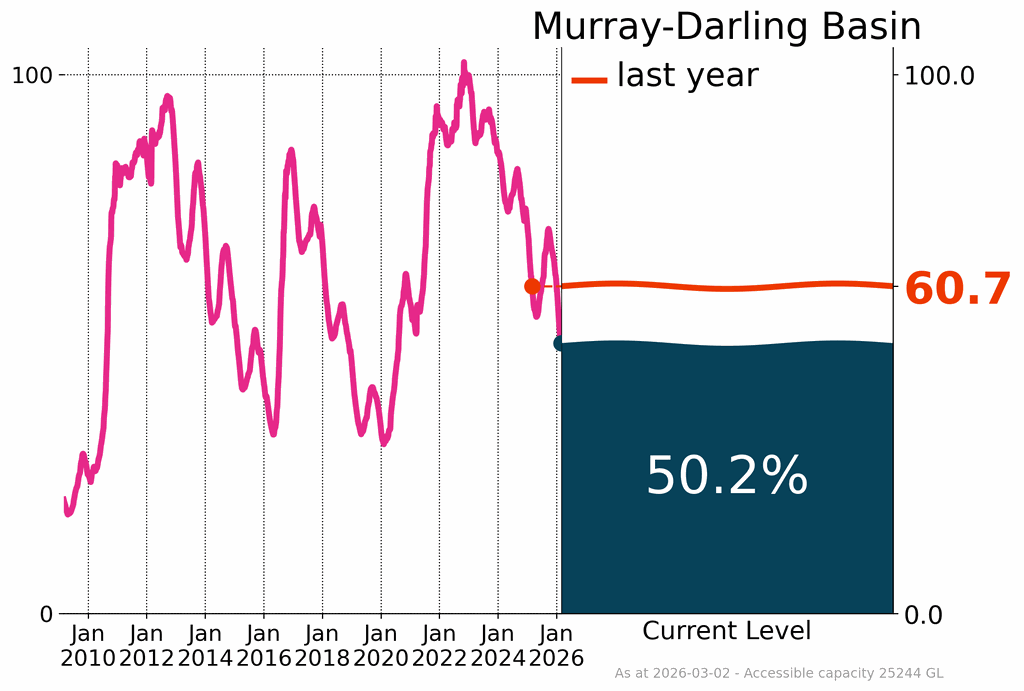
The overall storage volume across the Murray–Darling Basin decreased by 3.5% during February, finishing the month at 50.2% and 10.5% lower than at the same time last year. With dry catchment conditions and increased demand during the irrigation season (October to March), the storage volume in the southern Murray–Darling Basin decreased by 3.8%, finishing at 48.6% capacity at the end of February and 12.6% lower than at the same time last year.
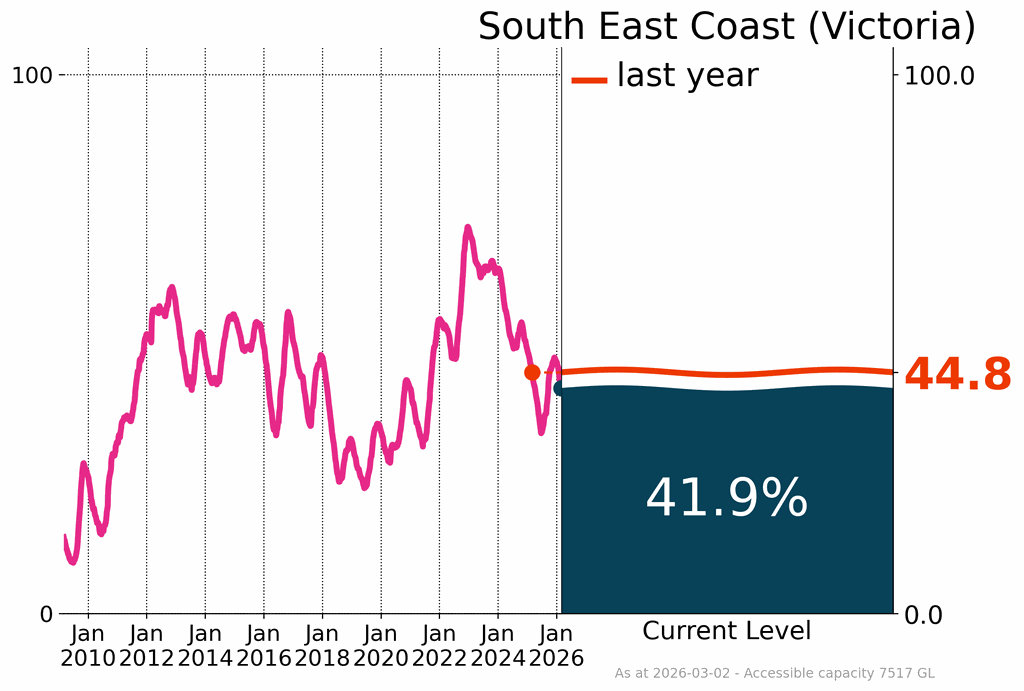
Despite notable rainfall total across parts of the Victoria in February, the western catchments received only around 25 to 46 mm. Due to persistent rainfall deficiencies, overall storage volume across the South East Coast (Victoria) drainage division slightly decreased by 2.2% in February, ending the month at 41.9%. In the Wimmera–Mallee system, a critical rural water supply for domestic and agricultural use in western Victoria, storages were at 35.0% of capacity, down by 1.9% compared to the previous month and 5.8% lower than at the same time last year.
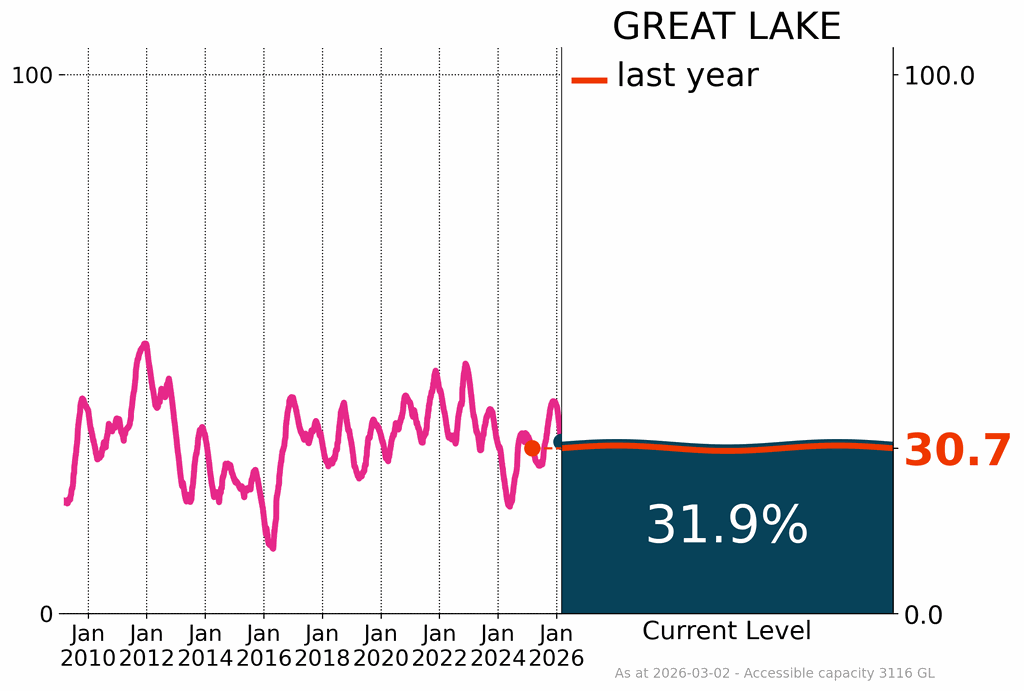
In Tasmania, the two largest storages—Lake Gordon and Great Lake—were at 63.2% and 31.9%, respectively, at the end of February. Total storage across Tasmania was 66.5%, a decrease of 1.9% from December, but 5.4% higher than this time last year.
Western Australia
The Harding Reservoir, the only major storage in the Pilbara–Gascoyne drainage division, was at 51.4% of capacity at the end of February, an increase of 39.5% from the previous month, and 21.4% higher than at the same time last year. The increase in Harding dam's volume was driven by rainfall associated with the passage offshore of Severe Tropical Cyclone Mitchell in early February.
Urban storages
At the end of February, surface water storages supplying most capital cities were close to or above 70% of accessible capacity, except for Melbourne, Adelaide and Perth. Storages for these cities are relatively low, following extended periods of severe rainfall deficiencies reducing surface water inflows into regional storages.
Perth's surface water storages were at 39.2% of capacity at the end of February, a decrease of 1.8% from the previous month, and 1.4% lower than at the same time last year. The two largest storages supplying Perth remained below 35% capacity, with South Dandalup at 7.4% and Serpentine at 31.5%.
The long-term decline in surface water inflows, driven by underlying climate change, means Perth now relies heavily on desalination and groundwater to meet urban water demand.
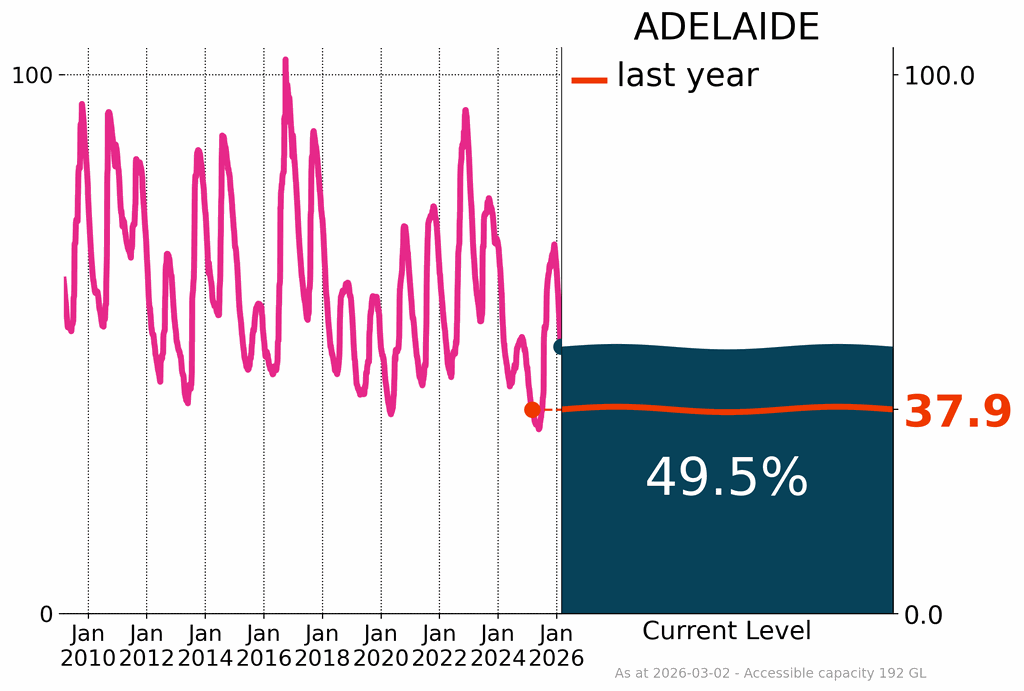
Adelaide's storages were 49.5% full at the end of February, a decrease of 6.0% from the previous month, but 11.6% higher than at the same time last year. Most of the storages in Adelaide remained above or close to 60% capacity except South Para at 38.7% capacity, Warren at 29.2% capacity and Mount Bold at 39.4% capacity. Adelaide's storages were driven by prolonged and severe dry conditions, historically low catchment inflows, insufficient rainfall during key recharge periods, and high summer demand.
Adelaide's urban water supply is augmented by transfers from the River Murray, with additional support from desalination and groundwater. River Murray pipelines also supply water to the Eyre and Yorke Peninsulas and parts of south-east South Australia.
Melbourne's water storages declined due to below average rainfall, record low-inflows, and increased water demand under hot, dry conditions. By the end of February, Melbourne's storages were 69.5% full, a decrease of 2.5% from the previous month, and a decrease of 11.1% from the same time last year.
In response to persistent rainfall deficiencies, the Victorian desalination plant has been in operation to support water supply to the Melbourne and Geelong areas.
Product code: IDCKGD0AR0
There are currently no formally monitored deficiency periods
During the absence of large-scale rainfall deficiencies over periods out to around two years' duration, the Drought Statement does not include any formally monitored deficiency periods. We will continue to monitor rainfall over the coming months for emerging deficiencies or any further developments.
Rainfall history
 Australian rainfall history
Quickly see previous wet and dry years in one (large) screen.
Previous three-monthly rainfall deciles map
See also: Rainfall maps | Rainfall update
Soil moisture details are reported when there are periods of significant rainfall deficits.
Soil moisture data is from the Bureau's Australian Water Resources Assessment Landscape (AWRA-L) model, developed through the Water Information Research and Development Alliance between the Bureau and CSIRO.
See also: Australian Water Outlook: Soil moisture
See also: Murray-Darling Basin Information Portal
Previous issues
Related links
![]() Unless otherwise noted, all maps, graphs and diagrams in this page are licensed under the Creative Commons Attribution 4.0 International Licence
Unless otherwise noted, all maps, graphs and diagrams in this page are licensed under the Creative Commons Attribution 4.0 International Licence
