


There are currently no formally monitored deficiency periods
During the absence of large-scale rainfall deficiencies over periods out to around two years' duration, the Drought Statement does not include any formally monitored deficiency periods. We will continue to monitor rainfall over the coming months for emerging deficiencies or any further developments.
Rainfall history
 Australian rainfall history
Quickly see previous wet and dry years in one (large) screen.
Previous three-monthly rainfall deciles map
See also: Rainfall maps | Rainfall update
Soil moisture details are reported when there are periods of significant rainfall deficits.
Soil moisture data is from the Bureau's Australian Water Resources Assessment Landscape (AWRA-L) model, developed through the Water Information Research and Development Alliance between the Bureau and CSIRO.
See also: Australian Water Outlook: Soil moisture
See also: Murray-Darling Basin Information Portal
Previous issues
Related links
Low April rainfall in eastern Australia
Area-averaged rainfall was below average for all states and territories, except for the Northern Territory. For New South Wales, area-averaged rainfall was the second-lowest on record, behind only April 1997, at 13% of the 1961–1990 average.
During April, high pressure systems dominated eastern Australia, including persistent blocking in the south Tasman Sea over the final fortnight. High pressure ridges to the east of Australia can deflect tropical moisture flows and southern frontal systems.
April rainfall was below average to very much below average (in the lowest 10% of all Aprils since 1900) for:
- most of New South Wales
- much of southern Queensland and areas along the coast
- parts of Victoria
- north-east Tasmania
- large parts of northern and eastern South Australia
- large parts in the south of the Northern Territory.
Rainfall was above to very much above average (in the highest 10% of all Aprils since 1900) for parts of:
- northern and north-eastern Northern Territory
- north-western Queensland
- western inland and southern Western Australia.
- areas in the north and south-west of Western Australia.
Further details: Monthly climate summaries, Latest National climate summary
Rainfall in recent months

Over the last 3 months, between February and April 2026, rainfall was below average (in the lowest 10% of all Aprils since 1900) across:
- an inland area of the Pilbara–Gascoyne drainage division in Western Australia
- eastern Tasmania and the west coast
- central-coast fringes in Victoria
- north-eastern New South Wales
- parts of south-eastern Queensland.
February to April rainfall was above average (in the wettest 10% of all February to April periods since 1900) for northern and central areas of Australia, along the west and south coast in Western Australia, and parts of the south-east mainland.
Rainfall deficiencies since 2025
Rainfall deficiencies that had developed since January 2025 were almost fully removed by widespread rainfall from late February and into March 2026. The most significant remaining pocket of serious rainfall deficiencies since January 2025 (in the lowest 10% of all such periods since 1900) is inland in the Pilbara-Gascoyne Drainage Division. There was little change in the extent or intensity of this rainfall deficiency in April 2026. Formal reporting of deficiencies since January 2025 has now ended as the region enters its dry season, although monitoring by the Bureau will continue.
Multi-year rainfall deficiencies

Rainfall for the 36 months ending in April 2026 has been below average (in the lowest 30% of all such periods since 1900) for:
- large areas of the west and south-west of Western Australia
- the agricultural areas in South Australia
- much of Victoria and Tasmania
- areas along New South Wales western slopes, and into southern Queensland.
Since March, long-term rainfall deficits have intensified slightly in north-eastern New South Wales, south-eastern South Australia and eastern Tasmania.
Maps: Recent and historical rainfall maps
State of the Climate 2024 reported that there has been a shift towards drier conditions across southern Australia, especially for the cool season months from April to October. Even with occasional wetter seasons in some areas, southern Australia has recorded below-average April–October rainfall in 26 of the 32 years from 1994 to 2025. The below average cool season rainfall across southern Australia reflects the longer-term signal linked to climate change shown in State of the Climate 2024.
The decline in southern Australia's cool season rainfall is linked to rising surface pressure and shifts in large-scale weather patterns, with more high-pressure systems and fewer rain-producing lows and cold fronts.
Long-range forecast for June to August
The long-range forecast, released on 7 May 2026 for June to August 2026 shows:
- Rainfall is likely to be below average for much of eastern Australia and south-west Western Australia.
- Daytime temperatures are likely to be above average for most of Australia except in parts of the north.
- Overnight temperatures are likely to be above average for most of Australia.
Deficiencies for the 4 months since January 2026
For the 4 months ending in April 2026 severe or serious rainfall deficiencies exist (rainfall totals in the lowest 5% or 10% of years, respectively, since 1900) in areas including:
- parts of north-eastern New South Wales and bordering areas of Queensland
- small areas along west facing coasts in Victoria
- areas in western, northern and eastern Tasmania.
Since March 2026, rainfall deficiency areas have increased in extent and severity in north-eastern New South Wales, bordering Queensland, and in Tasmania. Year-to-date deficiency areas in Western Australia have mostly cleared.
An area with lowest on record rainfall (compared to all respective periods since 1900) has established in the New South Wales Northern Tablelands region.
Deficiencies for the 24 months since May 2024
For the latest 24-month period ending in April 2026, areas with severe or serious rainfall deficiencies (rainfall totals in the lowest 5% or 10% of periods, respectively, since 1900) extend across:
- agricultural regions of south-eastern South Australia
- parts of western, southern and eastern-central Victoria
- parts of southern New South Wales
- some isolated coastal areas in Tasmania.
Compared with the 24-month period ending in March 2026, rainfall deficiencies have eased slightly in South Australia but intensified slightly in Victoria and expanded in southern New South Wales. However, this is due to April 2024 being drier than April 2026 in affected areas of South Australia, but wetter in the other affected areas. April 2026 rainfall across the region of 24-month rainfall deficiencies was average to below average.
.
Soil moisture below average across areas of the central-east, Tasmania and parts of the west
April root zone soil moisture (0–1 m) was below to very much below average (in the lowest 10% of all Aprils since 1911) for:
- north-eastern New South Wales into south-eastern Queensland
- a area of western South Australia
- eastern Tasmania
- isolated areas through central Western Australia.
During April, areas of root zone soil moisture deficits expanded and intensified across:
- north-eastern New South Wales and
- adjacent south-eastern Queensland, where very much below average conditions remained widespread.
Significant rainfall during April eased root zone soil moisture deficits in:
- much of central Australia (southern Northern Territory and northern Soutth Australia)
- western and central Queensland
- parts of inland New South Wales
- parts of the Pilbara–Gascoyne region and parts of south-west of Western Australia.
Compared with March 2026, root zone soil moisture deficits eased across much of southern and inland Australia, reflecting widespread positive soil moisture conditions. However, root zone soil moisture deficits persisted in parts of north-eastern New South Wales and south-eastern Queensland, where conditions remained among the driest nationally. Around 5% of Australia was in the lowest soil moisture decile during April 2026.
Below average soil moisture for extended periods is a key indicator of agricultural drought. affecting ongoing crop growth, and reduces pasture availability for livestock. During cropping seasons, low soil moisture can hinder crop emergence, establishment and subsequent growth.
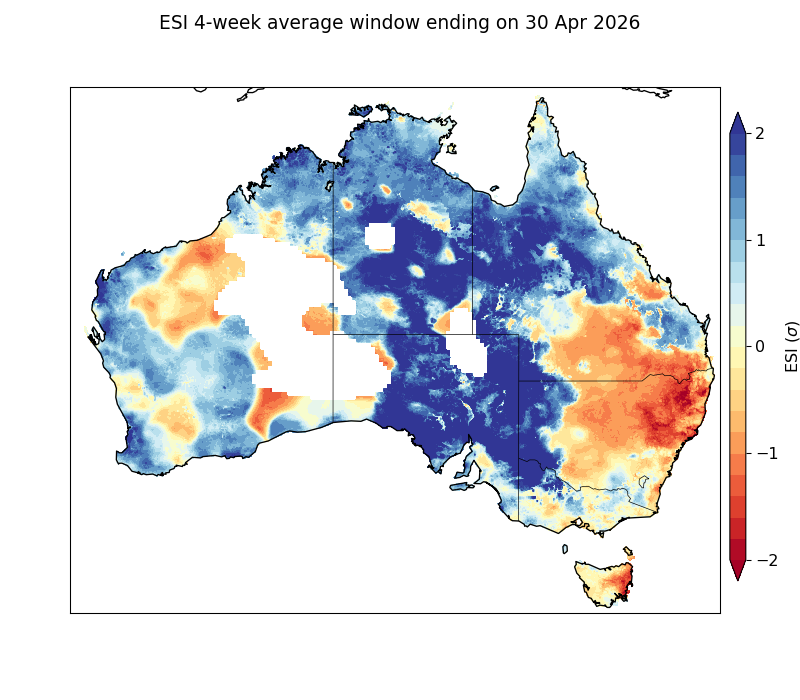
Evaporative stress elevated in parts of the east and west
Evaporative stress for the 4 weeks ending 30 April 2026 was elevated (negative Evaporative Stress Index (ESI)) in:
- most of eastern New South Wales
- much of southern Queensland
- parts of the Pilbara, interior and isolated areas in the south-west of Western Australia.
- Tasmania, particularly the north-east.
During April, areas with evaporative stress (where negative ESI values indicate dry conditions) expanded inland and along the coast in New South Wales and in southern Queensland. In Western Australia, areas with stress contracted and eased in intensity in parts the Pilbara, the interior and the south west. Other parts of the country including large central areas, showed no stress (where positive ESI values indicate normal to wet conditions).
Areas of significantly elevated stress (ESI below −2) increased in April in coastal north-eastern New South Wales, adjacent south-eastern Queensland, and in north-eastern Tasmania.
See this journal publication for further details on the calculation and use of the ESI in drought monitoring. Negative ESI values can indicate vegetation moisture stress reflecting agricultural and ecological drought. A rapid decrease in ESI values can be an indicator of flash drought.
Rainfall deficiencies and water storage at the end of April
- April rainfall was below average for all states and territories except for the Northern Territory.
- New South Wales had its second driest April on record (since 1900), with total rainfall 13% of the 1961–1990 average.
- Areas with year-to-date rainfall deficiencies for 2026 include much of north-eastern New South Wales into bordering Queensland, parts of Tasmania, and small areas of southern Victoria.
- Rainfall deficiencies for the latest 24-months eased in parts of inland south-eastern Australia and in Western Australia.
- Soil moisture deficits have eased in much of southern and inland Australia but increased in parts of north-eastern New South Wales and southern Queensland.
- Streamflow was lower than average at many sites across southern and south-eastern Australia, and in south-eastern Queensland.
- Some water storages in the eastern and southern states are now at or below 50% of their capacity.
Low streamflow in southern Australia, north-eastern New South Wales, and south-eastern Queensland
Streamflow was below average at 35% of the 905 sites with available data across Australia in April (based on records since 1975). Below to very much below average rainfall, particularly in north-eastern New South Wales and south-eastern Queensland, reduced root zone soil moisture and runoff in those catchments. Regions with a high proportion of sites with lower-than-average streamflow included:
- western and central-eastern areas of the South East Coast (Victoria) drainage division (21% of 98 sites) and sites in the South Australian Gulf (80% of10 sites)
- eastern Tasmania (55% of 22 sites)
- across the Murray–Darling Basin (47% of 338 sites) and northern areas of the South East Coast (New South Wales) drainage division (59% of 100 sites)
- central and southern areas of the North East Coast (13% of 166 sites) and a single site in Lake Eyre Basin
- the central west and southern areas of the South West Coast drainage division of Western Australia (25% of 76 sites) and three sites in the Pilbara–Gascoyne drainage division (20% of 15 sites).
Very much below average streamflow (in the lowest 10% of years since 1975) was recorded in April at 10% of sites including:
- in the north-east and south-east areas of the Murray–Darling Basin (12% of 338 sites)
- sites in the northern areas of South East Coast (New South Wales) (26% of 100 sites), seven sites in the west and central east areas of the South East Coast (Victoria) (7% of 98 sites), and three sites in Tasmania (14% of 22 sites)
- a single site in the South Australian Gulf
- four sites in the south of the North East Coast drainage division (2% of 166 sites)
- two sites in the South West Coast drainage division of Western Australia.
Streamflow in April was average at 47% of sites spread across the country.
Above average streamflow was recorded at 18% of sites, with 3% of sites observing very much above average streamflow (in the highest 10% of years since 1975). Regions with above average streamflow included:
- the Tanami–Timor Sea Coast drainage division (90% of 29 sites), across the Carpentaria Coast drainage division (91% of 32 sites) and in the Lake Eyre Basin drainage divisions in Queensland (56% of 9 sites)
- across the North East Coast drainage division in Queensland (22% of 166 sites)
- a single site in the South East Coast (New South Wales) drainage division in addition to north and southern areas of the Murray–Darling Basin (10% of 338 sites)
- across the South East Coast (Victoria) drainage division (16% of 98 sites) and a single site in the South Australian Gulf
- the South West Coast drainage division of Western Australia (12% of 76 sites) and in the Pilbara–Gascoyne drainage division (47% of 15 sites).
In April, higher than average root zone soil moisture and increased runoff in parts of northern and north-eastern Australia, contributing to the above average April streamflow in those catchments.

Low water storage levels in western Victoria, the southern Murray–Darling Basin and central Queensland
By the end of April, total water storage across Australia—based on 302 public storages—was at 67.2% of capacity, down by 2.1% from the previous month, and 2.2% higher than at the same time last year. Storage volumes decreased in 231 storages during April, with 84 storages below 50% at the end of the month, including those in:
- central eastern Queensland
- the southern and eastern Murray–Darling Basin
- Victoria, particularly in western areas
- South Australia
- Perth urban storages
- central Tasmania.
Declines in storages across eastern New South Wales and south-eastern Queensland were largely driven by a combination of reduced catchment runoff and elevated water use, associated with below to very much below average rainfall across these areas. In Victoria, predominantly below-average rainfall conditions during April, together with persistently dry catchment conditions since 2023, have limited inflows to major storages. High agricultural water use during the spring and summer high-demand period has further contributed to relatively low storage levels entering autumn. In south-west Western Australia, extended dry conditions over multiple years have reduced effective recharge. As a result, storage levels remain low due to limited inflows and ongoing supply demands, with little evidence of recovery during April.

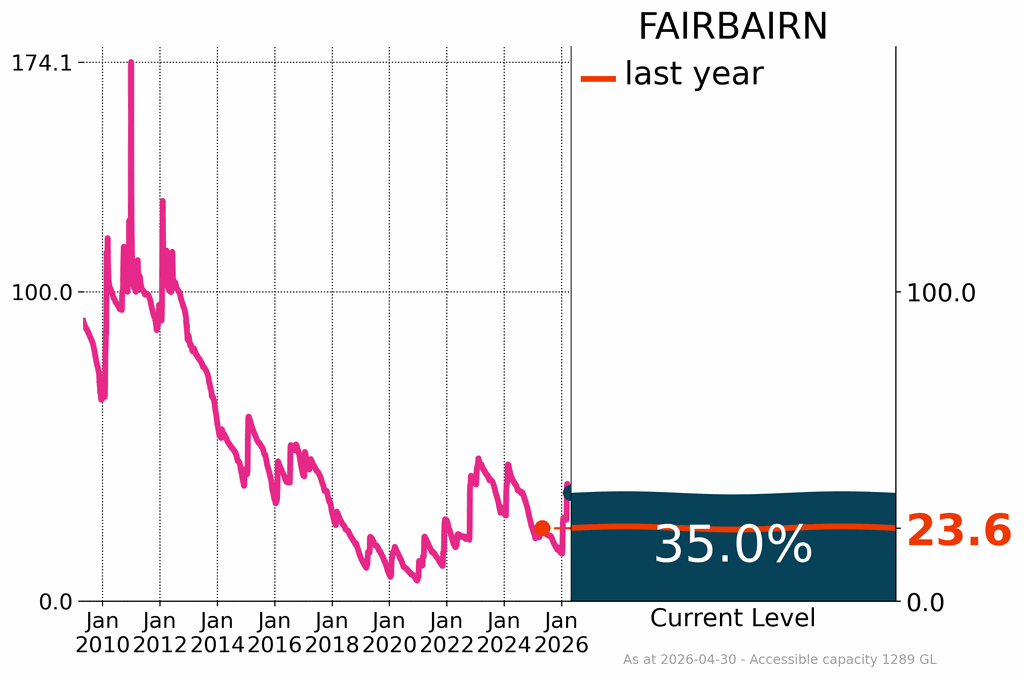
North East Coast
Overall, water storages across the North East Coast drainage division were at 80.7% of capacity at the end of April. Some storages were at full capacity and increased from last month, but several storages remained below 50% of capacity at the end of April. Fairbairn Dam, Queensland’s second-largest storage, finished the month at 35.0%, an increase 11.4% from previous year.
South-eastern Australia
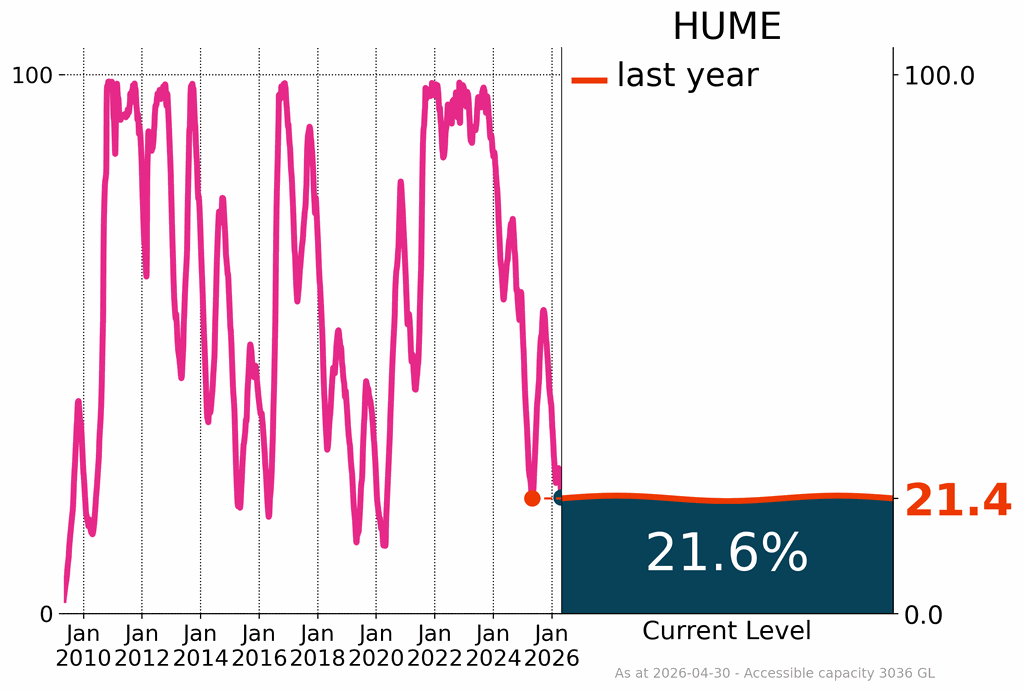
Many storages across the Murray–Darling Basin and the South East Coast (Victoria) drainage divisions were below or close to 50% of capacity at the end of April, including Hume Dam, Australia’s seventh-largest reservoir, and Lake Eucumbene. Hume Dam decreased by 5.4% during April, finishing at 21.6%, and slightly higher, 0.2% than at the same time last year. Menindee Lakes in western New South Wales decreased by 2.8%, finishing at 25.7% of capacity at the end of April and slightly below (0.3%) from last year.
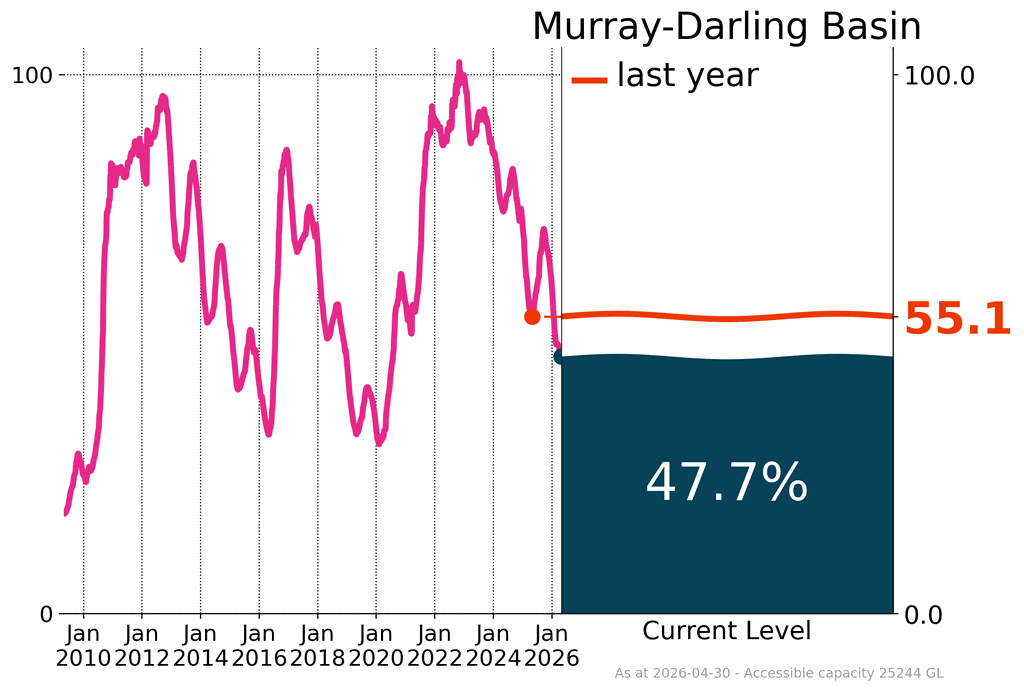
The overall storage volume across the Murray–Darling Basin decreased by 2.1% during April, finishing the month at 47.7%, 7.4% lower than at the same time last year. The southern Murray–Darling Basin decreased by 2.2% over the month, finishing at 45.7% capacity at the end of April, around 8.4% lower than at the same time last year. This decline reflects dry catchment conditions combined with elevated water use during the irrigation season (October to March), which reduced inflows and increased drawdown of available storage.
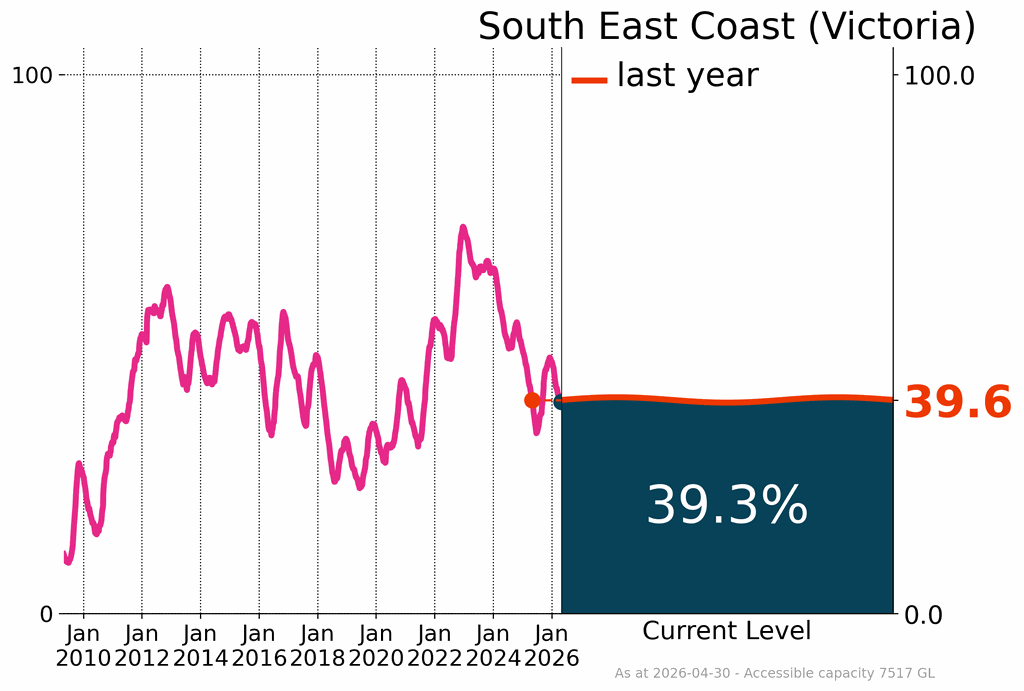
While parts of Victoria recorded moderate rainfall during April, western catchments received relatively low totals, generally around 10 to 50 mm. Ongoing rainfall deficiencies across these areas have limited runoff and groundwater recharge. Overall storage volume across the South East Coast (Victoria) drainage division decreased by 1.1% in April, ending the month at 39.3%. In the Wimmera–Mallee system, a critical rural water supply for domestic and agricultural use in western Victoria, storages were at 31.3% of capacity, down by 1.7% compared to the previous month, and 5.5% lower than at the same time last year.
Urban storages
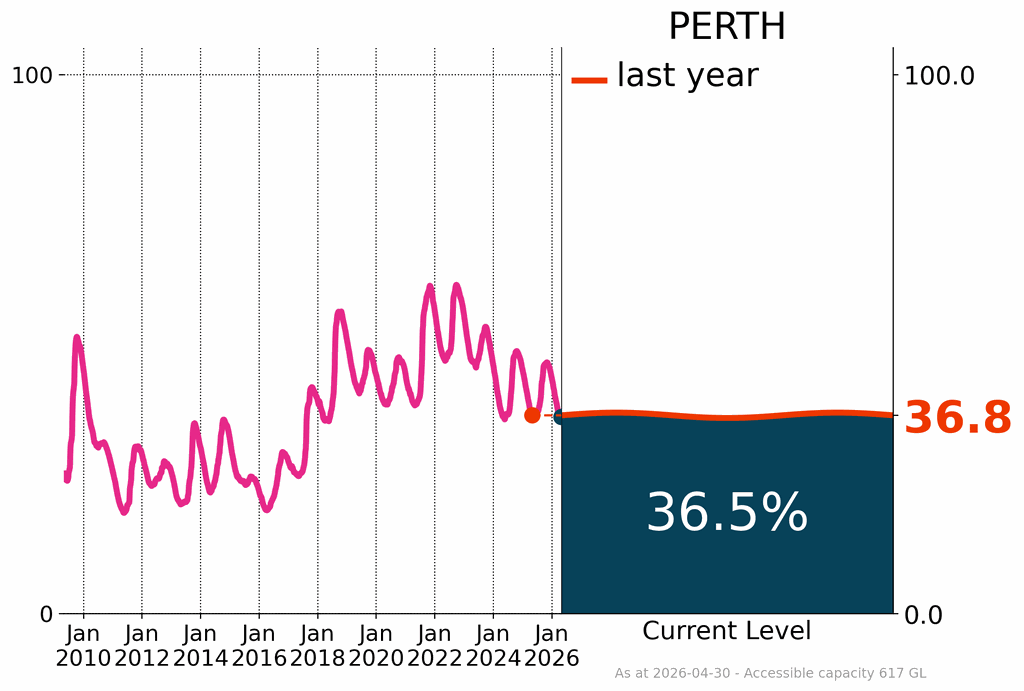
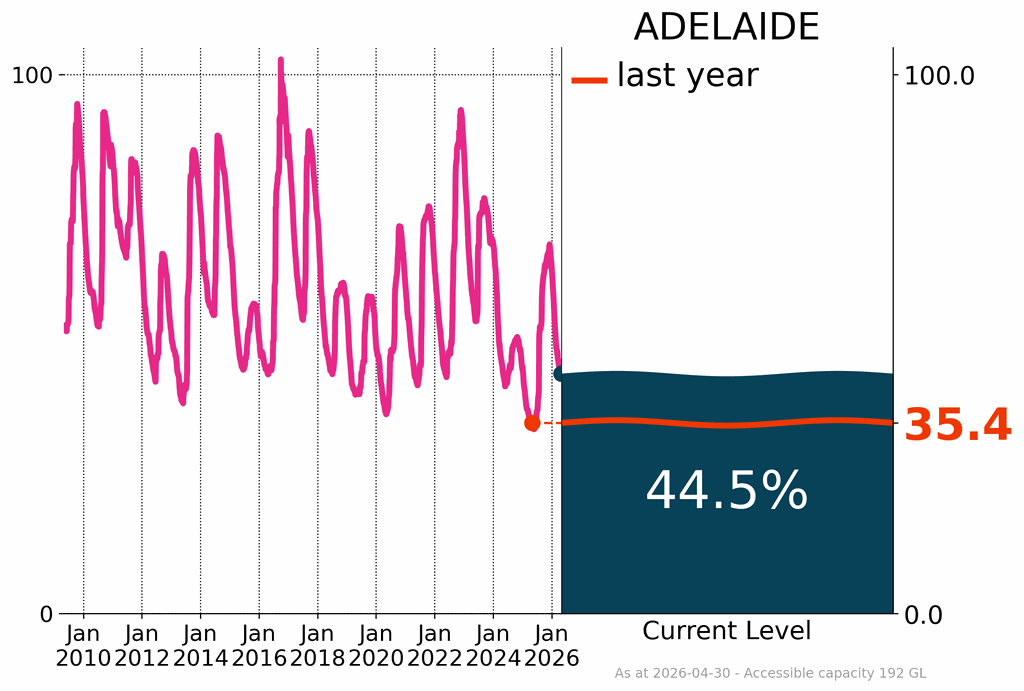
At the end of April, surface water storages supplying most capital cities were close to or above 80% of accessible capacity, with the exception of Melbourne, Adelaide and Perth. Storages for these cities are relatively low, following extended periods of severe rainfall deficiencies reducing storage inflows and increasing water demand.
Perth’s surface water storages were at 36.5% of accessible capacity at the end of April, a slightly decrease of 0.6% from the previous month, and slightly lower (0.3%) than at the same time last year. The long-term decline in surface water inflows has reduced the contribution of surface storages to Perth’s water supply, and the city continues to rely heavily on desalination and groundwater to meet urban water demand.
Adelaide’s storages were 44.5% full at the end of April, a decrease of 1.9% from the previous month, but remaining 9.1% higher than at the same time last year. By the end of April, six of Adelaide’s metropolitan storages were at or below 50% capacity. Storage levels have been influenced by prolonged dry conditions, historically low catchment inflows, limited rainfall during key recharge periods, and high-water demand over the summer period.
Adelaide’s urban water supply is supplemented by transfers from the River Murray, with additional climate-independent supply provided by desalination and groundwater. River Murray pipelines also support water supplies to the Eyre and Yorke peninsulas and parts of south-east South Australia.
Despite rainfall being average to below average across much of Victoria during April, Melbourne's water storages decreased by 2.2% from the previous month, finishing at 65.4% capacity. Melbourne's storages have declined by 10.0% since this time last year, reflecting ongoing rainfall deficiencies, very low catchment inflows, and increased water demand under dry conditions. In response to persistent rainfall deficiencies, the Victorian desalination plant has been in operation to support water supply to the Melbourne and Geelong areas.
Product code: IDCKGD0AR0
![]() Unless otherwise noted, all maps, graphs and diagrams in this page are licensed under the Creative Commons Attribution 4.0 International Licence
Unless otherwise noted, all maps, graphs and diagrams in this page are licensed under the Creative Commons Attribution 4.0 International Licence
