
Most popular feature on our website
Visits to our website tell us that watching the rain radar is a favourite national pastime.
Our website is one of the most visited Australian government websites and the rain radar and weather maps are the most used feature.
Let's take a look at the radar and weather map features, how you can customise it, and how it differs to other radar images.
How to use the weather map
Find your location
There are a few ways to find your location on the Rain radar and weather map:
- use your current location
- search for a location
- use the map's controls to pan and zoom to a location.
You'll also find the weather map on all location pages.
There are 3 ways to get forecasts, observations and the weather map all on one page:
- Select the location on the map and View more at this location.
- Enter your location or postcode in the main menu search bar.
- Click the star and select one of your saved favourite locations.
Learn how to save your most visited locations to your favourites.
Customise your map
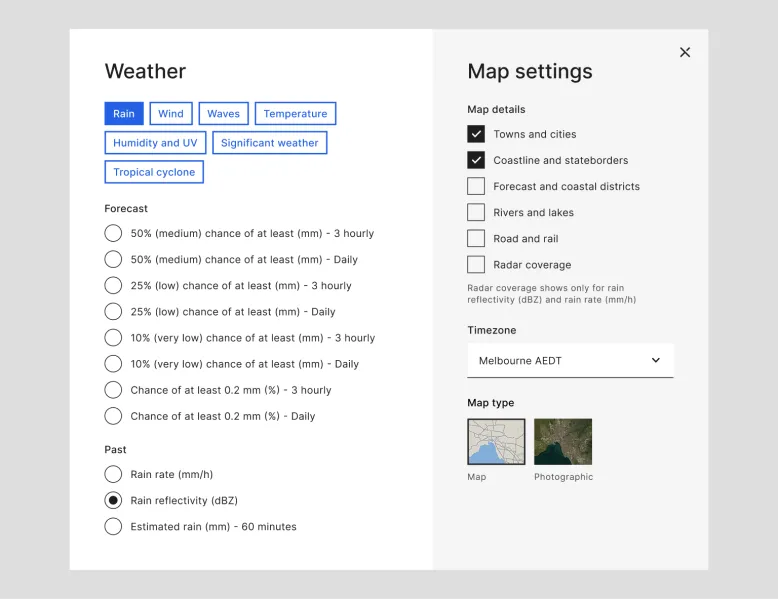
'More weather' is where you can choose what you want your map to look like and what weather to display. Under map settings you can add map features such as towns and cities, rivers and lakes, and radar coverage.
Use the buttons or tabs to choose the type of weather you want to see:
- rain, wind and waves
- temperature, humidity and UV
- significant weather, including thunderstorms, snow and fog
- tropical cyclone.
Ways to view rain on the map
You can choose to see observed rainfall as:
- rain rate in millimetres per hour (mm/h)
- rain reflectivity (intensity) in decibels of reflectivity (dBZ)
- estimated rain (mm) over the past 60 minutes.
Rain rate shows the depth of water that would accumulate in an hour if the rain kept falling at that exact same rate.
Rain reflectivity indicates the intensity of precipitation. It shows the strength of the radar signal reflected back from the precipitation. This depends on the diameter and number of drops in the cloud, as well as the presence of ice. The sensitivity to ice means that hail may show very strongly in reflectivity images even though the corresponding rain rate is low.
Estimated rain combines rain gauge and radar data, which is more accurate than using one of these alone.
Rain forecasts on the map
The map displays 3-hourly and daily chance of rainfall animations for different probabilities (10%, 25% and 50% chance of, chance of at least 0.2 mm).
If you also use the BOM Weather app, you may notice the app also shows a forecast of rain over the next 90 minutes. Sometimes referred to as 'nowcasting', this option is not currently available in any of our web-based radar images.
Learn more about radar and map functions.
Video: Website radar and map functions
You'll find the weather map on the rain radar and weather maps page, located on the main menu.
You'll also find the weather map on location pages for cities, states, districts, and more.
The new map is mobile friendly with simple pan, pinch, zoom and touch controls as well as keyboard and mouse controls. If you want the map to be bigger, you can make it full screen using the icon in the top right of the map.
Use the tabs at the top of the map or the map control button to select what you want to see – rain, wind, temperature or more.
To customise your background map, select 'More weather'. In map settings, you can add features like roads and rivers or choose a photographic map base. You only have to do this once. Next time you come back to the map, it will remember your settings.
Once you've got your background map set, use the buttons to choose the type of weather you want to see, like rain, thunderstorms, waves, and humidity. You can only see one weather type at a time.
When you first select rain, the map automatically displays radar images in dBZ.
In 'More weather', you can control how the radar displays past rainfall. Choose from rain rate, rain reflectivity, or estimated hourly rain.
Learn more at bom.gov.au/website-help.
Rain radar images
A more stable and reliable engine
As the population grows and more people use our services, our website needs to stay reliable. We rebuilt the platforms and systems that deliver data. The new weather map is designed to remain stable during demand surges and adapt as technology advances.
National radar mosaic
The weather map's observed rain rate and reflectivity images combine data from multiple radars into one view, known as a 'mosaic'. If you use our BOM Weather app, you’ll be familiar with this already.
You can view radar coverage across Australia in one interactive map viewer. There's no need to swap between different radar pages and radius views. Map controls like pan and zoom allow you to move easily between locations for awareness of approaching rain.
Correcting radar image contamination
Have you ever noticed odd patterns appearing in radar images?
The new radar display corrects various oddities, called artifacts, that contaminate radar images:
- Clutter – reflections from non-rain targets such as mountains, buildings and vehicles.
- Interference – disruption from other radio transmitters.
- Sea clutter – reflectivity over ocean areas where there is no actual rainfall.
- Insects – large numbers of insects can look like very light widespread rain, particularly near sunrise and sunset.
- Bright band – an effect that causes the radar signal to look artificially strong at some altitudes. It can happen as the radar beam passes through a layer of melting snow or ice.
- Smoke – ash from very intense fires, or pyrocumulus clouds.
The degree to which these problems can be corrected depends on the age and technology of the radar. Some more modern radars have dual-polarisation capability. These radars send and receive both horizontal and vertical waves. This gives extra information which helps us to make corrections.
Comparing radar displays
Weather radars perform many scans over 5 minutes at different elevation angles. This builds many observations for each point. There are many techniques to take 3-dimensional data and produce a 2-dimensional picture for display. Each technique has its advantages and disadvantages.
Legacy radar images
Legacy radar images show a cross-section of the atmosphere captured by radars at about 1.5 km above the ground. This was historically used due to its simplicity. This altitude is low enough to capture most rain while avoiding interference from tall buildings and mountains.
New radar images
The new rain radar images take a different approach. Instead of using a fixed height, the map presents the lowest available radar observations at each location. This means the picture better represents what's happening at ground level. It is more likely to match what you experience.
Overlapping radars
The scan time and number of sweeps to produce an image depends on the specifications of the radar. For example, Brisbane's Marburg and Mt Stapylton radars will show the same storm differently. The radar, distance from rain, and what is between the rain and the radar all influence what data is available and how it finally appears.
The mosaic displays the highest quality observation for locations where there is overlapping radar coverage. This is one of the reasons legacy radar images can look different to the new rain images.
Hail, intense rain and virga
A colour scale is used to indicate the intensity of rain, with the heaviest rain showing as black. Sometimes this indicates hail – but always use the radar with our other services. If there's a warning in place but you can't see anything on the radar, always follow the warnings.
The 3 examples below show why legacy radar images may display more intense reflectivity than new rain radar images. If different things are happening on the ground and at altitude, the new map's images preference what is on the ground.
Virga
Virga is rain that evaporates before reaching the ground. Sometimes rain falls from mid‑level clouds into dry air below. Much of it evaporates before reaching the surface. The legacy radar view – taken from around 1.5 km – shows strong echoes even when nothing is falling on the ground.
Melting hail
Hail melts as it falls through the warmer air nearer the surface. Radar reflectivity is extremely sensitive to the size of the precipitation (raindrops or hailstones). Even a small change in the size of hailstones leads to a noticeable change in reflectivity. Legacy radar images are more likely to display intense rain or hail that never reaches the ground.
Hail and thunderstorms
Initially hail is held aloft by the very strong updrafts in a thunderstorm. At this point in the lifecycle of a storm, hail is only present at higher elevations, so there will be very large differences in reflectivity between the higher and lower elevations.
Learn more about understanding weather radar images.
Listening to feedback
Your feedback is important. We make regular updates to the map experience to address your feedback.
Based on your feedback, we have:
- switched the default rain view to rain reflectivity (dBZ)
- added more town and place names to the map
- improved map settings and usability
- added a radar coverage map layer
- improved the time between radar scans and map display
- set the map to remember your most recent pan and zoom when you return
- made your recently visited locations available in map search.
We're working on more update requests, including:
- quick links to all radar locations
- radar range rings to help you judge distance
- clickable radar icons on the map.