
What is a weather radar?
Radar is a short way to say 'radio detection and ranging'.
A weather radar enables us to see patterns of rain, hail and snow moving across the country. Rain, hail and snow are types of precipitation.
A rain radar is the same as a weather radar. Doppler radar is a weather radar that also shows wind speed.
This page explains how radars work. You'll find a list of Australian radars and the areas covered on our Radar network coverage page.
Video: Ask the bureau: How does a weather radar work?
Across Australia, you might have seen large white domes that look like a golf ball on a tee. That's actually a weather radar, and inside that ball is a rotating dish, or antenna, that detects precipitation.
Radar stands for radio detection and ranging and, as the name suggests, it works using radio waves. The dish sends out short pulses of electromagnetic waves at the speed of light. When these pulses hit water particles, they bounce back to the radar like echoes in a cave.
How long the pulses take to return to the radar determines the distance from the radar, and the strength of the return determines the type of precipitation. This information is converted to data on a map, which can be viewed on our website or app. A new image is produced every five minutes.
A colour scale shows rain intensity, with black marking the heaviest rainfall or sometimes indicating hail.
Australia has one of the largest radar networks in the world, with around 70 radars. They're generally placed in areas prone to severe weather, with large populations, or important to industries like agriculture and mining.
Radar does have some limitations. The curvature of the Earth means that the optimal range is between 5 and 200 kilometres. Beyond 200 kilometres, the radar might be showing rain that's falling high in the atmosphere, and this might not represent what's actually happening on the ground.
Even in the optimal range, radars can sometimes show virga, which is rain that is falling but evaporates before it hits the ground.
Another limitation is detecting low-level drizzle. This can be difficult to detect because the droplets are small and often form close to the ground below the radar's beam. The radar also can't scan directly overhead, creating what's known as a cone of silence.
Sometimes the radar can see things that look like rain but actually aren't. This is sometimes referred to as clutter. This happens because the beam is reflecting off things such as aircraft, flocks of birds, smoke or ash from fires, swarms of insects, or because of unusual atmospheric conditions where the beam is reflected back down towards the ground.
Permanent features such as buildings or mountains can get in the way of the radar beam, so we filter these out. That's why we try to locate radars in big open spaces.
Weather maps show the lowest possible observation from the radar, meaning what you see on the radar and what you experience on the ground are likely to match.
A number of our weather radars also have Doppler and dual polarisation capability.
Doppler radars measure precipitation speed, or velocity, towards or away from the radar and can help indicate severe weather. These radars don't measure total wind speed, ground-level conditions, or wind moving across the radar beam.
In addition, the dual polarisation capability sends and receives both horizontal and vertical waves, giving a clearer view of rain, hail and snow shape, size and composition. It also helps us remove clutter.
Radars pose no danger to the public. The constantly moving beam is angled up into the sky, away from people. We follow safety standards to protect our workers and restrict public access to the sites.
The radar is just one way that you can observe current conditions and works best when used in combination with other observations such as satellite imagery or automatic weather stations.
How weather radar works
Inside the radar's white sphere is a rotating dish, or antenna, that sends out radio waves in short pulses.
When these pulses hit water particles, they reflect back to the radar as 'echoes'. This signal can appear on the radar screen. It's like hearing an echo, which is sound waves reflecting off an object and bouncing back to your ears.
The time it takes for the pulse to return tells us how far away the particles are. The strength of the return signal can reveal the type of precipitation.
The antenna rotates once every 20 seconds.
We scan at low levels for rainfall and at higher altitudes for severe weather. We take 14 sweeps of increasing height above the horizon to build the image.
Taking multiple sweeps helps overcome problems. For example, objects blocking the beam in some sweeps.
Radar range
The radar beam's optimal range is 5–200 km.
Further from the radar, the returned echo becomes weaker. This happens because the radar beam gets wider with distance, so less of the beam is filled by rain. It reduces the echo intensity.
Precipitation further from the radar might not show, or may show with less intensity.
The radar beam gets further from the ground with distance. This is due to the curvature of the Earth.
The beam also angles up by a fraction of a degree to avoid reflecting off buildings, trees and other objects. (Objects produce a very strong signal, swamping weaker signals from reflected particles.)
As the beam gets higher further away from the radar, it can miss precipitation lower in the atmosphere. For example, a horizontal radar beam detects raindrops:
- at 1 km above the Earth, from rain 100 km away from the radar
- at 3 km above the Earth, from rain 200 km away from the radar.
The radar also can't scan directly above itself. This means no echoes are displayed above the radar site.
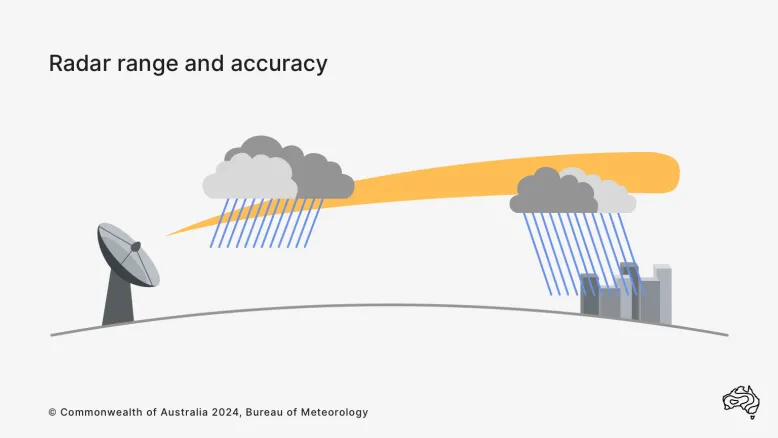
A radar beam gets higher as it moves away from the radar. This means it can miss rain and other precipitation lower in the atmosphere.
Parts of a radar
A basic radar has 4 main parts:
- transmitter – creates the energy pulse
- transmit and receive switch – tells the antenna when to send and when to receive the pulses
- antenna – focusses and increases the strength of transmitted and received signals
- receiver – detects, amplifies and transforms the received signals into video format.
The received signals are shown on a display system.
Radar outputs
Radar output generally comes in 2 forms:
- reflectivity – a measure of how much precipitation there is in a particular area
- velocity – a measure of the speed and direction of the precipitation. It may be travelling toward or away from the radar.
Weather radars can measure reflectivity. A Doppler radar also measures velocity.
Understanding weather radar images
Weather radar images are generally a map view. The map shows reflected particles for a specified area surrounding the radar.
Each colour on the radar display corresponds to a different level of energy pulse reflected from precipitation.
The strength of the pulse returned to the radar depends on:
- the size of the particles
- how many particles there are
- what state they are in – for example, solid (hail), liquid (rain)
- what shape they are.
With some assumptions, we can estimate the approximate rain rate at ground level.
Large particles with a liquid surface are the most reflective. For example, water-coated hailstones.
Rainfall and colours in weather radar images
Our radar images show where rain is happening, next to features of the local environment.
Different colours depict rainfall intensity. For example, off-white represents light drizzle.
There are 15 levels of rainfall intensity shown on the images. Each level indicates the approximate rainfall rate in millimetres per hour.
Often colours on the radar do not match actual rainfall measurements. It's the width of raindrops in the cloud that matter for radar, more than the amount of rain (rainfall rates).
Tropical maritime rainfall has many moderate-sized raindrops. The reflectivity is much less than for similar rainfall rates in rain clouds over land. They typically have very large raindrops but much less rain.
Features you may see on weather radar images
How accurate is a weather radar?
Radar is a very useful tool but it's not perfect.
Radar images don't always accurately reflect what's going on in the atmosphere. Not everything you see on the radar is precipitation.
Here are explanations for common radar issues.
If you still think the radar in your area may not be working, you can report this to us using the feedback form on our Contact page.
About Doppler radar
Doppler radars are weather radars that also measure wind speed (velocity). You can find Doppler radars in your state or territory on the Rain radar and weather maps page.
The Doppler effect
The Doppler effect is the theory that the frequency of waves changes when either the source or observer is moving. For example, an ambulance siren has a higher pitch when it is approaching. It has a lower pitch if it is travelling away.
Doppler weather radar uses this theory to work out the speed of precipitation travelling to or from the radar.
Rain, hail or snow generally moves with the wind as it falls. This means it's possible to work out the wind velocity with Doppler technology.
How Doppler radars work
Doppler radars measure radio waves reflected from rain, snow, hail and other smaller particles to show wind speed.
Radio waves are smooth and repetitive. The technical word for this is 'sinusoidal'. They have a crest and a trough. The distance between any 2 crests of a weather radar wave is 5–10 cm.
An electromagnetic pulse is sent from the radar, reflected by a particle and returns to the radar. When the pulse returns, it may be at a crest, a trough, or another phase of the wave cycle.
The wave is constant and regular. So is the timing and speed of successive pulses. If pulses return on a different phase of the wave, the reflecting particle is moving.
If the particle is not moving to or from the radar, the pulses travel the same distance. They return at the same phase of the wave.
If the particle is moving to or from the radar, the pulses return at a different phase of the wave. This is called a phase shift.
Bigger phase shifts mean the reflecting particle is moving faster. That is, it has a higher velocity.
By measuring the phase shifts, the Doppler radar shows the speed of the wind that carries the rain, hail or snow.
Limitations of Doppler radar
Wind speed measurements
Doppler radar does not measure total wind speed. It only measures the velocity of the wind travelling towards or away from the radar. The actual wind will be at least as strong as the Doppler velocity, and possibly stronger.
There are 2 parts to total wind speed:
- radial – towards or away from the radar
- transverse – crosswise.
Doppler radar only senses wind moving along the radial. This is a line directly towards or away from the radar, in any direction.
The radar cannot measure transverse wind, which moves at right angles to the radial. Crosswise movement does not affect the pulse returning to the radar.
Ground level conditions
Doppler velocity images also do not show wind speed at ground level. Winds at the height of the radar beam may be stronger than on the ground, but not always.
The radar beam is generally not pointed horizontally. It's angled upwards to avoid bouncing off nearby objects or topography.
Our Doppler velocity images come from a sweep at an elevation angle of 0.8 degrees above the horizontal.
This means the beam gets higher as it moves away from the radar. As the Earth is round, the ground curves away from the radar beam over distance.
Maximum Doppler range
Weather radar waves travel at the speed of light. By measuring the time it takes for a pulse to return, we can calculate how far the reflecting particle is from the radar.
Doppler weather radars send 500–1,000 pulses every second. This is so quick that the radar spends 99.8% of its time listening for returning pulses.
At 1,000 pulses a second, the maximum distance a pulse can travel to a reflecting particle and then return before the next pulse is sent is 150 km.
This is the maximum Doppler range. No data is displayed outside this range.
Doppler wind radar display
The Doppler velocity images show wind speed towards or away from the radar at each point, colour-coded according to a specific palette.
Wind speed coming towards the radar is blue, with pale shades for light winds and dark shades for strong winds.
Wind speed going away from the radar are orange with pale shades (yellow) for light winds and dark shades (red) for strong winds.
The Doppler velocity at any point can be estimated by comparing its colour to the velocity palette shown with the image.
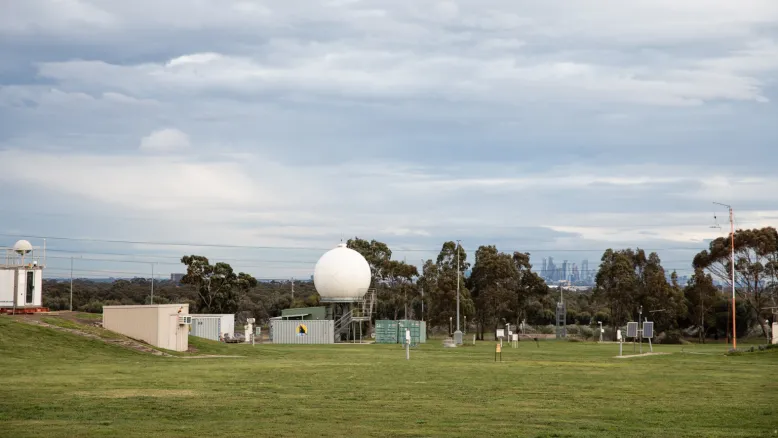
Inside the radar's white sphere is a rotating antenna that sends out radio waves in short pulses. Doppler radar measures the phase shift in these waves.
Maximum velocity displayed on Doppler radars
The maximum velocity that can be correctly displayed by a Doppler radar called the Nyquist velocity.
It depends on the wavelength and frequency of pulses emitted by the radar. Common Nyquist velocities for our Doppler radars are 95 km/h and 140 km/h.
When the radial wind speed is more than the Nyquist velocity, you may see it wrap to the other end of the radar display palette. This is called a 'velocity alias'. For example:
The Nyquist velocity of a radar is 90 km/h. A reflecting particle is moving directly away from the radar at 100 km/h. The displayed velocity will be 80 km/h, moving towards the radar.
You might see extremes of the Doppler velocity palette next to each other when this happens. For example, dark red (strong winds away from the radar) next to dark blue (strong winds towards the radar). This can indicate severe weather.