


Adelaide: Climate and water
For the water account period 1 July 2024 to 30 June 2025
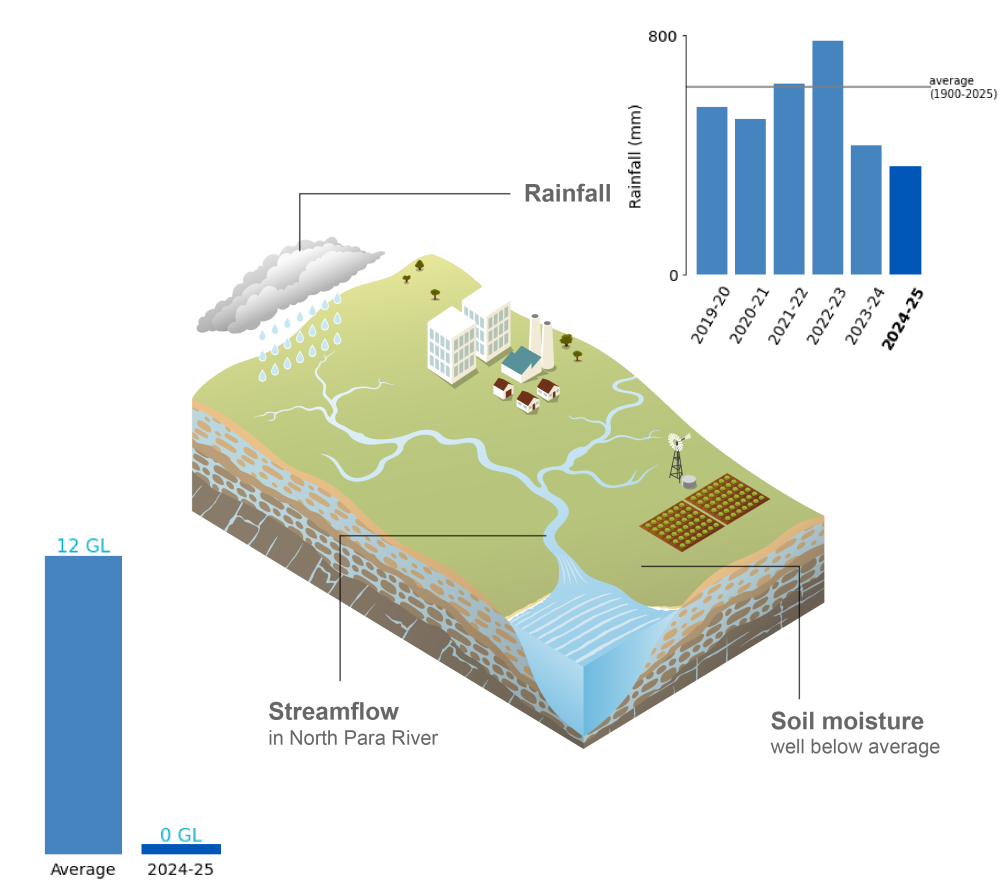
- Rainfall in the Adelaide region during 2024–25 was the lowest on record, contributing to the region's driest 24-month period on record.
- Soil moisture in the root zone (0–1 m depth) was below average across much of the region.
- Streamflows were extremely low across the region, with flows in the North Para River 97% below the long-term average, as no flow was recorded from January to June.
For further information on the climate and water conditions across the Adelaide region during the current reporting period, scroll down this page or click on the links below:
About the region
- The Adelaide region experiences a Mediterranean climate, characterised by cold to mild, wet winters and warm to hot, dry summers.
- Most of the region's rainfall occurs from April to October, aligning with southern Australia's wet season. Outside this period, rainfall is typically infrequent and unreliable.
- Streamflows in the region's rivers generally reflect the distribution of rainfall throughout the year, with higher streamflows and storage inflows occurring from June to August, while some river systems may cease to flow between December and March.
Climate conditions
Rainfall
Figure C1 Annual and monthly rainfall deciles for the Adelaide region during the 2024–25 reporting period
- Total area-averaged rainfall in the Adelaide region during 2024–25 was 361 mm, 43% below the long-term average of 629 mm, making it the driest reporting period on record and contributing to the region's driest 24-month period on record.
- Rainfall was below average throughout the entire reporting period, with only June finishing slightly below the long-term monthly average, highlighting the persistence of dry conditions across the region.
- Although two separate cold front systems delivered up to 200 mm to parts of the region in July and August, winter rainfall was still 21% below average, failing to replenish the rainfall deficiencies carried over from the previous reporting period, which was the driest on record at the time.
- Throughout spring, unfavourable large-scale climate patterns suppressed rainfall across southern Australia, with the region receiving just 55% of its long-term spring average, further exacerbating the prolonged dry conditions.
- While rainfall in summer is typically low, little rainfall was observed across the region, with summer totals 72% below the long-term seasonal average, ranking as the region's fourth-driest summer on record.
- Despite sea surface temperatures well above average across the Great Australian Bight during autumn, the region recorded its fifth-driest autumn on record, contributing to the region's driest December-to-May period on record.
- Several cold fronts and low-pressure systems broke the dry spell in June, with rainfall close to the long-term monthly average, though severe rainfall deficiencies remained across the region at the end of the reporting period.
- Further information on Australia's climate and water during the 2024–25 reporting period can be found in the Financial Year Climate and Water Statement 2024–25.
Figure C2 Total monthly rainfall for the Adelaide region during the 2024–25 reporting period, compared with the average and percentiles for the region
- Rainfall remained below average throughout the reporting period, with no month exceeding the 50th percentile, although June came closest to average conditions.
- While no month ranked below the 10th percentile, several months between August and May recorded rainfall close to that threshold, highlighting the persistent dry conditions across the region.
Actual evapotranspiration
Figure C3 Annual and monthly actual evapotranspiration deciles for the Adelaide region during the 2024–25 reporting period
- Total area-averaged actual evapotranspiration was below average across much of the Adelaide region during 2024–25, particularly away from the coastal fringes, consistent with rainfall deficiencies and limited moisture availability throughout the reporting period.
- At the start of the reporting period, evapotranspiration was already below average across much of the region, particularly through inland areas, consistent with the dry conditions carried over from the previous reporting period, which was the region's driest on record at the time.
- In response to increased winter rainfall, evapotranspiration briefly improved in August, becoming average to above average across parts of the southern and eastern catchments.
- Evapotranspiration declined through spring, with below-average conditions emerging across the northern half of the region in September, before spreading further south during October as rainfall deficiencies intensified.
- Throughout summer, evapotranspiration remained below to very much below average across most of the region, with the driest signal most widespread in January and February, reflecting the combined effect of extremely low rainfall and limited soil moisture availability.
- Little change through autumn, with evapotranspiration remaining below to very much below average across most of the region, while April and May showed some of the more spatially extensive conditions of the reporting period.
- Evapotranspiration remained below average across much of the region in June.
Soil moisture
Figure C4 Annual and monthly soil moisture deciles for the Adelaide region during the 2024–25 reporting period
- Total area-averaged soil moisture in the root zone (0–1 m depth) was below average across much of the Adelaide region during 2024–25, consistent with persistent rainfall deficiencies and limited effective recharge throughout the reporting period.
- Dry conditions carried over from the previous reporting period resulted in below-average soil moisture at the start of the reporting period.
- Below-average conditions reamained widespread throughout to the end of winter.
- Soil moisture continued to decline throughout spring, becoming below to very much below average as rainfall deficiencies intensified across the region.
- In response to extremely low rainfall and continued drying of the soil profile, soil moisture remained below to very much below average across most of the region during summer, with the most severe deficiencies emerging in February.
- Throughout the region's fifth-driest autumn on record, soil moisture showed little improvement, with below to very much below-average conditions persisting across almost the entire region.
- Although rainfall in June was close to average, soil moisture remained below average, indicating that near‑average June rainfall had not yet translated into a measurable recovery of longer‑term root‑zone moisture deficits.
- Further information on soil moisture conditions across the Adelaide region during the 2024–25 reporting period is available on the Australian Water Outlook.
Streamflow responses
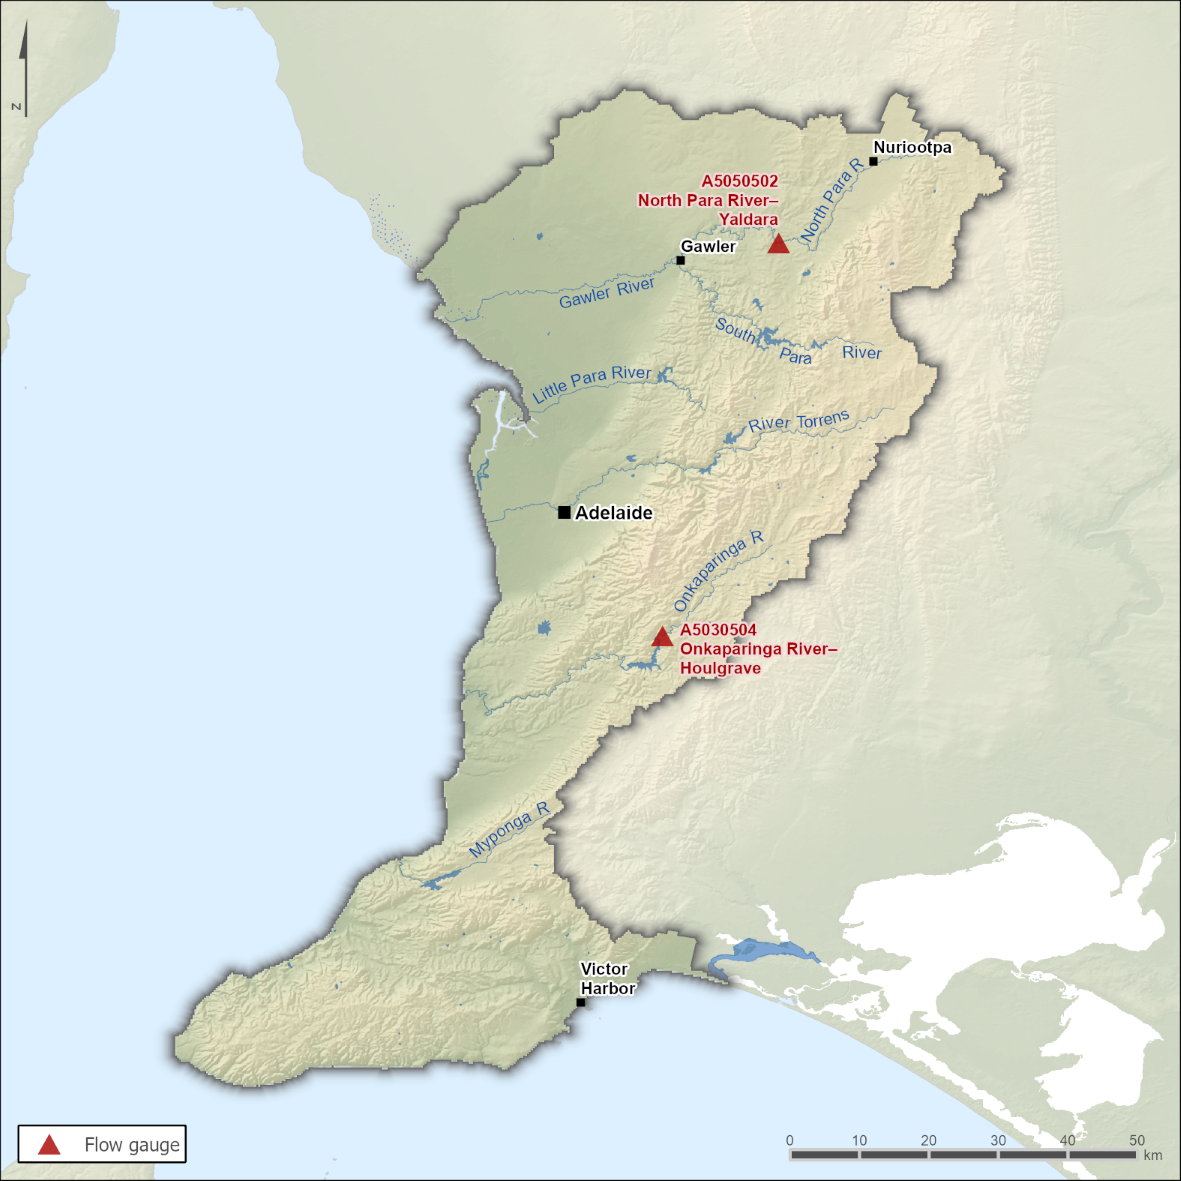
Figure C5 Key flow gauging stations along the main rivers within the Adelaide region
- Two gauging stations (shown in Figure C5) are used to represent seasonal flow patterns in the Adelaide region.
- The Onkaparinga River provides major inflows to Mount Bold Reservoir, the region's largest surface water storage.
- Flows in the North Para River upstream of the gauging station are unregulated and not influenced by diversions for consumptive use. In contrast, flows in the River Torrens are highly modified for urban and flood control purposes. Consequently, no gauging station is used to represent the River Torrens, as flows may not reflect natural seasonal conditions.
Figure C6 Total monthly streamflow for major rivers in the Adelaide region during the 2024–25 reporting period, compared with the average and percentiles for each gauging station
- Streamflows in the Adelaide region during 2024–25 were extremely low, with flows in the North Para River at Yaldara (Station A5050502) 97% below the long-term average of 12.3 GL.
- The North Para River showed little response in July and August, remaining close to or below the 10th percentile as dry catchment conditions carried over from the previous reporting period.
- Although streamflows generally peak between July and October, flows in the North Para River were 96% below the long-term average for this period, with the lowest monthly flows on record for both August and September reinforcing the severity of the prolonged low-flow deficiencies.
- In response to the region's driest December-to-May period on record, no flow was recorded in the North Para River from January through to the end of the reporting period.
- Several cold fronts and low-pressure systems brought rainfall close to the long-term monthly average in June, though no flow was observed in the North Para River.
Note: Due to technical difficulties reported at the Onkaparinga gauging station, no data were available for the 2024–25 reporting period.