


Adelaide: Supporting information
For the water account period 1 July 2024 to 30 June 2025
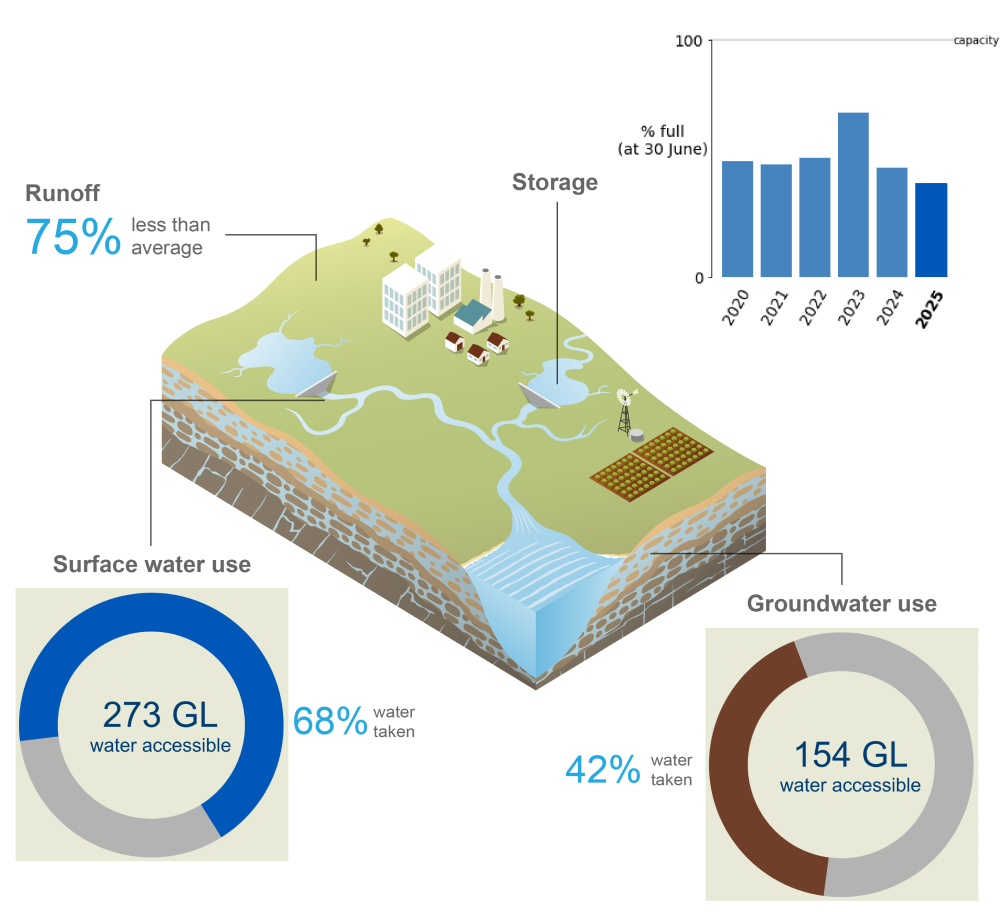
- Rainfall in the Adelaide region during 2024–25 was very much below average, contributing to reduced runoff and surface water inflows into the region’s surface water storages.
- Total storage volume in the Adelaide region decreased by approximately 15% during the reporting period, finishing at 39.5% full on 30 June 2025, the lowest end-of-year storage volume since 1999–00.
- Approximately 60% of surface water and groundwater resources in the Adelaide region were taken during the reporting period, primarily for surface water diversions to the urban system.
This section provides a detailed breakdown of water assets, liabilities, flows, availability, and use in the Adelaide region over the past six water accounting periods, outlining where water is stored and how it is used across the region.
For further information, scroll down this page or click on the links below:
Water assets
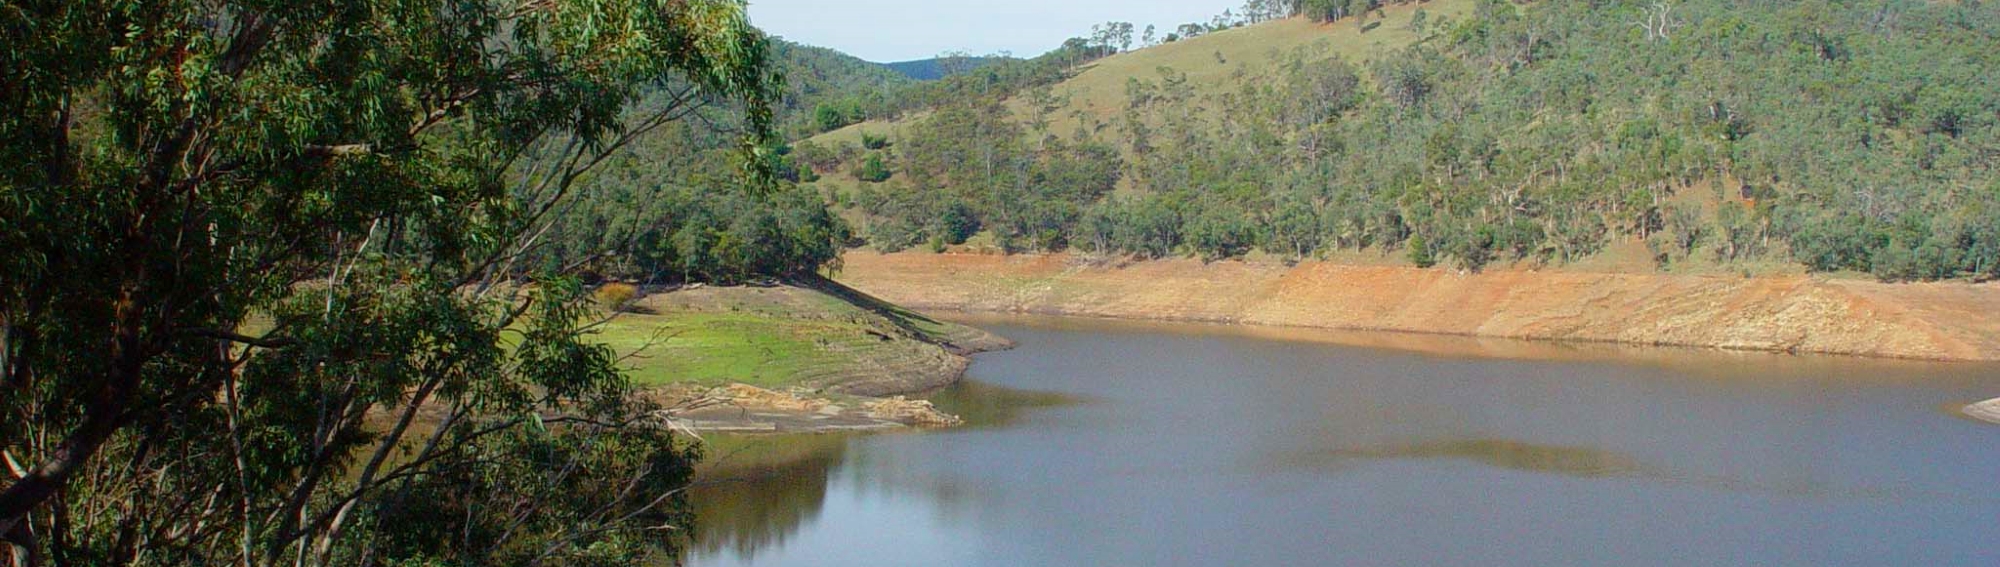
- Total water assets in the Adelaide region on 30 June 2025 were 165 GL, the lowest since the account commenced in 2009–10.
- Approximately 80 GL of the region's water assets were held in surface water storages, represented by 72 GL in accessible storages and the remainder in rivers and dead water storages.
- A detailed breakdown of water assets in the Adelaide region is available in the Statement of Water Assets and Water Liabilities.
Surface water assets
| Surface water | 2025 | 2024 | 2023 | 2022 | 2021 | 2020 |
| Barossa | 4,037 | 3,994 | 4,096 | 4,041 | 4,062 | 3,818 |
| Happy Valley | 6,891 | 6,905 | 6,900 | 8,347 | 6,912 | 6,101 |
| Hope Valley | 510 | 1,085 | 902 | 1,279 | 1,362 | 1,155 |
| Kangaroo Creek | 2,715 | 4,938 | 12,312 | 4,907 | 4,067 | 6,127 |
| Little Para | 6,553 | 7,940 | 13,778 | 6,200 | 5,557 | 9,723 |
| Millbrook | 9,276 | 6,742 | 9,093 | 8,850 | 7,292 | 7,763 |
| Mount Bold | 11,610 | 13,013 | 27,865 | 11,253 | 12,403 | 12,296 |
| Myponga | 13,312 | 17,933 | 24,121 | 23,494 | 22,970 | 22,037 |
| South Para | 14,151 | 19,954 | 31,697 | 20,252 | 19,040 | 16,541 |
| Warren | 3,274 | 2,583 | 752 | 4,786 | 4,776 | 4,844 |
| Accessible total | 72,329 | 85,087 | 131,516 | 93,409 | 88,441 | 90,405 |
| Dead storage | 6,234 | 6,234 | 6,234 | 6,234 | 6,234 | 6,234 |
| Total storage | 78,563 | 91,321 | 137,750 | 99,643 | 94,675 | 96,639 |
| Total capacity | 198,729 | 198,729 | 198,729 | 198,729 | 198,729 | 198,729 |
| % full | 39.5% | 46.0% | 69.3% | 50.1% | 47.6% | 48.6% |
- The total storage volume in the Adelaide region decreased by 14% during 2024–25, finishing at 39.5% full on 30 June 2025, the lowest end-of-year storage volume since 1999–00.
- This was the sixth-lowest end-of-year storage volume in the Adelaide region since 1994, corresponding to reduced surface water inflows to the region’s storages during the reporting period.
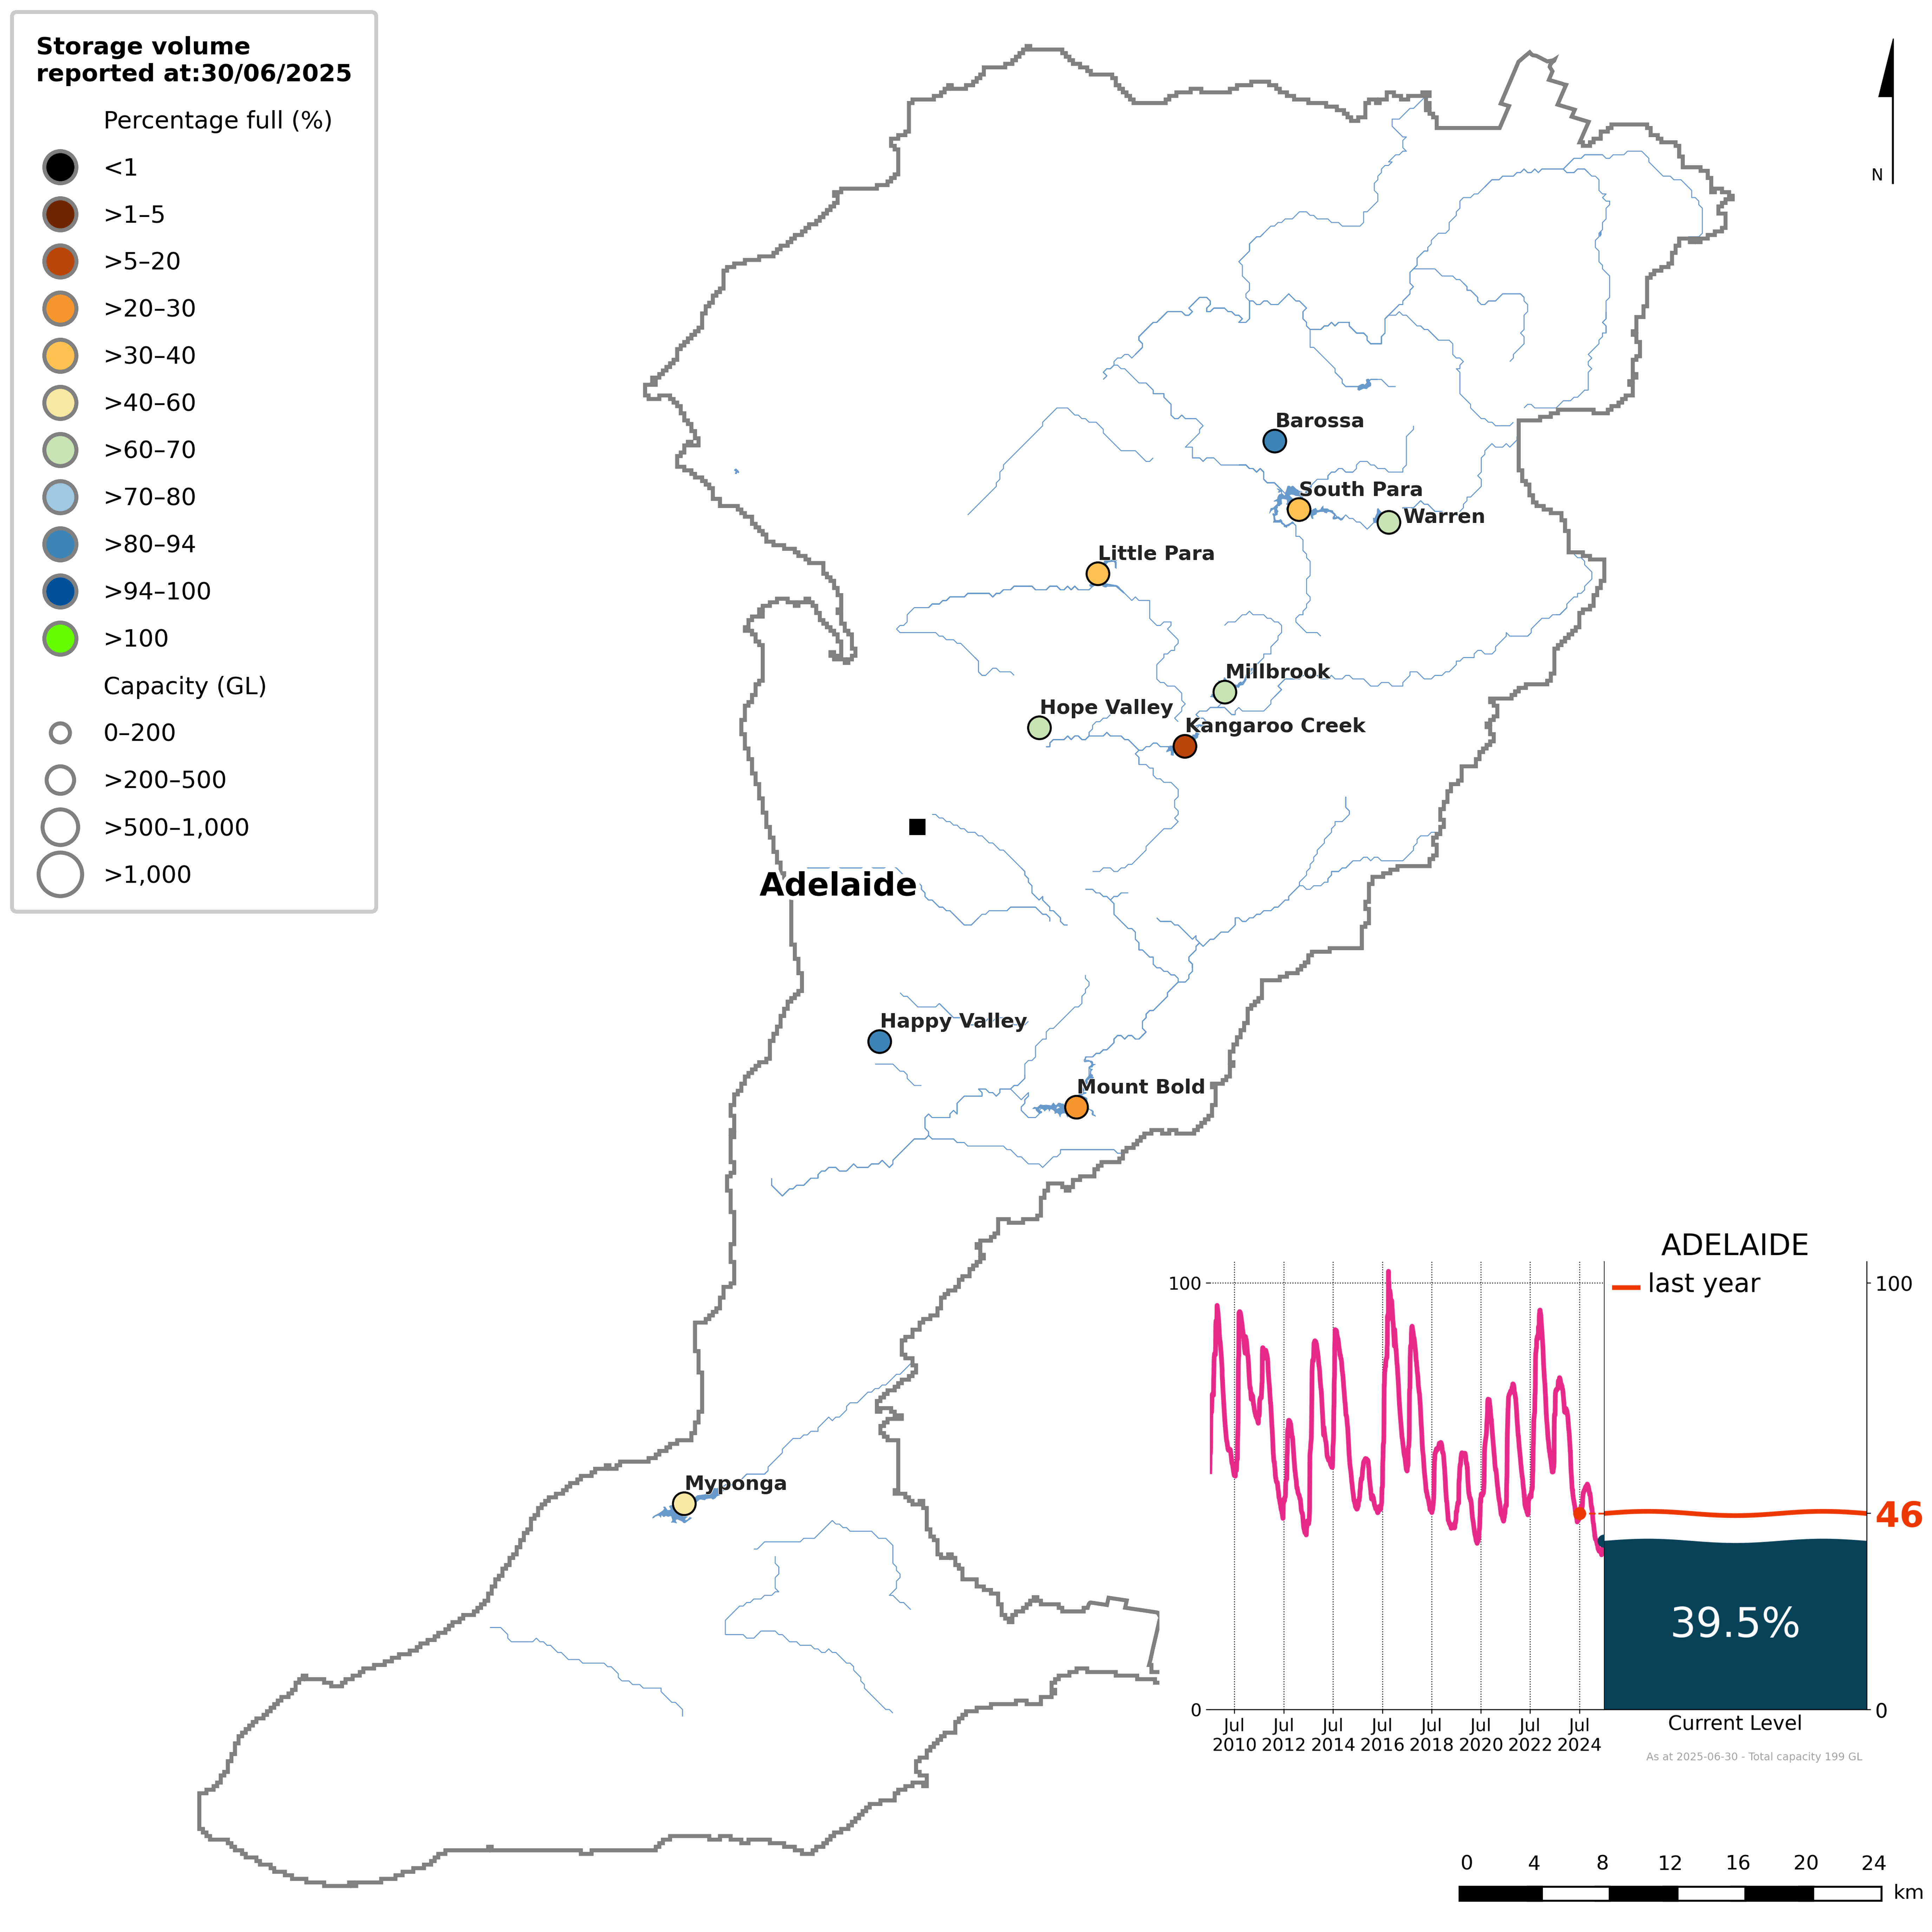
Figure S1 Percentage-full volume on 30 June 2025 for each storage and total storage volume since July 2009 (inset)
- The total storage volume in the Adelaide region began the 2024–25 reporting period at 46% full, the lowest opening storage volume since 2012–13.
- Although rainfall was below average throughout winter and spring, storage levels increased slightly, reaching a peak of 53% on 26 October, before beginning to decline.
- From November, storage volumes declined steadily, with the region's driest December-to-May period on record limiting surface water inflows to the region's storages.
- Storage volumes reached a low of 36% on 25 May, before recovering slightly in June, following near-average rainfall across the region.
- By 30 June 2025, the total storage volume in the Adelaide region was 39.5% full, down 14% from the same time last year, and the lowest end-of-year storage volume since 1999–00.
- More detailed information on individual storages in the Adelaide region is available on the Bureau of Meteorology's Water Information Dashboard.
Inter-region claims
- The water allocation plan for the River Murray Prescribed Watercourse provides an inter-region commitment of 650 GL over a rolling five-year period for the Western Mount Lofty Ranges Prescribed Water Resources Area.
- During periods of extended drought, the quantity of water that can be supplied to the Western Mount Lofty Ranges Prescribed Water Resources Area may be progressively reduced, and is reviewed depending on flows from upstream.
| Description | 2025 | 2024 | 2023 | 2022 | 2021 | 2020 | |
| Opening balance at 01 July | 0 | 0 | 0 | 0 | 0 | 0 | |
| add | Inter-region claims on surface water | 130,000 | 130,000 | 130,000 | 130,000 | 130,950 | 159,900 |
| less | Delivery received on surface water inter-region claims | 110,000 | 110,775 | 64,175 | 107,860 | 131,406 | 113,384 |
| less | Adjustments on inter-region claims on surface water | 20,000 | 19,225 | 65,825 | 22,140 | (456) | 46,516 |
| Closing balance at 30 June | 0 | 0 | 0 | 0 | 0 | 0 | |
- Inter-region claims on surface water in the Adelaide region were 130 GL during 2024–25, consistent with recent reporting periods.
- A total of 110 GL was delivered against claims on surface water from the River Murray, bringing the running five-year total to 524 GL, well within the 650 GL rolling five-year inter-region commitment set in the River Murray Prescribed Watercourse water allocation plan.
- As there are no carryover provisions attached to these inter-region commitments, all unused entitlements are forfeited at the end of the reporting period.
Water liabilities
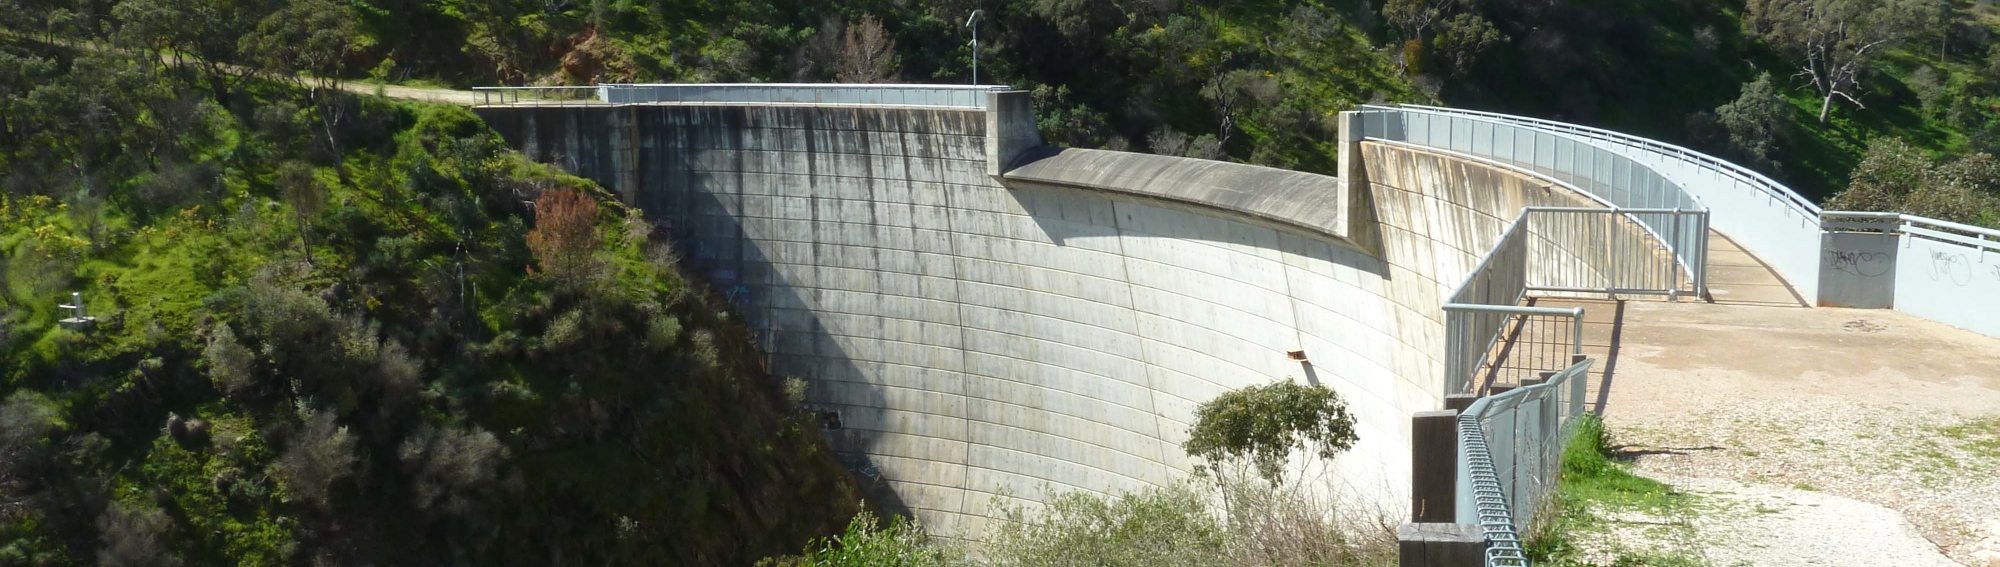
- Water liabilities in the Adelaide region refer to the volume of allocation remaining on licence entitlements at the end of the reporting period (30 June).
- In the Adelaide region, licences in the Barossa Valley Prescribed Water Resources Area for the North Para River include carryover provisions, which allow any unused portion of the allocation to be carried over to the next reporting period. For all other areas in the region, any unused allocations are forfeited at the end of the reporting period.
- A more detailed description of water allocations in the Adelaide region is provided in the Water use section.
Surface water liabilities
| Description | 2025 | 2024 | 2023 | 2022 | 2021 | 2020 | |
| Opening balance at 01 July | 0 | 5,959 | 16,086 | 332 | 622 | 307 | |
| add | Allocations | 36,568 | 29,831 | 29,493 | 29,484 | 14,768 | 14,768 |
| less | Allocated diversions | 21,734 | 28,140 | 28,620 | 2,967 | 3,360 | 3,012 |
| less | Adjustments and forfeitures | 14,834 | 7,650 | 11,000 | 10,763 | 11,698 | 11,441 |
| Closing balance at 30 June | 0 | 0 | 5,959 | 16,086 | 332 | 622 | |
| Description | 2025 | 2024 | 2023 | 2022 | 2021 | 2020 | |
| Opening balance at 01 July | 0 | 0 | 0 | 0 | 0 | 0 | |
| add | Entitlements | 143,045 | 143,045 | 143,045 | 143,045 | 143,045 | 143,045 |
| less | Diversions to the urban system | 70,605 | 77,175 | 100,957 | 70,284 | 50,323 | 33,745 |
| less | Adjustments and forfeitures | 72,440 | 65,870 | 42,088 | 72,761 | 92,722 | 109,300 |
| Closing balance at 30 June | 0 | 0 | 0 | 0 | 0 | 0 | |
| Description | 2025 | 2024 | 2023 | 2022 | 2021 | 2020 | |
| Opening balance at 01 July | 0 | 0 | 0 | 0 | 0 | 0 | |
| add | Allocations | 11,000 | 11,000 | 11,000 | 11,000 | 11,012 | 11,090 |
| less | Allocated diversions | 11,000 | 11,000 | 11,000 | 10,949 | 11,032 | 1,0765 |
| less | Adjustments and forfeitures | 0 | 0 | 0 | 51 | (20) | 325 |
| Closing balance at 30 June | 0 | 0 | 0 | 0 | 0 | 0 | |
- Surface water allocations for individual users in the Adelaide region during 2024–25 were 37 GL, 23% higher than the previous reporting period, with no water carried over from the previous account.
- Approximately 60% (22 GL) of allocations for individual users were diverted during the reporting period, with the remaining volume forfeited on 30 June 2025.
- Urban system entitlements were 143 GL during 2024–25, unchanged from recent reporting periods, with around 50% (71 GL) delivered to the urban system. All remaining entitlements were forfeited at the end of the reporting period.
- The irrigation scheme held 11 GL of surface water allocations, consistent with previous reporting periods, of which the full allocation was used during the reporting period.
Groundwater liabilities
| Description | 2025 | 2024 | 2023 | 2022 | 2021 | 2020 | |
| Opening balance at 01 July | 42,723 | 45,239 | 47,049 | 35,445 | 36,946 | 36,058 | |
| add | Allocations | 110,687 | 136,910 | 96,305 | 108,725 | 109,110 | 109,114 |
| less | Allocated extractions | 64,346 | 44,115 | 44,115 | 43,539 | 44,766 | 45,392 |
| less | Adjustments and forfeitures | 46,341 | 95,311 | 54,000 | 53,582 | 65,845 | 62,834 |
| Closing balance at 30 June | 42,723 | 42,723 | 45,239 | 47,049 | 35,445 | 36,946 | |
- Groundwater allocations for individual users in the Adelaide region during 2024–25 were 111 GL, around 20% lower than the previous reporting period, with 43 GL of water carried over from the previous year.
- Approximately 40% (64 GL) of total groundwater accessible for take was extracted during the reporting period, with 46 GL forfeited, resulting in 43 GL of water carried over into the next account.
Water flows
- Water flows in the Adelaide region describe the movement of water between surface water, groundwater, and the urban system.
- A summary of total inflows and outflows for each water store is provided below.
- For a detailed breakdown of inflows and outflows in the Adelaide region, refer to the Statement of Changes in Water Assets and Water Liabilities.
| Water inflows | 2025 | 2024 | 2023 | 2022 | 2021 | 2020 |
| Surface water inflows | 174,752 | 239,741 | 391,917 | 362,730 | 288,933 | 293,729 |
| Groundwater inflows | 209,710 | 366,707 | 467,109 | 376,598 | 348,151 | 285,665 |
| Urban system inflows | 307,441 | 419,207 | 381,006 | 387,056 | 403,442 | 283,964 |
| Irrigation scheme inflows | 38,827 | 52,766 | 47,760 | 53,098 | 48,565 | 31,841 |
| Total water inflows | 730,730 | 1,078,421 | 1,287,792 | 1,179,482 | 1,089,091 | 895,199 |
- Total water inflows to the Adelaide region during 2024–25 were 731 GL, approximately 30% lower than the previous reporting period, reflecting reduced inflows across all water stores.
- Surface water inflows accounted for nearly 25% (175 GL) of total inflows, decreasing by approximately 30% compared to the previous reporting period, largely driven by reduced runoff.
- Groundwater inflows contributed around 30% (210 GL) of total inflows, representing a decrease of 55% from the previous reporting period, primarily due to lower recharge across the landscape.
- Urban system inflows provided 40% (307 GL) of the region's total inflows, the largest component, despite declining by 25% compared to the previous reporting period.
- Inflows to the irrigation scheme made up the remaining 5% (39 GL) of total inflows, decreasing by around 25% from the previous reporting period, corresponding to reduced recycled water received from the urban system.
| Water outflows | 2025 | 2024 | 2023 | 2022 | 2021 | 2020 |
| Surface water outflows | 611,285 | 520,534 | 809,699 | 721,781 | 392,370 | 359,786 |
| Groundwater outflows | 67,554 | 48,079 | 47,931 | 48,413 | 46,440 | 47,736 |
| Urban system outflows | 269,857 | 539,666 | 493,424 | 544,130 | 477,812 | 245,638 |
| Irrigation scheme outflows | 38,827 | 34,200 | 34,200 | 34,238 | 32,988 | 24,776 |
| Total water outflows | 987,523 | 1,142,479 | 1,385,254 | 1,348,562 | 949,610 | 687,936 |
- Total water outflows from the Adelaide region during 2024–25 were 988 GL, approximately 15% lower than the previous reporting period, reflecting reduced urban system outflows despite increases in other components.
- Surface water outflows accounted for around 60% (611 GL) of total outflows, increasing by approximately 15% compared to the previous reporting period, primarily driven by higher river outflows to the sea.
- Groundwater outflows contributed around 5% (68 GL) of total outflows, representing an increase of just over 40% from the previous reporting period, largely due to higher allocated extractions by individual users.
- Urban system outflows made up approximately 25% (270 GL) of total outflows, around half the volume reported in the previous reporting period, and were the only component to decline during 2024–25.
- Outflows from the irrigation scheme were less than 5% (39 GL) of total outflows, entirely from deliveries to irrigation schemes across the region.
Water availability
| Surface water | 2025 | 2024 | 2023 | 2022 | 2021 | 2020 |
| Water availability | 288,152 | 393,665 | 550,776 | 441,593 | 366,367 | 410,702 |
| Water accessible | 273,113 | 272,994 | 243,173 | 264,542 | 271,119 | 252,303 |
| Water taken | 185,839 | 199,474 | 184,126 | 164,932 | 166,367 | 130,940 |
| % water accessible taken | 68% | 73% | 76% | 62% | 61% | 52% |
- Surface water availability in the Adelaide region during 2024–25 was 288 GL, approximately 25% lower than the previous reporting period, and the lowest since 2010–11.
- The decrease in water availability was largely driven by lower opening storage levels, along with runoff, which was almost half the volume of the previous reporting period.
- Despite the decline in water availability, the volume of water accessible for take remained relatively stable at 273 GL, similar to the previous reporting period, and the highest since 2019–20, primarily due to increased surface water allocations to individual users.
- Water taken from surface water resources in the Adelaide region during 2024–25 was 186 GL, around 5% lower than the previous reporting period, mainly due to decreased allocated diversions to the urban system.
- Overall, nearly 70% of surface water accessible for take in the Adelaide region was taken during the reporting period, with diversions to the urban system accounting for 90% of total water use.
Water use
Consumptive use
- A total of 250 GL of water was taken from surface water and groundwater resources for consumptive use in the Adelaide region during 2024–25, slightly higher than the previous reporting period, and the lowest since 2010–11.
| Surface Water | 2025 | 2024 | 2023 | 2022 | 2021 | 2020 |
| Individual users | ||||||
| Barossa Valley PWRA | 2,592 | 1,140 | 1,093 | 1,919 | 2,221 | 1,905 |
| Western Mount Lofty Ranges PWRA | 19,142 | 27,000 | 27,527 | 1,046 | 1,137 | 1,105 |
| Other | 0 | 0 | 0 | 2 | 2 | 2 |
| Sub-total | 21,734 | 28,140 | 28,620 | 2,967 | 3,360 | 3,012 |
| Urban system | ||||||
| Barossa Valley PWRA | 0 | 0 | 0 | 0 | 0 | 0 |
| Western Mount Lofty Ranges PWRA | 65,037 | 60,016 | 54,622 | 57,002 | 57,950 | 55,869 |
| Other | 99,068 | 111,318 | 100,884 | 104,963 | 105,057 | 72,059 |
| Sub-total | 164,105 | 171,334 | 155,506 | 161,965 | 163,007 | 127,928 |
| Total | ||||||
| Barossa Valley PWRA | 2,592 | 1,140 | 1,093 | 1,919 | 2,221 | 1,905 |
| Western Mount Lofty Ranges PWRA | 84,179 | 87,016 | 82,149 | 58,048 | 59,087 | 56,974 |
| Other | 99,068 | 111,318 | 100,884 | 104,965 | 105,059 | 72,061 |
| Statutory rights | 0 | 0 | 0 | 0 | 0 | 0 |
| Total | 185,839 | 199,474 | 184,126 | 164,932 | 166,367 | 130,940 |
- Surface water diversions across the Adelaide region during 2024–25 were 186 GL, around 5% lower than the previous reporting period, with diversions to both individual users and the urban system decreasing compared to the previous account.
- The urban system accounted for less than 90% (164 GL) of total surface water use, comprising both allocated and non-allocated diversions, with water use decreasing slightly from the previous reporting period, but remaining the dominant component of use in the region.
- Non-allocated surface water diversions to the urban system comprise water imported from the River Murray and stored within the region's storages. Most of these diversions were drawn from the Happy Valley and Hope Valley reservoirs, located outside the region's prescribed water resources areas.
- Individual users made up the remaining 10% (22 GL) of total surface water use, decreasing by approximately 25% from the previous reporting period, primarily driven by reduced use within the Western Mount Lofty Ranges Prescribed Water Resources Area.
| Groundwater | 2025 | 2024 | 2023 | 2022 | 2021 | 2020 |
| Individual users | ||||||
| Barossa Valley PWRA | 3,309 | 4,950 | 4,950 | 4,886 | 6,179 | 5,975 |
| Western Mount Lofty Ranges PWRA | 27,779 | 20,205 | 20,205 | 19,997 | 20,698 | 20,746 |
| McClaren Vale PWA | 6,622 | 5,010 | 5,010 | 4,902 | 5,054 | 5,494 |
| Northern Adelaide Plains PWA | 26,636 | 13,950 | 13,950 | 13,754 | 12,835 | 13,177 |
| Sub-total | 64,346 | 44,115 | 44,115 | 43,539 | 44,766 | 45,392 |
| Total | ||||||
| Individual users | 64,346 | 44,115 | 44,115 | 43,539 | 44,766 | 45,392 |
| Irrigation scheme | 230 | 230 | 230 | 229 | 207 | 279 |
| Statutory rights | 0 | 0 | 0 | 0 | 0 | 0 |
| Total | 64,576 | 44,345 | 44,345 | 43,768 | 44,973 | 45,671 |
- Groundwater extractions in the Adelaide region during 2024–25 were 65 GL, around 45% higher than the previous reporting period, and the highest since 2010–11.
- The increase in groundwater use was largely driven by higher extractions in the Western Mount Lofty Ranges and Northern Adelaide Plains prescribed water areas.
- Individual users accounted for more than 99% of groundwater use in the region, with 64 GL extracted during the reporting period, also the highest since 2010–11.
- Extractions to the irrigation scheme made up a negligible proportion of total groundwater use, remaining consistent with previous reporting periods, and sourced entirely from non-allocated extractions in the Willunga Basin.
Allocations and diversions
| Surface water | 2025 | 2024 | 2023 | 2022 | 2021 | 2020 |
| Barossa Valley PWRA | ||||||
| Allocated announcements | 4,140 | 4,130 | 4,130 | 4,130 | 2,870 | 2,870 |
| Allocated diversions | 2,592 | 1,140 | 1,093 | 1,919 | 2,221 | 1,905 |
| % used | 63% | 28% | 26% | 46% | 77% | 66% |
| Western Mount Lofty Ranges PWRA | ||||||
| Allocated announcements | 174,833 | 168,107 | 167,769 | 167,761 | 154,305 | 154,305 |
| Allocated diversions | 89,747 | 104,175 | 128,484 | 71,330 | 51,460 | 34,850 |
| % used | 51% | 62% | 77% | 43% | 33% | 23% |
| Little Para | ||||||
| Allocated announcements | 640 | 639 | 639 | 638 | 638 | 638 |
| Allocated diversions | 0 | 0 | 0 | 2 | 2 | 2 |
| % used | 0% | 0% | 0% | <1% | <1% | <1% |
| Total | ||||||
| Allocated announcements | 179,613 | 172,876 | 172,538 | 172,529 | 175,813 | 157,813 |
| Allocated diversions | 92,339 | 105,315 | 129,577 | 73,251 | 53,683 | 36,757 |
| % used | 51% | 61% | 75% | 42% | 34% | 23% |
- Total surface water allocations in the Adelaide region during 2024–25 were 180 GL, slightly higher than the previous reporting period, continuing the elevated allocation volumes observed in recent years.
- Approximately 50% (92 GL) of allocated surface water was diverted during the reporting period, lower than the previous reporting period, primarily due to reduced diversions across the Western Mount Lofty Ranges Prescribed Water Resources Area.
- The Western Mount Lofty Ranges Prescribed Water Resources Area accounted for the majority of allocations and diversions in the Adelaide region, with around 50% (90 GL) of allocated water used during the reporting period.
- Surface water allocations in the Barossa Valley Prescribed Water Resources Area were 4 GL, similar to recent reporting periods, with 65% (3 GL) of allocations diverted during 2024–25, more than double the volume diverted in the previous reporting period.
- In the Little Para district, surface water allocations remained low, though no water was diverted during the reporting period, consistent with minimal use observed in recent years.
| Groundwater | 2025 | 2024 | 2023 | 2022 | 2021 | 2020 |
| Barossa Valley PWRA | ||||||
| Allocated announcements | 7,913 | 8,723 | 7,876 | 7,876 | 7,863 | 7,863 |
| Allocated extractions | 3,309 | 4,950 | 4,950 | 4,886 | 6,179 | 5,975 |
| % used | 42% | 57% | 63% | 62% | 79% | 76% |
| Western Mount Lofty Ranges PWRA | ||||||
| Allocated announcements | 53,274 | 61,236 | 53,234 | 55,014 | 55,590 | 55,581 |
| Allocated extraction | 27,779 | 20,205 | 20,205 | 19,997 | 20,698 | 20,746 |
| % used | 52% | 33% | 38% | 36% | 37% | 37% |
| McClaren Vale PWA | ||||||
| Allocated announcements | 6,524 | 8,837 | 6,522 | 6,520 | 6,508 | 6,508 |
| Allocated extractions | 6,622 | 5,010 | 5,010 | 4,902 | 5,054 | 5,494 |
| % used | 102% | 57% | 77% | 75% | 78% | 84% |
| Northern Adelaide Plains PWA | ||||||
| Allocated announcements | 42,976 | 58,114 | 28,673 | 39,315 | 39,149 | 39,162 |
| Allocated extractions | 26,636 | 13,950 | 13,950 | 13,754 | 12,835 | 13,177 |
| % used | 62% | 24% | 49% | 35% | 33% | 34% |
| Total | ||||||
| Allocated announcements | 110,687 | 136,910 | 96,305 | 108,725 | 109,110 | 109,114 |
| Allocated extractions | 64,346 | 44,115 | 44,115 | 43,539 | 44,766 | 45,392 |
| % used | 58% | 32% | 46% | 40% | 41% | 42% |
- Total groundwater allocations in the Adelaide region during 2024–25 were 111 GL, around 20% lower than the previous reporting period, with 64 GL of allocated groundwater extracted during the year, the highest since 2010–11.
- In the Western Mount Lofty Ranges Prescribed Water Resources Area, groundwater allocations were 53 GL, with 50% of allocated water extracted during 2024–25, an increase of approximately of 35% compared to the previous reporting period.
- Groundwater allocations in the Northern Adelaide Plains Prescribed Water Area were 43 GL, with 60% of allocated water extracted during the reporting period, nearly double the volume extracted in the previous year.
- Extractions in the McLaren Vale Prescribed Water Area slightly exceeded allocations, with allocations just over 25% lower than the previous reporting period, while extractions were the highest since 2010–11, increasing by 30% compared to the previous year.
- Approximately 3 GL of groundwater allocations in the Barossa Valley Prescribed Water Resources Area were extracted during 2024–25, approximately 30% lower than the previous reporting period.
Urban supply system
| Water sources | 2025 | 2024 | 2023 | 2022 | 2021 | 2020 |
| Surface water | 70,605 | 77,175 | 100,957 | 70,284 | 50,323 | 33,745 |
| Desalination water | 26,454 | 4,827 | 4,804 | 5,323 | 5,139 | 40,001 |
| Inter-region inflow | 93,500 | 94,159 | 54,549 | 91,681 | 112,684 | 94,183 |
| Total urban water supplied | 190,559 | 176,161 | 160,310 | 167,288 | 168,146 | 167,929 |
- A total of 191 GL of water was supplied to Adelaide’s urban system during 2024–25, just under 10% higher than the previous reporting period, and the highest since 2010–11.
- Inter-region inflows were the largest source of water supplied to the urban system, contributing 94 GL) of total supply, similar to the previous reporting period.
- Surface water supplied 35% (71 GL) of total urban water, decreasing by less than 10% compared to the previous reporting period.
- Desalinated water made up the remaining 27 GL of total supply, increasing more than fivefold from the previous reporting period, and the highest since 2019–20.
- For more information on the use of desalinated water in the Adelaide region, refer to SA Water's Seawater website.
| Supply of drinking water | 2025 | 2024 | 2023 | 2022 | 2021 | 2020 |
| Residential customers | 123,114 | 225,166 | 205,360 | 222,328 | 222,390 | 109,610 |
| Commercial & industrial customers | 30,330 | 55,696 | 51,752 | 54,252 | 35,572 | 31,467 |
| Agricultural & irrigation customers | 0 | 0 | 0 | 0 | 0 | 0 |
| Other customers | 0 | 0 | 0 | 0 | 0 | 0 |
| Total drinking water used | 153,444 | 280,862 | 257,112 | 276,580 | 257,962 | 140,730 |
- A total of 153 GL of drinking water was supplied to urban customers in the Adelaide region during 2024–25, around 45% lower than the previous reporting period, and the lowest since 2019–20.
- Residential customers accounted for approximately 80% (123 GL) of total drinking water supplied, decreasing by almost half compared to the previous reporting period.
- Commercial and industrial customers made up 20% (30 GL) of drinking water use, also declining by nearly half relative to the previous reporting period.
- No drinking water was supplied to agricultural, irrigation, or other customers during the reporting period, consistent with recent years.