


Perth: Key findings
For the water account period 1 July 2024 to 30 June 2025
- Rainfall in the Perth region during 2024–25 was below average for the seventh consecutive year.
- Groundwater levels in the Jandakot Mound superficial aquifer decreased by more than 1 m during the reporting year, while levels in the Gnangara Mound superficial aquifer changed little overall, declining slightly to finish at their lowest level of the year.
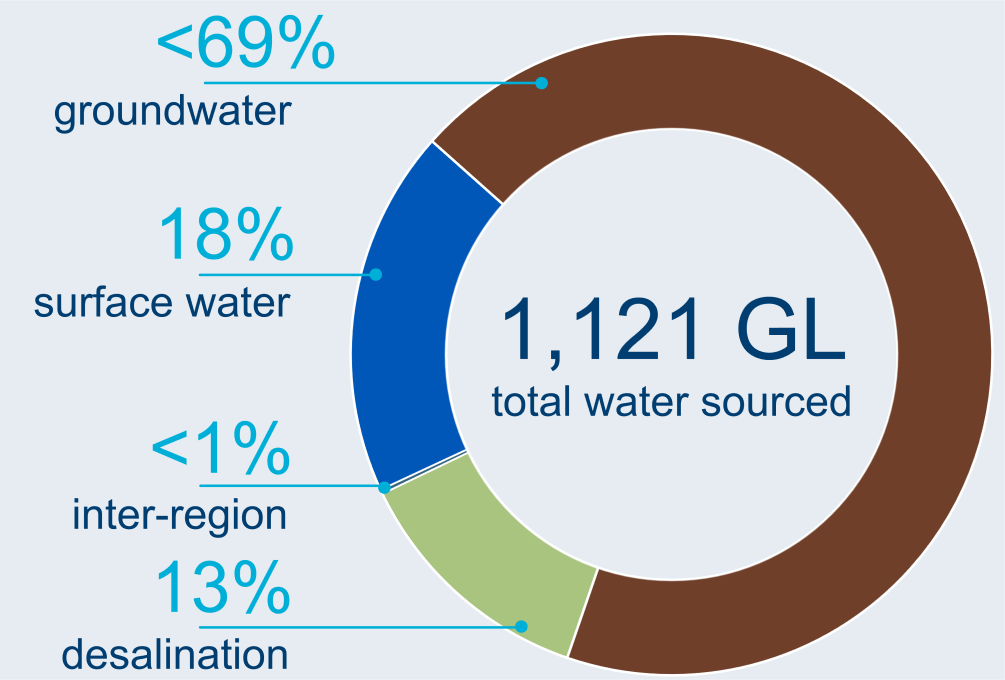
- Approximately 65% of the water resources accessible for take in the Perth region were used, primarily from groundwater extractions to individual users and the urban system.
Climate and water
Rainfall

483 mm
21% below the average of 794 mm
Streamflow

below average
throughout most of the year
Storage

39.9% full

3.0% more than last year
Water use from all water sources
Water sourced
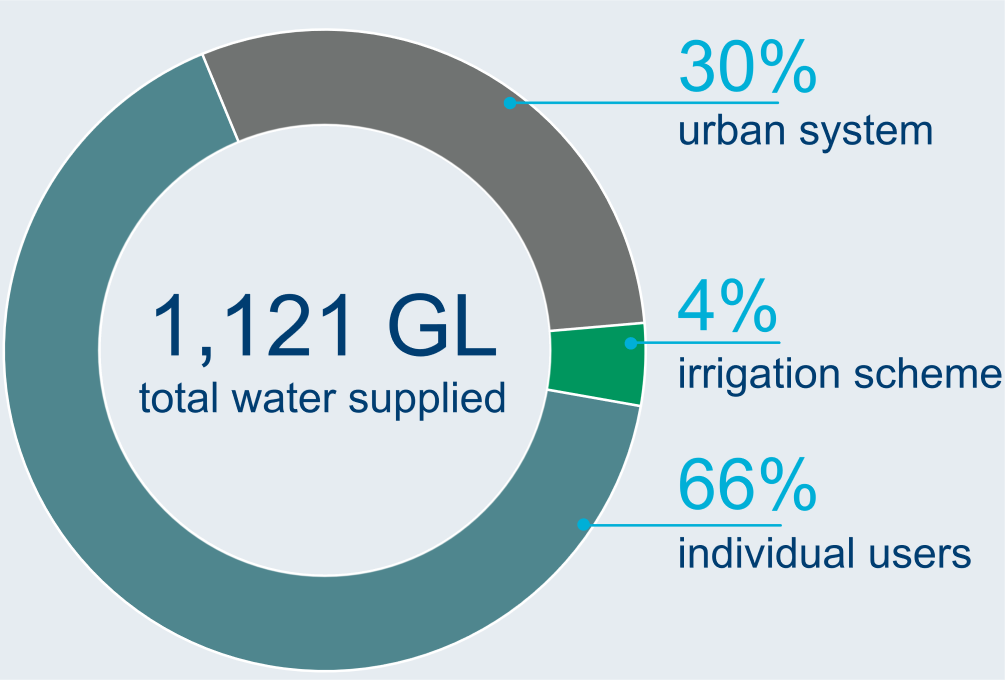
Water supplied
Water status of water resources
Water availability
1,392 GL
surface water available in 2024–25
17% more than last year
Water accessible
1,457 GL
total surface water and groundwater accessible in 2024–25
18% more than last year
Water taken
978 GL
total surface water and groundwater taken in 2024–25
29% more than last year