


Perth: Climate and water
For the water account period 1 July 2024 to 30 June 2025
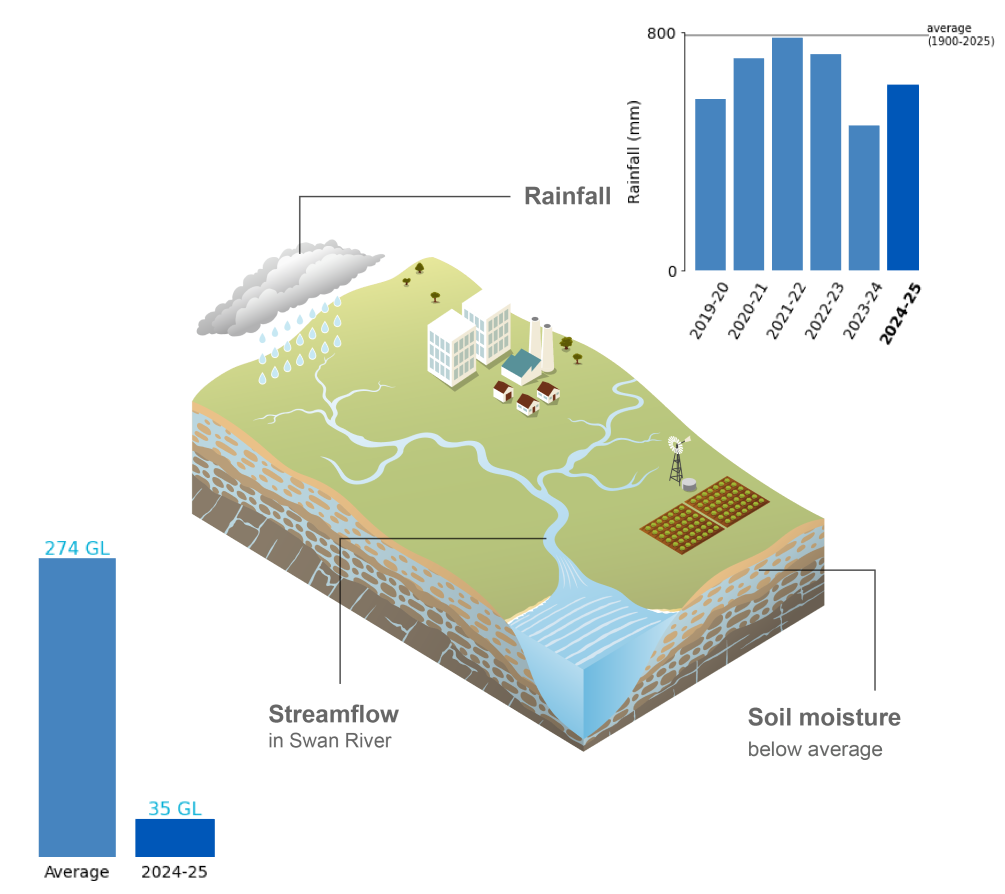
- Rainfall in the Perth region during 2024–25 was below average for the seventh consecutive year.
- Soil moisture in the root zone (0–1 m depth) was below to very much below average across most of the region, with some areas recording their lowest soil moisture on record.
- Streamflows in the Murray and Swan rivers were below average, while the Harvey River recorded near-average flows, reflecting the dry conditions throughout the year.
- Groundwater levels in the Jandakot Mound superficial aquifer decreased by more than 1 m during the reporting year, while levels in the Gnangara Mound superficial aquifer changed little overall, declining slightly to finish at their lowest level of the year.
For further information on the climate and water conditions across the Perth region during the current reporting period, scroll down this page or click on the links below:
About the region
- The Perth region experiences a hot-summer Mediterranean climate, characterised by warm to hot, dry summers and cool to mild, wet winters.
- Approximately 80% of the Perth region’s annual rainfall occurs between May and October, primarily due to cold fronts and low-pressure troughs that move across the region. Rainfall from November to April is typically sparse, with the occasional rainless month.
- Streamflows in the Perth region’s rivers generally reflect the winter-heavy seasonal rainfall pattern, with most surface water storage inflows occurring between June and October. In contrast, some rivers may cease to flow between December and April.
Climate conditions
Rainfall
Figure C1 Annual and monthly rainfall deciles for the Perth region during the 2024–25 reporting period
- Total area-averaged rainfall in the Perth region during 2024–25 was 622 mm, around 20% below the long-term average of 791 mm, marking the seventh consecutive year with below-average rainfall.
- During winter, rainfall across the Perth region was close to the long-term average, with several cold fronts delivering more than 400 mm to parts of the region.
- In contrast, rainfall from September through to May was well below average, resulting in a very dry warmer season period relative to the long-term average.
- Despite several cold fronts bringing rainfall in June, rainfall for the month remained below average, concluding anohter year characterised by subdued rainfall across the region.
- Consistent with longer term observations, the 2024–25 rainfall outcome reflects the ongoing drying trend in the Perth region.
- Further information on Australia’s climate and water conditions during the 2024–25 reporting period can be found in the Financial Year Climate and Water Statement 2024–25.
Figure C2 Total monthly rainfall for the Perth region during the 2024–25 reporting period, compared with the average and percentiles for the region
- August was the only month to record rainfall well above average, while rainfall in July, October, and March was close to average.
- From September through to June, rainfall was below average in most months, reflecting the persistently dry conditions during the reporting period.
- Rainfall in May ranked just below the 10th percentile, while rainfall in September was close to the 10th percentile.
Actual evapotranspiration
Figure C3 Annual and monthly actual evapotranspiration deciles for the Perth region during the 2024–25 reporting period
- Total area-averaged actual evapotranspiration was below to very much below average across most of the Perth region during 2024–25, reflecting the prolonged dry conditions and reduced water availability throughout much of the reporting year.
- In July, despite average rainfall, evapotranspiration was very much below average across most of the region, with some areas experiencing the lowest evapotranspiration on record for the month.
- Following average to above-average rainfall in July and August, evapotranspiration improved slightly in August, particularly across southern inland areas, but remained average to below average elsewhere.
- From September through to January, evapotranspiration was generally average to below average across much of the region, with a lack of significant rainfall leading to a gradual decline in water availability.
- Evapotranspiration declined sharply in February, becoming below average to very much below average across much of the region, before rebounding in March following rainfall, with average conditions persisting into April.
- With rainfall remaining below average from April onwards, evapotranspiration declined in May, with limited soil moisture recharge resulting in below average to very much below average conditions persisting through to the end of the reporting period.
Soil moisture
Figure C4 Annual and monthly soil moisture deciles for the Perth region during the 2024–25 reporting period
- Total area-averaged soil moisture was below to very much below average across most of the Perth region during 2024–25, reflecting reduced rainfall and limited soil moisture recharge throughout much of the reporting period.
- In July, soil moisture was generally below average across much of the region despite average rainfall during the month, reflecting dry antecedent conditions that limited effective recharge at the start of the reporting period.
- Soil moisture increased to above average across large parts of the region during August, particularly along the southern half of the region, in response to sustained winter rainfall and improved soil moisture recharge.
- Throughout September and October, soil moisture remained average to above average across much of the region, with near-average winter rainfall maintaining adequate soil moisture conditions into the first half of spring.
- From November through to February, soil moisture gradually declined across most of the region, becoming largely below average by the end of summer in response to the lack of significant rainfall events replenishing soil moisture levels.
- Following some rain in March, soil moisture improved across much of the region, particularly across inland southern areas, before declining again in April.
- During the back half of autumn, below-average rainfall led to a sharp decline in soil moisture in May, resulting in very much below average conditions across most of the region, with some areas experiencing the lowest on record for the month.
- Although there was a slight improvement in soil moisture during June, it remained below average across much of the region, with insufficient rainfall limiting soil moisture recharge heading into winter.
- Further information on soil moisture conditions across the Perth region during the 2024–25 reporting period is available on the Australian Water Outlook.
Hydrological responses
Streamflow
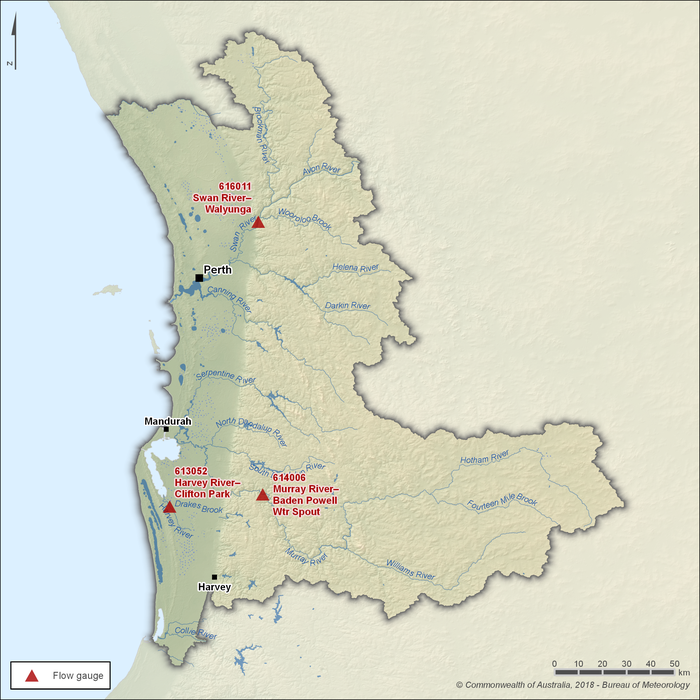
Figure C5 Key flow gauging stations along the main rivers within the Perth region
- Three gauging stations, shown in Figure C5, are used to represent the seasonal flow patterns in the Perth region.
- The Swan, Murray, and Harvey rivers are the largest rivers in the Perth region. The Swan River catchment extends eastward beyond the region, where it is known as the Avon River, while the Murray and Harvey river catchments lie entirely within the region.
- Streamflows in the Harvey River are influenced by several large dams, including Harvey Dam, Waroona Dam, and Logue Brook Dam, which regulate flows for irrigation and the integrated water supply scheme.
- Unlike the Harvey River, flows in the Murray and Swan rivers are unregulated and may cease to flow during summer and autumn due to seasonal rainfall patterns and limited catchment inflows.
Figure C6 Total monthly flow for major rivers in the Perth region during the 2024–25 reporting period, compared with the average and percentiles for each gauging station
- Streamflows in the Perth region during 2024–25 were below average, except for the Harvey River at Forrest Highway (Station 613036), where flows were close to the long-term average of 124 GL.
- Flows in the Murray River at Baden Powell (Station 614066) and the Swan River at Walyunga (Station 616011) were substantially below average, reflecting limited rainfall and reduced surface water inflows across much of the reporting period.
- Although streamflows in the Perth region typically peak between June and October, only the Harvey River observed a sharp increase during winter, peaking above the 90th percentile in August. In contrast, flows in the Murray and Swan rivers remained below average.
- In response to below-average rainfall during September, streamflows in the Harvey River declined sharply, returning to below-average levels in line with the Murray and Swan rivers, where flows remained below average throughout spring.
- From December through to May, flows remained near or below the 10th percentile across all sites. Flows in the Swan River ceased entirely from January to May, while no flows were observed in the Murray River during March and April, reflecting the prolonged dry period that limited surface water replenishment across the region.
- Despite the passage of several cold fronts in June, streamflows showed limited recovery, and flows at all sites remained below average towards the end of the reporting period.
Groundwater levels
- The Perth region includes several important aquifers, including the shallow superficial aquifers (Gnangara and Jandakot mounds) and the deeper confined aquifers of the Leederville and Yarragadee formations.
- Shallow superficial aquifers are an important source of water for public and self-supply purposes in addition to supporting numerous groundwater-dependent ecosystems across the Gnangara and Jandakot mounds. The Jandakot aquifer is smaller and shallower than the Gnangara aquifer, making it more susceptible to changes in groundwater levels.
- Deeper confined aquifers, including the Leederville and Yarragadee formations, are a major source of water for the urban water supply system, with groundwater levels more strongly influenced by extraction than immediate climatic conditions.
Figure C7 Groundwater levels for key bores within the Perth region since July 2009
- Groundwater levels in all aquifers across the Perth region finished lower at the end of 2024–25 compared to the same time in the previous year, with the Jandakot Mound superficial aquifer declining by more than 1 m—the largest decrease among the monitored aquifers.
- The decline in groundwater levels, particularly in the Jandakot Mound superficial aquifer, was largely attributed to limited groundwater recharge combined with increased groundwater extraction throughout the reporting period.
- Both the Gnangara and Jandakot superficial aquifers experienced slight rises in groundwater levels from late winter into spring following average to above-average rainfall, which increased groundwater recharge.
- Groundwater levels in both superficial aquifers declined through the warmer months, particularly following very dry conditions from September to May, with decreases of more than 2 m in the Jandakot Mound aquifer during that period.
- Throughout May and June, several cold fronts delivered much-needed rainfall to the region, contributing to a slight recovery in groundwater levels in the Jandakot Mound aquifer.
- Despite increased rainfall during June, groundwater levels in the Gnangara Mound aquifer continued to decline due to seasonal drawdown and limited recharge.
- More information on Perth’s groundwater resources is available in the Region description.