


Perth: Supporting information
For the water account period 1 July 2024 to 30 June 2025
- Rainfall in the Perth region during 2024–25 was below average, contributing to a decrease in runoff and surface water inflows into the region's surface water storages.
- Total storage volume in the Perth region increased by 3% during the reporting period, finishing at 39.9% full on 30 June 2025.
- Approximately 65% of the water resources accessible for take in the Perth region were used, primarily from groundwater extractions to individual users and the urban system.
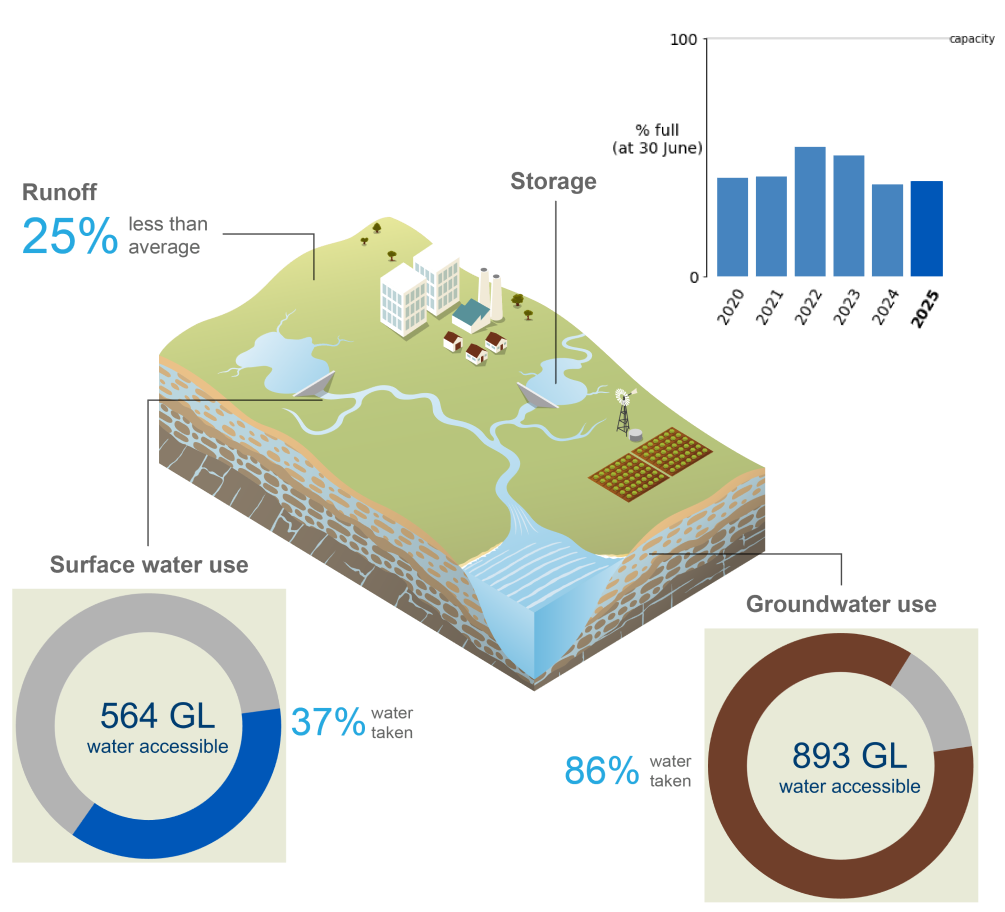
This section provides a detailed breakdown of water assets, liabilities, flows, availability, and use in the Perth region over the past six water accounting periods, outlining where water is stored and how it is used across the region.
For further information, scroll down this page or click on the links below:
Water assets
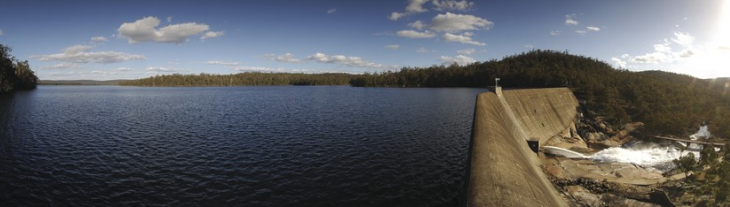
- Total water assets in the Perth region on 30 June 2025 were 366.9 GL, slightly higher than the previous year, primarily due to increases in surface water and groundwater assets.
- Approximately 94% of the region’s water assets were held in surface water storages, while claims against surface water under the Irrigation Scheme Supply accounted for 6% of total water assets.
- A detailed breakdown of water assets in the Perth region is available in the Statement of Water Assets and Water Liabilities.
Surface water assets
- On 30 June 2025, surface water assets in the Perth region were 344 GL, accounting for approximately 95% of the region’s total water assets.
- More than 99% of the surface water assets were held in surface water storages, with the remaining volume forming part of the region’s river systems.
| Surface water | 2025 | 2024 | 2023 | 2022 | 2021 | 2020 |
| Canning | 46,006 | 49,432 | 50,209 | 51,579 | 48,332 | 54,325 |
| Churchman Brook | 702 | 660 | 739 | 714 | 1,197 | 687 |
| Drakes Brook | 1,421 | 1,614 | 1,782 | 2,012 | 1,892 | 1,870 |
| Harvey | 26,549 | 22,242 | 32,331 | 32,331 | 15,362 | 12,087 |
| Logue Brook | 11,624 | 10,949 | 13,400 | 14,561 | 12,349 | 13,064 |
| North Dandalup | 45,716 | 37,953 | 40,096 | 42,405 | 35,380 | 35,765 |
| Samon Brook | 3,929 | 2,535 | 4,052 | 3,937 | 3,635 | 2,938 |
| Serpentine | 38,531 | 43,972 | 66,463 | 72,841 | 64,334 | 63,172 |
| Serpentine Pipehead | 1,395 | 1,388 | 1,453 | 1,525 | 1,533 | 1,687 |
| South Dandalup | 6,848 | 10,492 | 18,958 | 15,155 | 6,991 | 9,822 |
| Stirling | 27,742 | 23,354 | 26,883 | 36,588 | 22,203 | 20,142 |
| Victoria | 7,265 | 4,162 | 3,935 | 4,830 | 5,500 | 4,263 |
| Waroona | 3,598 | 4,272 | 7,464 | 7,577 | 6,995 | 7,875 |
| Wellington | 64,734 | 61,385 | 102,466 | 121,420 | 70,636 | 66,536 |
| Wungong | 34,068 | 35,824 | 44,673 | 39,188 | 42,767 | 38,246 |
| Accessible total | 320,128 | 310,234 | 414,904 | 446,663 | 339,106 | 332,479 |
| Dead storage | 23,098 | 23,098 | 23,098 | 23,098 | 23,098 | 23,098 |
| Total storage | 343,226 | 333,332 | 438,002 | 469,761 | 362,204 | 355,577 |
| Total capacity | 860,840 | 860,840 | 860,840 | 860,840 | 860,840 | 860,840 |
| % full | 39.9% | 38.7% | 50.9% | 54.6% | 42.1% | 41.3% |
- The total storage volume in the Perth region increased by 3% during 2024–25, finishing at 39.9% full on 30 June 2025.
- Five storages—Wellington, Canning, North Dandalup, Serpentine, and Wungong—held approximately 70% of the Perth region’s total accessible surface water storage volume at the end of the reporting year.
- Mundaring Reservoir, located on the Helena River in the northern part of the region, supplies water to the Goldfields and Agricultural districts outside the Perth region. As a result, it is not considered a surface water asset in the account.
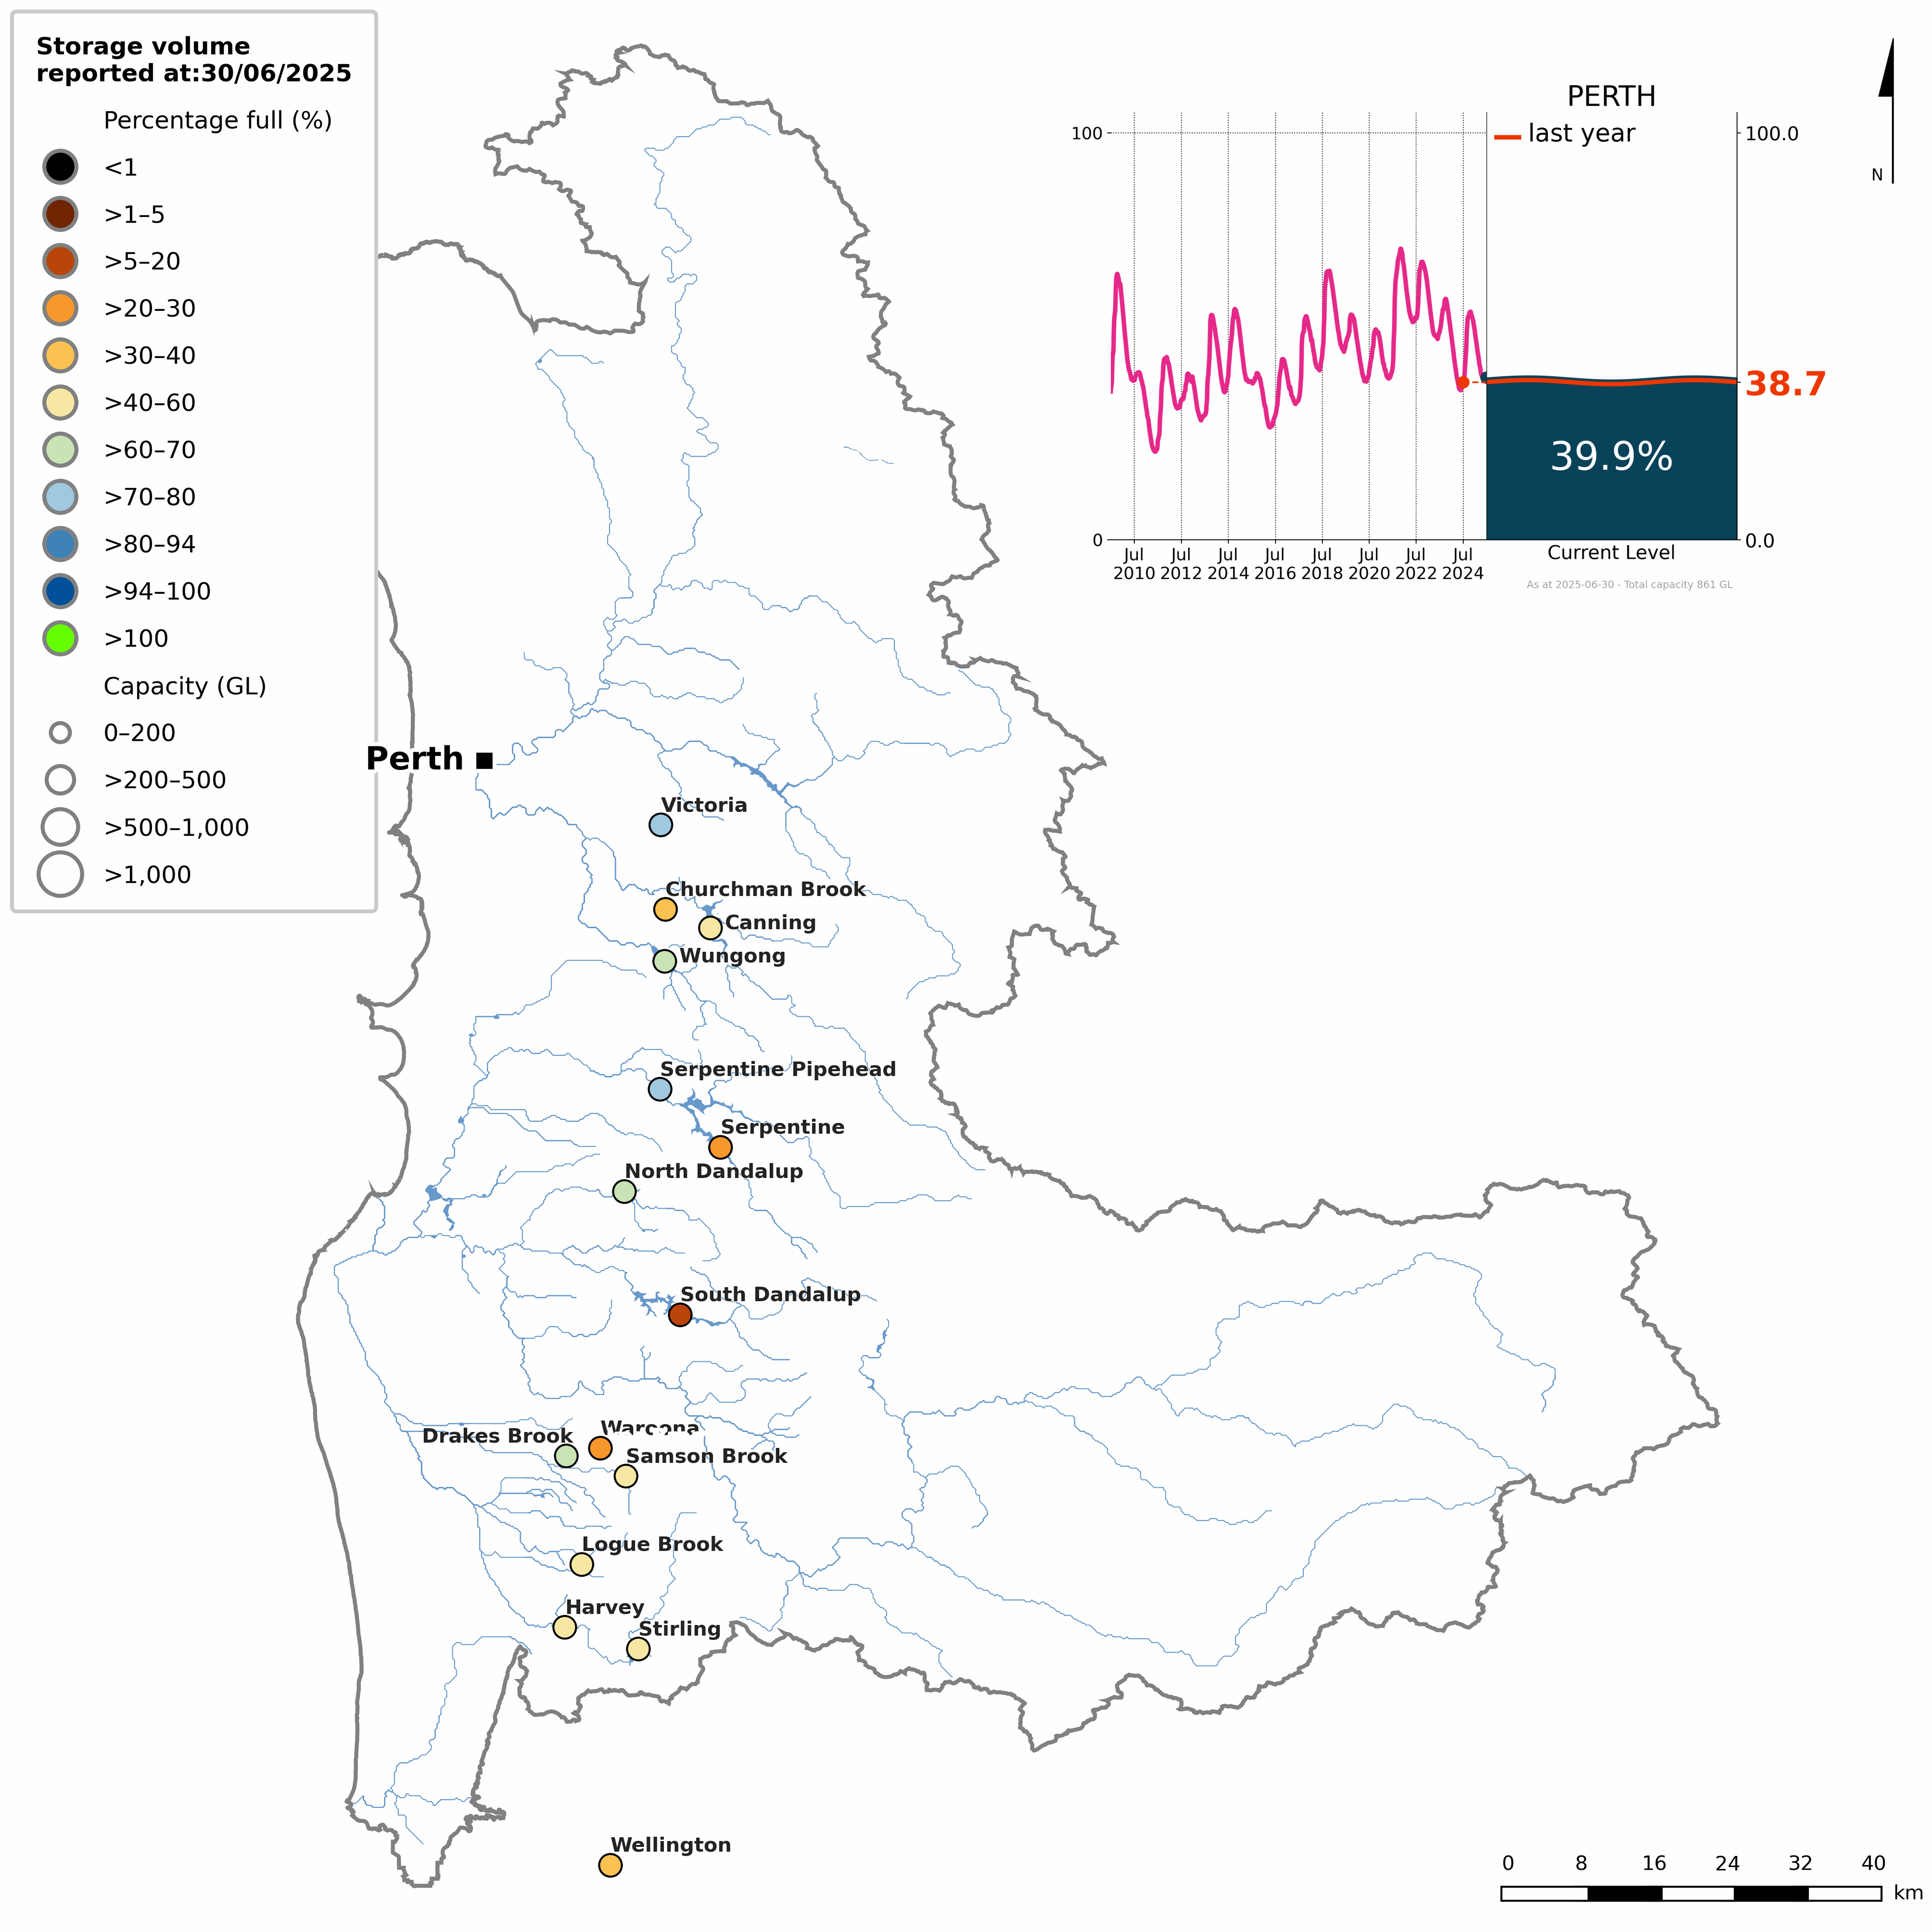
Figure S1 Percentage-full volume on 30 June 2025 for each storage and total storage volume since July 2009 (inset)
- The total storage volume in the Perth region began the 2024–25 year at 38.7% full.
- Following average to above-average rainfall in July and August, storage levels rose above 50% by the end of August.
- Storages remained above 50% through spring and early summer, peaking at 56% full in late October.
- In response to the region's fourth-driest September-to-May period on record, storage volumes gradually declined after peaking in spring, falling below 50% during the first half of January.
- With below-average rainfall continuing through autumn, storage levels declined further to around 40% by the start of winter.
- By 30 June 2025, following increased rainfall during June, the total storage volume finished at 39.9% full, a 3.0% increase from the start of the reporting year.
- More detailed information on individual storages in the Perth region is available on the Bureau of Meteorology's Water Information Dashboard.
Groundwater assets
| Groundwater | 2025 | 2024 | 2023 | 2022 | 2021 | 2020 |
| Change in aquifer volume | - | (305,806) | 241,702 | 196,871 | (70,695) | (191,841) |
- The volume of water stored in the Perth region’s aquifers cannot be quantified due to a lack of available data. Historical estimates of annual changes in aquifer volume were previously reported.
- Annual changes in aquifer volume are not reported for 2024–25 due to the unavailability of the modelled data previously used to derive this information.
Water liabilities
- Water liabilities in the Perth region refer to the volume of allocation remaining on licence entitlements at the end of the reporting period (30 June).
- As many water supply licences in the Perth region do not align with the water year ending 30 June, the remaining allocation represents the unused portion of the annual entitlement.
- A more detailed description of water allocations in the Perth region is provided in the Water use section.
Surface water liabilities
| Description | 2025 | 2024 | 2023 | 2022 | 2021 | 2020 | |
| Opening balance at 01 July | 10,009 | 10,009 | 10,009 | 8,522 | 8,522 | 8,522 | |
| add | Allocations | 118,542 | 50,396 | 44,325 | 45,580 | 45,173 | 43,998 |
| less | Allocated diversions | 118,512 | 50,396 | 44,325 | 44,093 | 45,173 | 43,998 |
| less | Adjustments and forfeitures | 0 | 0 | 0 | 0 | 0 | 0 |
| Closing balance at 30 June | 10,039 | 10,009 | 10,009 | 10,009 | 8,522 | 8,522 | |
| Description | 2025 | 2024 | 2023 | 2022 | 2021 | 2020 | |
| Opening balance at 01 July | 0 | 0 | 0 | 0 | 0 | 0 | |
| add | Entitlements | 299,750 | 272,850 | 247,459 | 247,459 | 247,459 | 247,459 |
| less | Diversions to the urban system | 113,911 | 136,511 | 120,264 | 121,326 | 98,358 | 101,929 |
| less | Adjustments and forfeitures | 185,839 | 136,339 | 127,195 | 126,133 | 149,101 | 145,530 |
| Closing balance at 30 June | 0 | 0 | 0 | 0 | 0 | 0 | |
| Description | 2025 | 2024 | 2023 | 2022 | 2021 | 2020 | |
| Opening balance at 01 July | 25,007 | 28,373 | 29,864 | 31,798 | 31,831 | 40,634 | |
| add | Allocations | 67,854 | 99,500 | 99,500 | 98,468 | 79,366 | 102,164 |
| less | Allocated diversions | 46,520 | 67,866 | 65,991 | 66,112 | 49,701 | 73,827 |
| less | Adjustments and forfeitures | 23,070 | 35,000 | 35,000 | 34,290 | 29,698 | 37,140 |
| Closing balance at 30 June | 23,271 | 25,007 | 28,373 | 29,864 | 31,798 | 31,831 | |
- Surface water liabilities in the Perth region during 2024–25 comprised allocations for individual users and to the irrigation scheme, in addition to entitlements to the urban system.
- For individual users, surface water allocations increased to 119 GL, more than double the previous year, with almost all of this volume diverted during the reporting period.
- The urban system held 300 GL of surface water entitlements, of which 114 GL was diverted for urban supply.
- Surface water allocations to the irrigation scheme were 68 GL, around 30% lower than the previous year, with 47 GL diverted during the reporting period.
Groundwater liabilities
| Description | 2025 | 2024 | 2023 | 2022 | 2021 | 2020 | |
| Opening balance at 01 July | 97,313 | 104,182 | 102,352 | 102,376 | 102,377 | 102,377 | |
| add | Allocations | 522,693 | 325,131 | 304,530 | 303,993 | 300,494 | 301,028 |
| less | Allocation extractions | 527,493 | 332,000 | 302,700 | 304,017 | 300,495 | 301,028 |
| less | Adjustments and forfeitures | 0 | 0 | 0 | 0 | 0 | 0 |
| Closing balance at 30 June | 92,513 | 97,313 | 104,182 | 102,352 | 102,376 | 102,377 | |
| Description | 2025 | 2024 | 2023 | 2022 | 2021 | 2020 | |
| Opening balance at 01 July | 0 | 0 | 0 | 0 | 0 | 0 | |
| add | Entitlements | 178,824 | 182,866 | 165,000 | 165,000 | 164,588 | 164,388 |
| less | Extractions to the urban system | 148,739 | 149,929 | 136,790 | 130,256 | 137,064 | 135,516 |
| less | Adjustments and forfeitures | 30,085 | 32,937 | 28,210 | 34,744 | 27,524 | 28,872 |
| Closing balance at 30 June | 0 | 0 | 0 | 0 | 0 | 0 | |
- Groundwater liabilities in the Perth region during 2024–25 comprised allocations for individual users, in addition to entitlements to the urban system.
- For individual users, groundwater allocations increased to 523 GL in 2024–25, approximately 60% higher than the previous year, with 528 GL extracted during the reporting period.
- The urban system held 179 GL of groundwater entitlements, of which 149 GL was extracted for urban supply.
Water flows
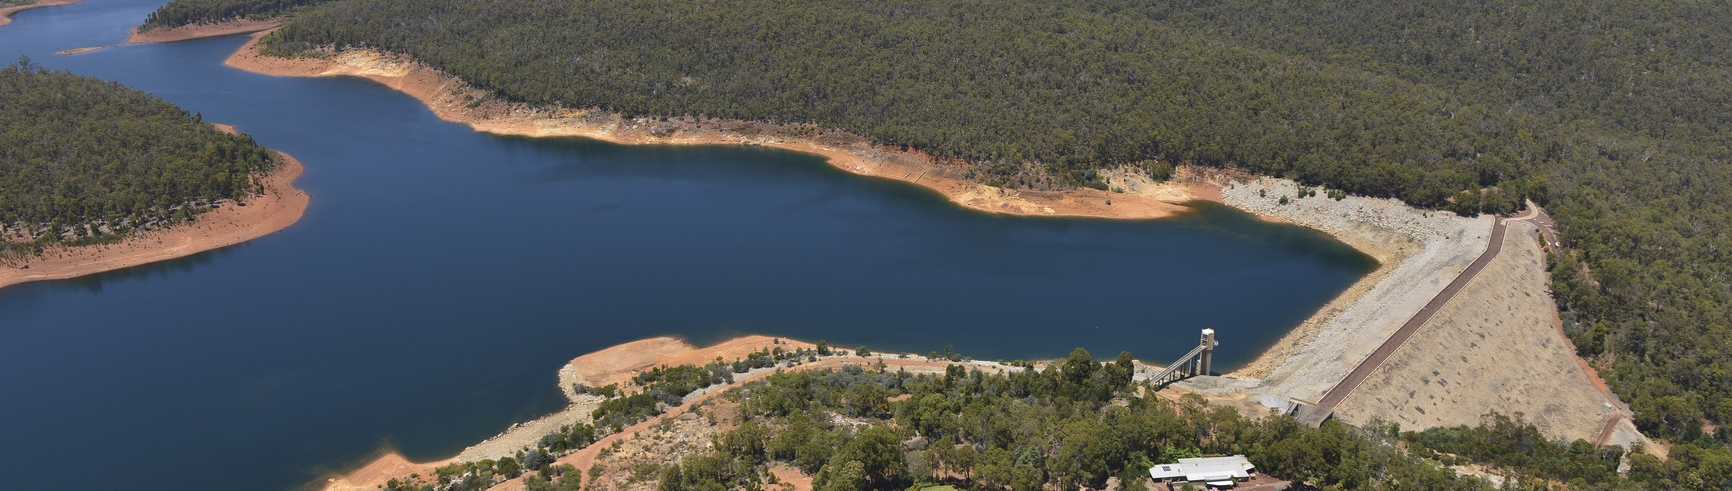
- Water flows in the Perth region describe the movement of water between surface water, groundwater, and the urban system.
- A summary of total inflows and outflows for each water store is provided below.
- For a detailed breakdown of inflows and outflows in the Perth region, refer to the Statement of Changes in Water Assets and Water Liabilities.
| Water inflows | 2025 | 2024 | 2023 | 2022 | 2021 | 2020 |
| Surface water inflows | 1,156,845 | 1,117,270 | 1,931,683 | 2,600,918 | 1,182,586 | 1,143,930 |
| Groundwater inflows | 48,444 * | 1,211,053 | 1,659,961 | 1,602,735 | 1,085,086 | 1,425,489 |
| Urban system inflows | 556,224 | 556,194 | 498,654 | 512,911 | 519,733 | 515,221 |
| Irrigation scheme inflows | 46,520 | 67,866 | 65,991 | 66,112 | 49,701 | 73,827 |
| Total water inflows | 1,808,033 | 2,952,383 | 4,156,289 | 4,782,676 | 2,837,106 | 3,158,467 |
* Modelled inflow components are no longer available from 2024–25
- Total water inflows to the Perth region during 2024–25 were 1,808 GL, approximately 40% lower than the previous year, and approximately half of the average of 3,574 GL.
- Surface water inflows represented approximately 65% of total inflows, primarily driven by runoff, which made up 933 GL of surface water inflows.
- Urban system inflows accounted for approximately 556 GL of total inflows, supported by a combination of wastewater collected, groundwater extraction, desalinated water, and surface water diversions.
- The remaining inflows were associated with the irrigation scheme 47 GL, entirely from allocated diversions from surface water.
| Water outflows | 2025 | 2024 | 2023 | 2022 | 2021 | 2020 |
| Surface water outflows | 1,393,250 | 1,015,722 | 1,796,052 | 2,382,438 | 898,237 | 929,872 |
| Groundwater outflows | 770,232 | 1,622,592 | 1,527,119 | 1,489,138 | 1,228,511 | 1,658,121 |
| Urban system outflows | 561,671 | 566,979 | 498,797 | 517,270 | 524,368 | 517,305 |
| Irrigation scheme outflows | 46,518 | 77,484 | 66,300 | 66,142 | 48,717 | 75,756 |
| Total water outflows | 2,771,671 | 3,282,777 | 3,888,268 | 4,454,988 | 2,699,833 | 3,181,054 |
* Modelled outflow components are no longer available from 2024–25
- Total water outflows from the Perth region during 2024–25 were 2,772 GL, approximately 15% lower than the previous year, and approximately 20% below the average of 3,388 GL.
- Surface water made up around 50% of total outflows, with river outflows contributing about 70% of surface water outflows.
- Urban system outflows contributed around 20% of total outflows, with the supply of drinking water to urban customers accounting for almost half of this volume.
- Outflows associated with the irrigation scheme totalled 47 GL, representing under 2% of total outflows, entirely from water supplied to irrigation users.
Water availability
| Surface water | 2025 | 2024 | 2023 | 2022 | 2021 | 2020 |
| Water availability | 1,392,172 | 1,185,810 | 2,017,663 | 2,587,522 | 1,236,124 | 1,126,165 |
| Water accessible | 563,946 | 512,171 | 495,621 | 489,034 | 429,508 | 460,195 |
| Water taken | 207,816 | 169,305 | 174,780 | 167,412 | 112,031 | 135,243 |
| % water accessible taken | 37% | 33% | 35% | 34% | 26% | 29% |
- Surface water availability in the Perth region during 2024–25 was a little over 15% higher than the previous year, but approximately 30% below the long-term average of 1,929 GL.
- Changes in water availability across the Perth region are strongly influenced by runoff. Typically, when runoff increases or decreases, water availability response in a similar way.
- Runoff during 2024–25 was approximately 40% higher than the previous year, but remained 25% below the long-term average of 1,246 GL, contributing to the change in water availability.
- Surface water accessible for take increased by 10% compared to the previous year.
- The volume of water taken from surface water resources was approximately 25% higher than the previous year.
- Overall, approximately 35% of the surface water accessible for take in the Perth region was taken during 2024–25, with more than three quarters of this volume taken by individual users for various purposes.
Water use
Consumptive use
- A total of 1,045 GL of water was taken from surface water and groundwater resources for consumptive use in the Perth region during 2024–25, approximately 25% higher than the previous year, largely driven by increased extractions by individual users from both surface water and groundwater resources.
| Surface water | 2025 | 2024 | 2023 | 2022 | 2021 | 2020 |
| Individual users | 118,512 | 50,396 | 44,325 | 44,093 | 45,173 | 43,998 |
| Irrigation scheme | 113,911 | 136,511 | 120,264 | 121,326 | 98,538 | 101,929 |
| Urban system | 42,784 | 51,043 | 64,464 | 57,207 | 17,157 | 17,418 |
| Total | 275,207 | 237,950 | 229,053 | 222,626 | 160,688 | 163,345 |
- Surface water taken for consumptive use across the Perth region in 2024–25 was 275 GL, approximately 15% higher than the previous year, reflecting increased diversion by individual users.
- Approximately 45% of surface water diversions were taken by individual users, including both allocated and non-allocated diversions, while the irrigation scheme accounted for a further 40%, mainly supplied from storages in the Harvey and Collie river catchments.
- The remaining surface water taken in the Perth region was supplied to the urban system, including sub-surface inflows and desalinated water ‘banked’ in surface water storages.
| Groundwater | 2025 | 2024 | 2023 | 2022 | 2021 | 2020 |
| Individual users | 621,493 | 440,507 | 388,842 | 388,797 | 384,985 | 385,059 |
| Urban system | 148,739 | 149,929 | 136,790 | 130,256 | 137,064 | 135,516 |
| Total | 770,232 | 590,436 | 525,632 | 519,053 | 522,049 | 520,575 |
- Groundwater taken for consumptive use across the Perth region during 2024–25 was 770 GL, 30% higher than the previous year, primarily due to increased extraction by individual users.
- Approximately 80% of groundwater extractions were made by individual users, including both allocated and non-allocated extractions, with the remaining volume extracted by the urban system.
Allocations and diversions
| Surface water | 2025 | 2024 | 2023 | 2022 | 2021 | 2020 |
| Individual users | ||||||
| Carryover | 10,009 | 10,009 | 10,009 | 8,522 | 8,522 | 8,522 |
| Allocated announcements | 118,542 | 50,396 | 44,325 | 45,580 | 45,173 | 43,998 |
| Allocated diversions | 118,512 | 50,396 | 44,325 | 44,093 | 45,173 | 43,998 |
| % used | 92% | 83% | 82% | 81% | 84% | 84% |
| Irrigation scheme | ||||||
| Carryover | 25,007 | 28,373 | 29,864 | 31,798 | 31,831 | 40,634 |
| Allocated announcements | 67,854 | 99,500 | 99,500 | 98,468 | 79,366 | 102,164 |
| Allocated diversions | 46,520 | 67,866 | 65,991 | 66,112 | 49,701 | 73,827 |
| % used | 50% | 53% | 51% | 51% | 45% | 52% |
| Urban users | ||||||
| Carryover | 0 | 0 | 0 | 0 | 0 | 0 |
| Allocated entitlements | 299,750 | 272,850 | 247,459 | 247,459 | 247,459 | 247,459 |
| Allocated diversions | 113,911 | 136,511 | 120,264 | 121,326 | 98,358 | 101,929 |
| % used | 38% | 50% | 49% | 49% | 40% | 41% |
| Total | ||||||
| Carryover | 35,016 | 38,382 | 39,873 | 40,320 | 40,353 | 49,156 |
| Allocations | 486,146 | 422,746 | 391,284 | 391,507 | 371,998 | 393,621 |
| Allocated diversions | 278,943 | 254,773 | 230,580 | 231,531 | 193,232 | 219,754 |
| % used | 54% | 55% | 53% | 54% | 47% | 50% |
- Total surface water allocations in the Perth region during 2024–25 were 486 GL, of which 279 GL of the total available volume was diverted during the reporting year.
- Surface water allocations for individual users totalled 119 GL, representing around 25% of total allocations, with 90% of the available volume diverted.
- The irrigation scheme accounted for 68 GL of surface water entitlements in 2024–25, approximately 15% of all allocations, with 50% of the available volume diverted during the reporting year.
- Urban users held 300 GL of surface water entitlements, accounting for around 60% of total allocations, with a little under 40% of the available volume diverted for urban water supply.
- A portion of these surface water diversions include sub-surface water flows and desalinated water transferred to the Perth region’s surface water storages (see Urban system supply section).
| Groundwater | 2025 | 2024 | 2023 | 2022 | 2021 | 2020 |
| Individual users | ||||||
| Carryover | 97,313 | 104,182 | 102,352 | 102,376 | 102,377 | 102,377 |
| Allocated announcements | 522,693 | 325,131 | 304,530 | 303,993 | 300,494 | 301,028 |
| Allocated extractions | 516,554 | 332,000 | 302,700 | 304,017 | 300,495 | 301,028 |
| % used | 83% | 77% | 74% | 75% | 75% | 75% |
| Urban users | ||||||
| Carryover | - | - | - | - | - | - |
| Allocated entitlements | 178,824 | 182,866 | 165,000 | 165,000 | 164,588 | 164,388 |
| Allocated extractions | 148,739 | 149,929 | 136,790 | 130,256 | 137,064 | 135,516 |
| % used | 83% | 82% | 83% | 79% | 83% | 82% |
| Total | ||||||
| Carryover | 97,313 | 104,182 | 102,352 | 102,376 | 102,377 | 102,377 |
| Allocations | 701,517 | 507,977 | 469,530 | 468,933 | 465,082 | 465,416 |
| Allocated extractions | 665,239 | 481,923 | 439,490 | 434,273 | 437,559 | 436,544 |
| % used | 83% | 79% | 77% | 76% | 77% | 77% |
- Total groundwater allocations in the Perth region during 2024–25 were 702 GL, of which 84% (665 GL) of the total available volume was extracted during the reporting year.
- Groundwater allocations for individual users totalled 523 GL, representing around 75% of total allocations, with 85% of the available volume extracted.
- Urban users held 179 GL of groundwater entitlements in 2024–25, accounting for around 25% of total allocations, with 85% of the available volume extracted for urban water supply.
- Overall, groundwater extractions in the Perth region increased substantially compared to the previous year, largely reflecting higher use by individual users.
Urban supply system
| Water sources | 2025 | 2024 | 2023 | 2022 | 2021 | 2020 |
| Surface water | 42,784 | 51,043 | 64,464 | 57,207 | 17,157 | 17,418 |
| Groundwater | 148,739 | 149,929 | 136,790 | 130,256 | 137,064 | 135,516 |
| Desalinated water | 141,233 | 119,547 | 94,474 | 116,198 | 143,641 | 140,047 |
| Inter-region delivery | 2,119 | 2,261 | 1,980 | 1,996 | 2,006 | 1,938 |
| Total urban water supplied | 334,875 | 322,780 | 297,708 | 305,657 | 299,868 | 294,919 |
- A total of 334.9 GL of water was sourced for the urban supply system in the Perth region during 2024–25, 4% higher than the previous year, and 15% above the average of 292 GL.
- Approximately 45% of the total urban water supply in the Perth region came from groundwater, while approximately 15% was sourced from surface water storages.
- Desalinated water contributed around 40% of the urban water supply, with the remaining volume delivered via inter-region transfer.
- In response to lower surface water diversions to the urban system during the reporting year, Perth Water Corporation increased the use of desalinated water to help meet demand across the region.
- During periods of lower demand, the supply strategy includes the ‘banking’ of groundwater and desalinated water in Perth’s surface water storages to help buffer peak supply requirements.
- For more information on the use of desalinated water in the Perth region, visit Perth Water Corporation's Desalinated website.
| Supply of drinking water | 2025 | 2024 | 2023 | 2022 | 2021 | 2020 |
| Residential customers | 206,349 | 206,992 | 185,027 | 184,673 | 182,236 | 180,494 |
| Commercial & industrial customers | 30,682 | 29,563 | 26,605 | 26,397 | 25,862 | 25,709 |
| Agricultural & irrigation customers | 73 | 79 | 80 | 130 | 121 | 93 |
| Other customers | 20,572 | 20,364 | 17,661 | 18,113 | 17,252 | 19,089 |
| Total drinking water used | 257,676 | 256,998 | 229,373 | 229,313 | 225,471 | 225,385 |
- A total of 258 GL of drinking water (excluding recycled water) was supplied to urban customers in the Perth region during 2024–25, consistent with the previous year, and 10% above the average of 232 GL.
- Residential customers accounted for the majority of drinking water use, receiving 206 GL, or around 80% of total urban demand.
- Commercial and industrial customers used 31 GL (approximately 12% of total consumption), while agriculture and irrigation customers used less than 0.1 GL.
- Drinking water supplied to other customers, including small commercial operations and community services, totalled 21 GL, representing around 8% of total urban use.
- Overall, drinking water use in the Perth region during 2024–25 remained similar to the previous year, reflecting relatively stable demand across the region.
- An additional 42 GL of drinking water was supplied to other regions during 2024–25; however, this volume is not included in the table above.
Water restrictions
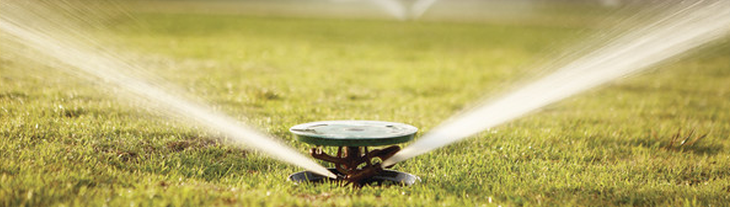
- A permanent daytime sprinkler ban and 2-day a week sprinkler roster have been in place for urban water users since 2001, in addition to a 3-day a week sprinkler roster for domestic garden bores since 2007.
- In 2010, a permanent winter sprinkler ban was introduced to assist in the 'banking' of water resources across the region.
- For more information on water restrictions across the Perth region, refer to the Bureau of Meteorology's Water restrictions website.