


Sydney: Climate and water
For the water account period 1 July 2024 to 30 June 2025
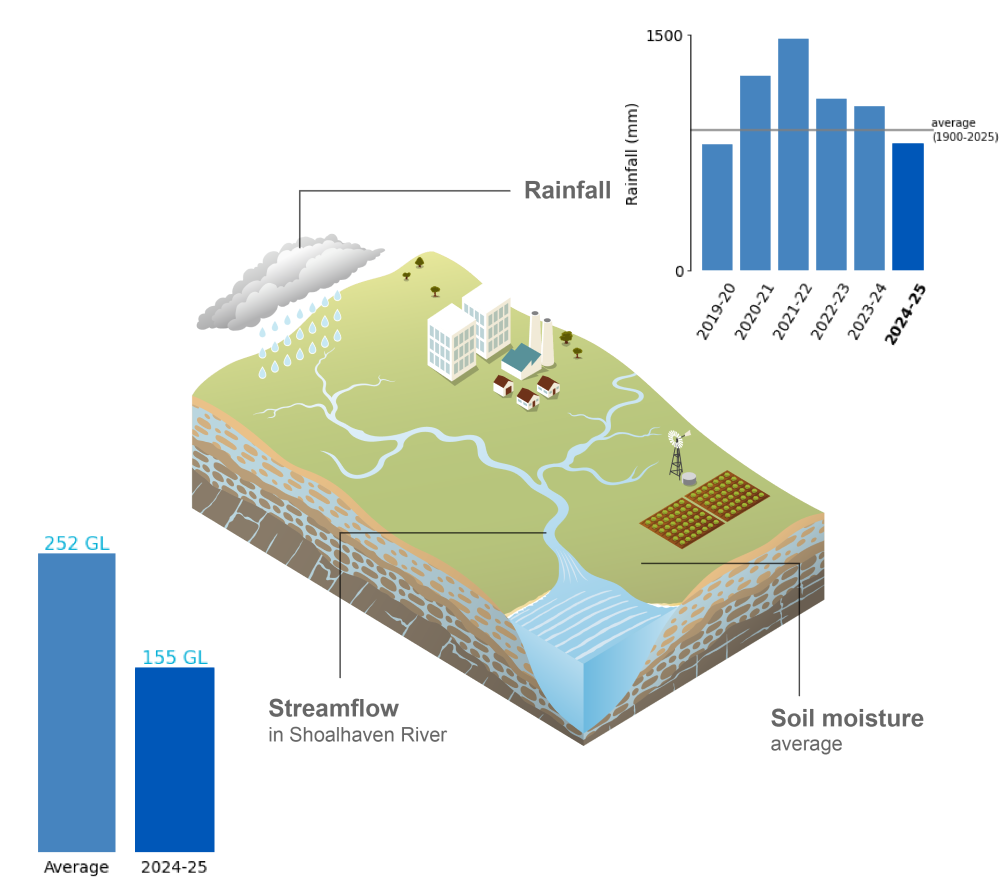
- Rainfall in the Sydney region during 2024–25 was below average for the first time since 2019–20.
- Soil moisture in the root zone (0–1 m depth) remained close to average across most of the region, with fluctuations driven by periods of dry conditions and rainfall events.
- Streamflows across the region were below average, with the Shoalhaven River at Warri recording approximately 60% of the long-term average.
For further information on the climate and water conditions across the Sydney region during the current reporting period, scroll down this page or click on the links below:
About the region
- The Sydney region experiences a temperate climate, characterised by mild to cold winters and warm to hot summers.
- Rainfall is generally distributed throughout the year, though higher monthly totals are more common between December and March.
- Streamflows in the region’s rivers are typically perennial, reflecting the relatively consistent year-round rainfall.
Climate conditions
Rainfall
Figure C1 Annual and monthly rainfall deciles for the Sydney region during the 2024–25 reporting period
- Total area-averaged rainfall in the Sydney region during 2024–25 was 812 mm, approximately 10% below the long-term average of 896 mm. This was the first year since 2019–20 with below-average rainfall across the region.
- Rainfall from July to October was well below the long-term average for this period, largely due to a predominantly negative phase of the Southern Annular Mode, which suppressed onshore flow across coastal areas east of the Great Dividing Range.
- Two separate rain-bearing systems in late November brought high rainfall to parts of the region, resulting in average to above-average monthly rainfall for the month.
- Although no major climate drivers were active during summer, with the region experiencing near-average summer rainfall.
- A coastal trough and upper low in the final week of May, combined with very moist onshore flow, delivered persistent heavy rainfall. Rainfall during May more than double the long-term monthly average, contributing to above-average autumn rainfall.
- June was exceptionally dry, with the region experiencing below to very much below average decile rainfall.
- Further information on Australia’s climate and water conditions during the 2024–25 reporting period can be found in the Financial Year Climate and Water Statement 2024–25.
Figure C2 Total monthly rainfall for the Sydney region during the 2024–25 reporting period, compared with the average and percentiles for the region
- Rainfall was above average during November, January, April, and May, with January recording the highest monthly total of the year.
- No month recorded rainfall above the 90th percentile.
- Rainfall from July to October and in December was substantially below average, consistent with the dry conditions observed across the region during the first half of the reporting period.
- June was the only month with rainfall below the 10th percentile, marking an exceptionally dry end to the reporting year.
Actual evapotranspiration
Figure C3 Annual and monthly actual evapotranspiration deciles for the Sydney region during the 2024–25 reporting period
- Total area-averaged actual evapotranspiration was close to average across most of the Sydney region during 2024–25.
- From July to October, evapotranspiration was generally below average, with the lack of rain-bearing systems reducing water availability across the region. August was an exception, with above-average evapotranspiration recorded across the upper Hawkesbury–Nepean and Shoalhaven catchments.
- Evapotranspiration conditions increased in December following above-average rainfall in November, with evapotranspiration during December above average. The exception being the northern area of the region experiecing below average evapotranspiration.
- During summer and early autumn, evapotranspiration remained average to slightly above average, supported by near-average rainfall and sustained soil moisture. Areas of below-average evapotranspiration persisted north of Sydney where rainfall was less consistent, particularly during February.
- Evapotranspiration increased to above-average levels in May, particularly in the upper Shoalhaven catchment and areas surrounding Katoomba and in the southern parts of the region.
- By June, evapotranspiration had returned to predominantly average levels.
Soil moisture
Figure C4 Annual and monthly soil moisture deciles for the Sydney region during the 2024–25 reporting period
- Total area-averaged soil moisture in the root zone (0–1 m depth) was close to average across most of the Sydney region during 2024–25, with near-average rainfall sustaining soil moisture throughout much of the reporting period.
- Following rainfall above average rainfall between April and June 2024, soil moisture was above average across much of the region in July.
- Dry conditions from July to October led to a decrease in soil moisture, with below-average levels widespread by November, particularly across the Shoalhaven and upper Hawkesbury–Nepean catchments, reflecting the prolonged absence of rain-bearing systems.
- Widespread rainfall in late November increased soil water stores, and by December soil moisture had returned to predominantly average across much of the region.
- Average to above-average soil moisture persisted through summer, with higher levels more prominent in the upper Shoalhaven and Hawkesbury–Nepean catchments, supported by near-average rainfall and moderated evapotranspiration.
- Although rainfall was close to average in March and April, soil moisture decreased, becoming average to below average across large parts of the region.
- Rainfall events in May contributed to the increased soil moisture during May and June across most of the region, returning to average to above-average conditions.
- Further information on soil moisture conditions across the Sydney region during the 2024–25 reporting period is available on the Australian Water Outlook.
Streamflow responses
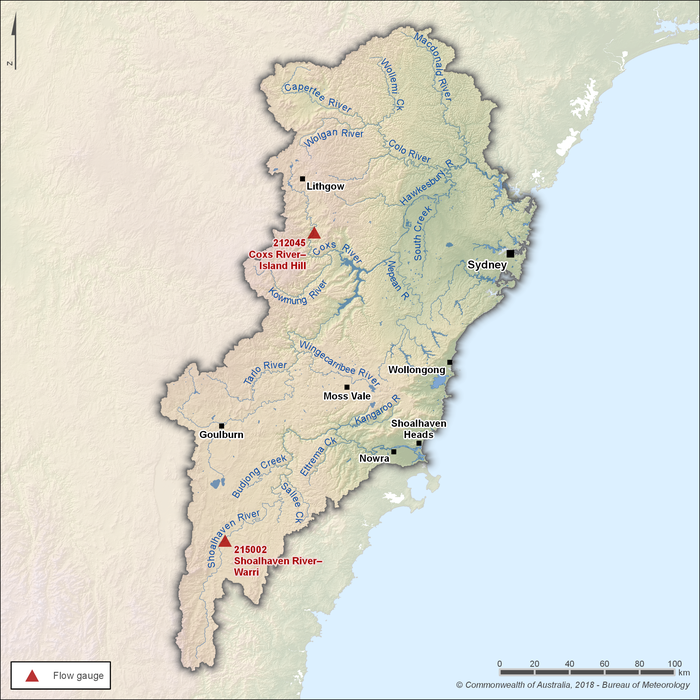
Figure C5 Key flow gauging stations along the main rivers within the Sydney region
- There are three main river systems within the Sydney region: the Hawkesbury–Nepean River, the Shoalhaven River, and the Illawarra and metropolitan Sydney catchments.
- Of these, the Hawkesbury–Nepean and Shoalhaven river systems are the two primary sources of streamflow in the region.
- Two gauging stations (shown in Figure C5) are used to represent seasonal flow patterns in these rivers. Streamflows upstream of these sites are unregulated and not influenced by diversions for consumptive use.
- The Coxs River flows into Lake Burragorang, which is dammed to form Warragamba Reservoir—the region’s largest surface water storage.
Figure C6 Total monthly flow for major rivers in the Sydney region during the 2024–25 reporting period, compared with the average and percentiles for each gauging station
- Streamflows in the Sydney region during 2024–25 were below average, consistent with below-average rainfall and low catchment runoff observed through much of the reporting year.
- The Shoalhaven River at Warri (Station 215022) recorded annual flows approximately 40% below the long-term average of 252 GL, marking one of the driest totals since 2018–19, while the Coxs River at Island Hill (Station 212045) recorded flows around 25% below its long-term average of 98 GL.
- A lack of significant rainfall from July to October led to sustained low streamflows across both sites.
- Scattered rainfall in late spring produced only limited streamflow responses, indicating reduced catchment wetness following the dry start to the reporting period.
- From August through to April, streamflows remained consistently below average across the region’s catchments, reflecting the prolonged dry conditions that persisted into early autumn.
- Heavy rainfall during the region’s caused an increase in flow volumes, with both sites recording their highest monthly totals for the year, peaking just below the 90th percentile.
- By June, flows decreased to average or below-average levels heading into winter.