


Sydney: Supporting information
For the water account period 1 July 2024 to 30 June 2025
- Total storage volume remained stable throughout the reporting year, finishing at 99.5% full on 30 June 2025, with Warragamba Reservoir—the region's largest reservoir—sitting above 100% capacity.
- Approximately 45% of the water resources accessible for take in the Sydney region were used, primarily through diversions to the urban system.
- Drinking water use in 2024–25 remained within the typical range observed over the past decade.
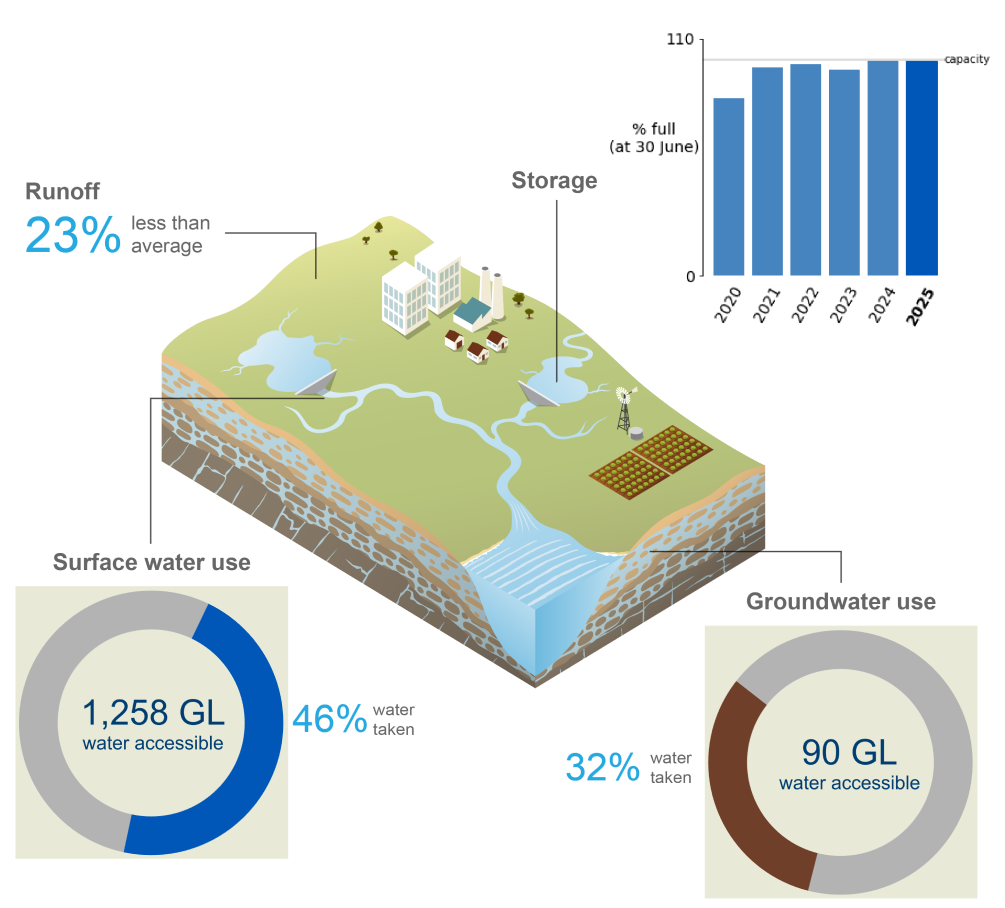
This section provides a detailed breakdown of water assets, liabilities, flows, availability, and use in the Sydney region over the past six water accounting periods, outlining where water is stored and how it is used across the region.
For further information, scroll down this page or click on the links below:
Water assets
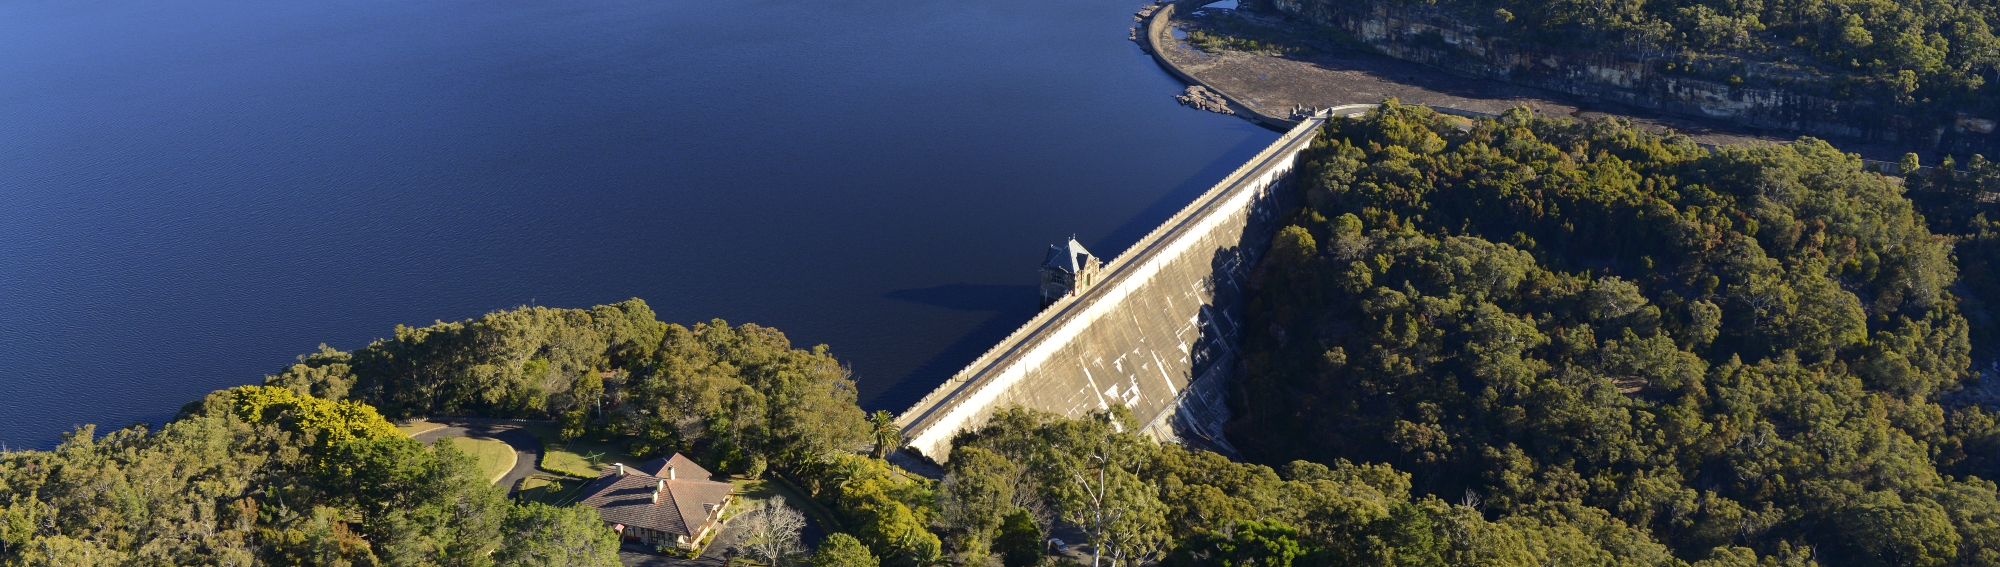
- Total water assets in the Sydney region on 30 June 2025 were 2,759 GL, slightly lower than the previous year, entirely due to decreases in surface water assets.
- More than 99% of the region’s water assets were held in surface water storages, while the remaining volume was contained in rivers.
- There are no groundwater assets in the Sydney region.
- A detailed breakdown of water assets in the Sydney region is available in the Statement of Water Assets and Water Liabilities.
Surface water assets
| Surface water | 2025 | 2024 | 2023 | 2022 | 2021 | 2020 |
| Avon | 143,510 | 146,372 | 122,075 | 144,168 | 140,529 | 124,100 |
| Cataract | 94,785 | 97,055 | 66,107 | 83,657 | 78,668 | 69,463 |
| Cordeaux | 90,284 | 91,564 | 77,935 | 92,049 | 92,603 | 69,184 |
| Fitzroy Falls | 9,914 | 4,826 | 6,980 | 6,667 | 9,815 | 8,256 |
| Greaves Creek | 303 | 298 | 188 | 299 | 259 | 211 |
| Lake Medlow | 330 | 332 | 173 | 103 | 123 | 131 |
| Lower Cascade | 271 | 307 | 250 | 298 | 235 | 189 |
| Middle Cascade | 153 | 168 | 105 | 167 | 167 | 112 |
| Nepean | 66,115 | 67,959 | 53,312 | 65,775 | 63,634 | 44,298 |
| Prospect | 26,721 | 29,760 | 30,475 | 30,649 | 32,337 | 29,295 |
| Tallowa | 84,306 | 84,900 | 82,018 | 84,661 | 85,342 | 87,541 |
| Upper Cascade | 1,625 | 1,723 | 1,754 | 1,328 | 1,642 | 1,738 |
| Warragamba | 2,029,214 | 2,020,596 | 1,992,683 | 2,005,517 | 1,974,580 | 1,666,906 |
| Wingecarribee | 26,078 | 25,519 | 22,615 | 20,119 | 20,934 | 19,728 |
| Woronora | 71,717 | 72,644 | 70,675 | 72,123 | 60,125 | 45,019 |
| Accessible total | 2,645,326 | 2,644,023 | 2,527,345 | 2,607,580 | 2,560,993 | 2,166,171 |
| Dead storage | 108,430 | 108,430 | 108,430 | 108,430 | 108,430 | 108,430 |
| Total storage | 2,753,756 | 2,752,453 | 2,635,775 | 2,716,010 | 2,669,423 | 2,274,601 |
| Total capacity | 2,766,470 | 2,766,470 | 2,766,470 | 2,766,470 | 2,766,470 | 2,766,470 |
| % full | 99.5% | 99.5% | 95.3% | 98.2% | 96.5% | 82.2% |
- The total storage volume in the Sydney region remained stable during 2024–25, finishing at 99.5% full on 30 June 2025.
- This marks the fifth consecutive year in which storages have remained above 95% full.
- Lake Burragorang (formed by Warragamba Reservoir) holds approximately 75% of the region’s total surface water storage capacity.
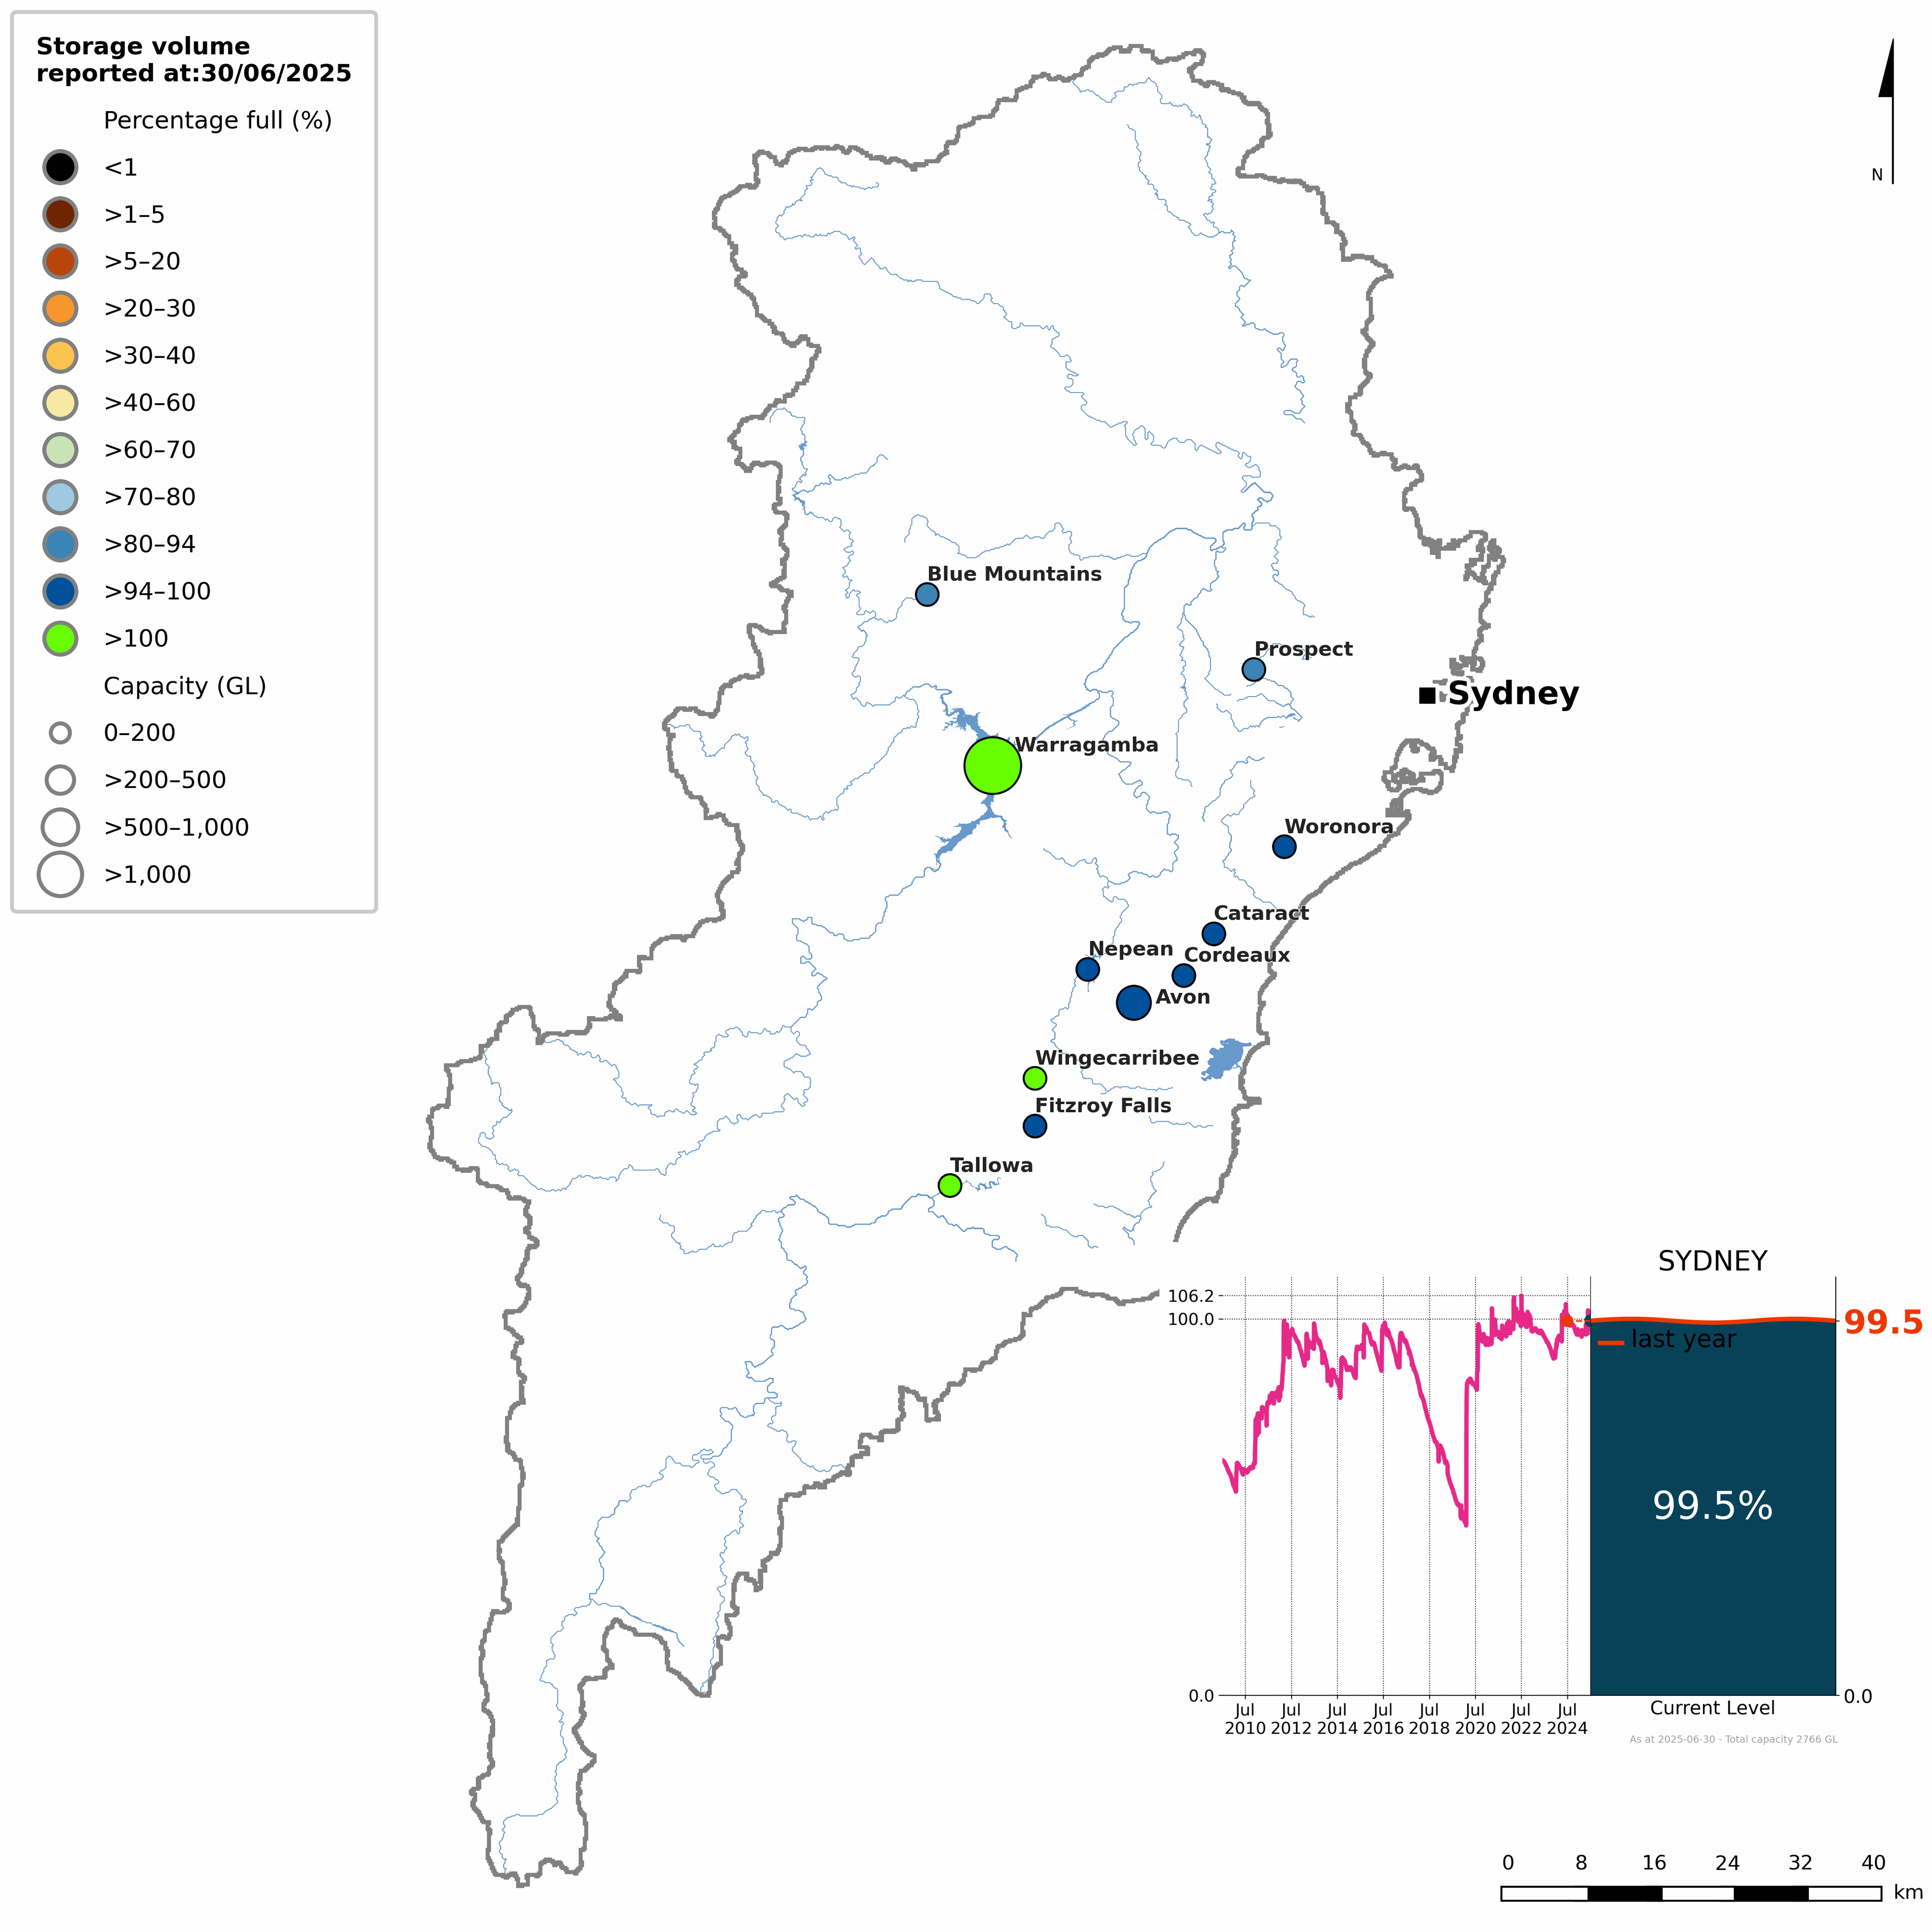
Figure S1 Percentage-full volume on 30 June 2025 for each storage and total storage volume since July 2009 (inset)
- The total storage volume in the Sydney region began the 2024–25 year at 99.5% full.
- During the first half of July, storages briefly rose above 100%. However, below-average spring rainfall led to a gradual decline, with volumes falling to around 95% by the end of November.
- Storages remained relatively stable through summer and autumn, generally hovering between 95% and 98% full.
- In the final week of May, weekly rainfall totals exceeding 150 mm fell across the region, causing storage volumes to rise sharply from 96% to 102% within a few days.
- After this late-May rainfall event, storages remained close to or above 100% through to the end of the 2024–25 reporting year.
- By 30 June 2025, the total storage volume in the Sydney region was 99.5% full, with Warragamba Reservoir—the region’s largest storage—sitting above 100% capacity.
- More detailed information on individual storages in the Sydney region is available on the Bureau of Meteorology's Water Information Dashboard.
Water liabilities
- Water liabilities in the Sydney region refer to the volume of allocation remaining on licence entitlements at the end of the reporting year (30 June).
- A more detailed description of water allocations and entitlements in the Sydney region is provided in the Water use section.
Surface water liabilities
| Description | 2025 | 2024 | 2023 | 2022 | 2021 | 2020 | |
| Opening balance at 01 July | 0 | 0 | 0 | 0 | 0 | 0 | |
| add | Allocations | 152,604 | 148,058 | 152,636 | 152,648 | 159,390 | 159,389 |
| less | Allocated diversions | 3,305 | 7,191 | 3,758 | 4,143 | 2,146 | 8,260 |
| less | Adjustments and forfeitures | 149,299 | 140,867 | 148,878 | 148,505 | 157,244 | 151,129 |
| Closing balance at 30 June | 0 | 0 | 0 | 0 | 0 | 0 | |
| Description | 2025 | 2024 | 2023 | 2022 | 2021 | 2020 | |
| Opening balance at 01 July | 0 | 0 | 0 | 0 | 0 | 0 | |
| add | Entitlements | 1,067,376 | 1,067,291 | 1,067,376 | 1,067,376 | 1,040,554 | 1,040,554 |
| less | Diversions to urban system | 539,703 | 521,335 | 465,312 | 503,707 | 510,487 | 467,605 |
| less | Adjustments and forfeitures | 527,673 | 545,956 | 602,064 | 563,669 | 530,067 | 572,949 |
| Closing balance at 30 June | 0 | 0 | 0 | 0 | 0 | 0 | |
- Surface water allocations for individual users and entitlement to the urban system were broadly consistent with those of recent years in the Sydney region during 2024-25.
- For surface water individual users, only 2% of the allocation volume was diverted across the Sydney region.
- The urban system held 1,067 GL of surface water entitlements in 2024-25, similar to the previous few years, with approximately half of the entitlements diverted.
Groundwater liabilities
| Description | 2025 | 2024 | 2023 | 2022 | 2021 | 2020 | |
| Opening balance at 01 July | 0 | 0 | 0 | 0 | 0 | 0 | |
| add | Allocations | 89,703 | 89,678 | 89,200 | 86,005 | 84,534 | 83,623 |
| less | Allocated extractions | 28,359 | 38,027 | 24,256 | 2,596 | 16,918 | 19,914 |
| less | Adjustments and forfeitures | 61,344 | 51,651 | 64,944 | 83,409 | 67,616 | 63,709 |
| Closing balance at 30 June | 0 | 0 | 0 | 0 | 0 | 0 | |
- Groundwater allocations for individual users in the Sydney region were 90 GL during 2024-25, similar to the last few years.
- Approximately, 30% of groundwater allocations were extracted across the Sydney region during 2024-25.
- By the end of the reporting period, all unused groundwater allocations were forfeited, with no volume of water carried over into the 2025-26 water year.
Water flows
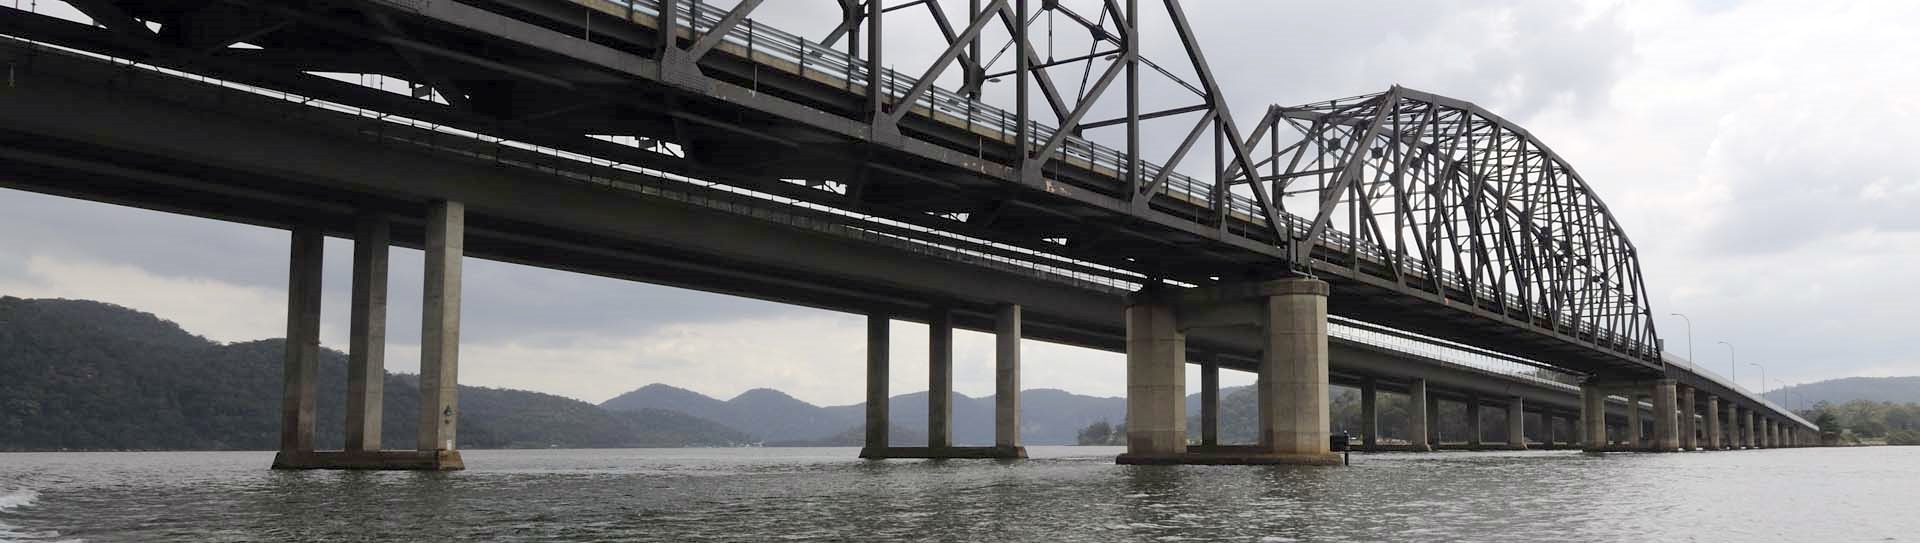
- Water flows in the Sydney region describe the movement of water between surface water, groundwater, and the urban system.
- A summary of total inflows and outflows for each water store is provided below.
- For a detailed breakdown of inflows and outflows in the Sydney region, refer to the Statement of Changes in Water Assets and Water Liabilities.
| Water inflows | 2025 | 2024 | 2023 | 2022 | 2021 | 2020 |
| Surface water inflows | 4,613,692 | 7,358,022 | 10,752,109 | 16,713,002 | 11,352,147 | 6,327,089 |
| Groundwater inflows | 1,577,074 | 1,843,627 | 2,406,460 | 2,895,754 | 2,104,462 | 1,071,247 |
| Urban system inflows | 1,097,756 | 1,137,683 | 1,135,529 | 1,225,643 | 1,100,949 | 1,074,892 |
| Total water inflows | 7,288,522 | 10,339,332 | 14,294,098 | 20,834,399 | 14,557,558 | 8,473,228 |
- Total water inflows to the Sydney region during 2024–25 were 7,289 GL, approximately 30% lower than the previous year, driven by a decrease in surface water inflows.
- Surface water inflows represented approximately 65% of total inflows, primarily from runoff, which was a little under 25% below the long-term average of 5,773 GL.
- Recharge from surface water accounted for the majority of groundwater inflows, though groundwater inflows decreased by less than 15% compared to the previous year.
- Urban system inflows made up the remaining share of total inflows, largely from surface water diversions and wastewater collected.
| Water outflows | 2025 | 2024 | 2023 | 2022 | 2021 | 2020 |
| Surface water outflows | 5,827,094 | 8,600,027 | 13,467,715 | 19,327,550 | 14,895,782 | 7,853,466 |
| Groundwater outflows | 28,359 | 38,027 | 24,256 | 2,596 | 16,918 | 19,914 |
| Urban system outflows | 1,094,744 | 1,115,073 | 1,136,958 | 1,228,189 | 1,099,164 | 1,085,180 |
| Total water outflows | 6,950,197 | 9,753,127 | 14,628,929 | 20,558,335 | 16,011,864 | 8,958,560 |
- Total water outflows from the Sydney region during 2024–25 were 6,950 GL, approximately 30% lower than the previous year, driven by reduced surface water outflows.
- Surface water outflows represented around 85% of total outflows, primarily from river outflows and recharge to groundwater.
- Extractions by individual users accounted for the entirety of groundwater outflows, but made up less than 1% of total outflows.
- The remaining volume of outflows were associated with the urban system, largely reflecting discharge to sea and the supply of drinking water to urban customers.
Water availability
| Surface water | 2025 | 2024 | 2023 | 2022 | 2021 | 2020 |
| Water availability | 7,127,984 | 9,723,559 | 13,129,277 | 18,931,361 | 13,305,195 | 7,576,698 |
| Water accessible | 1,258,146 | 1,253,515 | 1,252,268 | 1,252,280 | 1,232,200 | 1,232,199 |
| Water taken | 581,174 | 566,692 | 501,326 | 540,106 | 544,889 | 508,121 |
| % water accessible taken | 46% | 45% | 40% | 43% | 44% | 41% |
- Surface water availability in the Sydney region during 2024–25 was below average for the first time since 2019–20, decreasing by approximately 25% from the previous year.
- Changes in water availability across the Sydney region are heavily influenced by runoff.
- Runoff during 2024–25 decreased by less than 40% compared to the previous year, broadly aligning with the decline in water availability.
- Despite lower water availability, the volume of surface water accessible for take was the highest since 2011–12, although year-to-year variation in accessible volume remains narrow.
- Likewise, surface water taken in 2024–25 was the highest since 2019–20, largely due to increased diversions to the urban water system.
- The increase in accessible volume and water taken—despite the decrease in water availability—may reflect the prolonged period of high availability in recent years, which has eased pressure on water use across the region.
- Overall, approximately 45% of the surface water accessible for take in the Sydney region was taken, primarily for urban system diversions.
Water use
Consumptive use
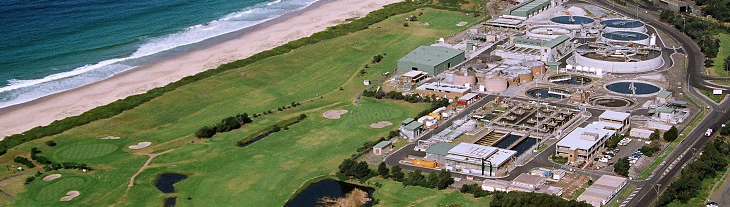
- A total of 610 GL was taken from surface water and groundwater resources for consumptive use in the Sydney region during 2024–25, slightly more than the previous year, primarily due to increased surface water diversions to the urban system.
| Surface water | 2025 | 2024 | 2023 | 2022 | 2021 | 2020 |
| Individual users | 3,305 | 7,191 | 3,758 | 4,143 | 2,146 | 8,260 |
| Statutory rights | 38,166 | 38,166 | 32,256 | 32,256 | 32,256 | 32,256 |
| Urban system | 539,703 | 521,335 | 465,312 | 503,707 | 510,487 | 467,605 |
| Total | 581,174 | 566,692 | 501,326 | 540,106 | 544,889 | 508,121 |
- Surface water diversions across the Sydney region totalled 581 GL, slightly higher than the previous year and close to the average of 572 GL.
- Approximately 95% of surface water diversions were for urban system supply, almost entirely to Sydney Water. Inter-region users with statutory rights accounted for just under 7%, with the remaining volume taken by individual users.
| Groundwater | 2025 | 2024 | 2023 | 2022 | 2021 | 2020 |
| Individual users | 28,359 | 38,027 | 24,256 | 2,596 | 16,918 | 19,914 |
| Total | 28,359 | 38,027 | 24,256 | 2,596 | 16,918 | 19,914 |
- Groundwater extractions totalled 28 GL, a 25% decrease compared to the previous year, all of which were extracted by individual users.
Allocations and diversions
| Surface water | 2025 | 2024 | 2023 | 2022 | 2021 | 2020 |
| Individual users | ||||||
| Carryover | 0 | 0 | 0 | 0 | 0 | 0 |
| Allocated announcements | 152,604 | 148,058 | 152,636 | 152,648 | 159,390 | 159,389 |
| Allocated diversions | 3,305 | 7,191 | 3,758 | 4,143 | 2,146 | 8,260 |
| % used | 2% | 5% | 2% | 3% | 1% | 5% |
| Urban users | ||||||
| Carryover | 0 | 0 | 0 | 0 | 0 | 0 |
| Allocated entitlements | 1,067,376 | 1,067,291 | 1,067,376 | 1,067,376 | 1,040,554 | 1,040,554 |
| Allocated diversions | 539,703 | 521,335 | 465,312 | 503,707 | 510,487 | 467,605 |
| % used | 51% | 49% | 44% | 47% | 49% | 45% |
| Total | ||||||
| Carryover | 0 | 0 | 0 | 0 | 0 | 0 |
| Allocations | 1,219,980 | 1,215,349 | 1,220,012 | 1,220,024 | 1,199,944 | 1,199,943 |
| Allocated diversions | 543,008 | 528,526 | 469,070 | 507,850 | 512,633 | 475,865 |
| % used | 45% | 43% | 38% | 42% | 43% | 40% |
- Total surface water allocations in the Sydney region during 2024–25 were 1,220 GL, of which 45% (543 GL) was diverted, primarily to the urban system.
- Entitlements to the urban system accounted for approximately 85% (1,067 GL) of total allocations, with around 50% (540 GL) of this volume diverted for urban water supply.
- Surface water allocations for individual users totalled 153 GL, representing around 15% of total allocations, though only 2% of this volume was diverted during the year.
- Urban water use dominated total diversions, accounting for more than 99% of all surface water diverted across the region.
- Overall, diversions in the Sydney region during 2024–25 were similar to the previous year, and were the highest since 2018–19.
| Groundwater | 2025 | 2024 | 2023 | 2022 | 2021 | 2020 |
| Individual users | ||||||
| Carryover | 0 | 0 | 0 | 0 | 0 | 0 |
| Allocated announcements | 89,703 | 89,678 | 89,200 | 86,005 | 84,534 | 83,623 |
| Allocated extractions | 28,359 | 38,027 | 24,256 | 2,596 | 16,918 | 19,914 |
| % used | 32% | 42% | 27% | 3% | 20% | 24% |
- Total groundwater allocations in the Sydney region during 2024–25 were 90 GL, consistent with volumes recorded in recent years.
- Approximately 30% (28 GL) of the allocated volume was extracted, all for private and commercial use.
- Groundwater extractions were 25% lower than the previous year, but remained well above the average of 18 GL for the region.
- There are no groundwater entitlements for urban users in the Sydney region.
Urban supply system
| Water sources | 2025 | 2024 | 2023 | 2022 | 2021 | 2020 |
| Surface water | 536,022 | 517,654 | 461,631 | 500,026 | 509,116 | 464,608 |
| Inter-region | 3,681 | 3,681 | 3,681 | 3,681 | 1,371 | 2,997 |
| Desalinated water | 21,412 | 35,216 | 67,996 | 22,480 | 19,609 | 71,147 |
| Total urban water supplied | 561,115 | 556,551 | 533,308 | 526,187 | 530,096 | 538,752 |
- A total of 561 GL of water was sourced for the urban supply system in the Sydney region during 2024–25, slightly more than the previous year, and close to the average of 546 GL.
- Approximately 95% of the total urban supply came from surface water storages, a slight increase compared to last year.
- Desalinated water contributed around 4% of the total urban supply, with inter-region inflows making up the remaining share.
- The contribution of desalinated water was a little less than 40% lower than last year.
- For more information on the use of desalinated water in the Sydney region, please visit the Sydney Desalination Plant website.
| Supply of drinking water | 2025 | 2024 | 2023 | 2022 | 2021 | 2020 |
| Residential customers | 367,072 | 362,932 | 349,861 | 349,541 | 360,247 | 359,637 |
| Commercial & industrial customers | 95,532 | 84,482 | 110,716 | 101,418 | 89,182 | 115,503 |
| Agricultural & irrigation customers | 3,414 | 3,665 | 3,379 | 3,050 | 3,407 | 5,125 |
| Other customers | 14,563 | 14,263 | 12,478 | 14,336 | 20,997 | 15,961 |
| Total drinking water used | 480,581 | 465,342 | 476,434 | 468,345 | 473,833 | 496,226 |
- A total of 481 GL of drinking water (excluding recycled water) was supplied to urban customers in the Sydney region during 2024–25, slightly higher than the previous year, but just under the average of 485 GL.
- Residential customers accounted for the majority of drinking water use, receiving 367 GL, or around 75% of total demand.
- Commercial and industrial customers used 96 GL (approximately 20% of total consumption), while agriculture and irrigation accounted for 3 GL (less than 1%).
- Drinking water supplied to other customers, including small commercial operations and community services, totalled 15 GL, representing around 3% of total urban use.
- Overall, drinking water use in 2024–25 remained within the typical range observed over the past decade.