


Burdekin: Climate and water
For the water account period 1 July 2024 to 30 June 2025
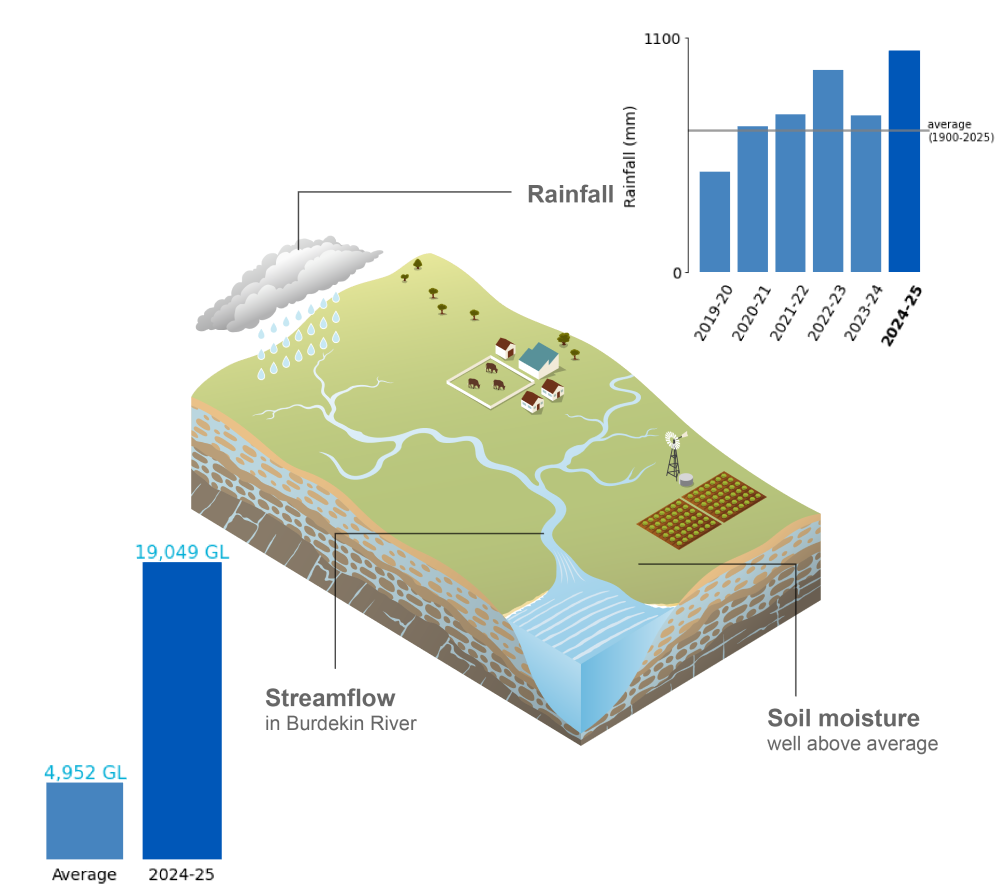
- Rainfall during 2024–25 was above average for the fifth consecutive year.
- Soil moisture in the root zone (0–1 m depth) was above average across much of the region, reflecting sustained rainfall and retained moisture throughout the reporting period.
- Streamflows were above average at all four gauging stations, with both the upper Burdekin and Cape rivers recording flows almost four times the long-term average.
For further information on the climate and water conditions across the Burdekin region during the current reporting year, scroll down this page or click on the links below:
About the region
- The Burdekin region spans two climatic zones. East of the Great Dividing Range, the region experiences a tropical monsoonal climate, characterised by hot, humid summers and warm, dry winters. In contracts, areas west of the Great Dividing Range experience a dry tropical climate, with hot, dry summers and warm, dry winters.
- Most of the region's rainfall occurs during the northern wet season from October to April, driven by active monsoon phases and tropical cyclones. Rainfall is significantly higher east of the Great Dividing Range than in areas west of the range.
- Streamflow in the region's rivers generally reflects the distribution of rainfall throughout the year. Higher streamflow and storage inflows typically occur from October to April, while flows may cease during the dry season from May to September.
Climate conditions
Rainfall
Figure C1 Annual and monthly rainfall deciles for the Burdekin region during the 2024–25 reporting period
- Total area-averaged rainfall in the Burdekin region during 2024–25 was 1,040 mm, around 60% above the long-term average of 660 mm.
- In the lead-up to the northern wet season, rainfall was generally below average. August was an exception, with wetter than average conditions when an upper-level trough interacted with onshore easterly flows, producing locally heavy daily rainfall totals of up to 100 mm.
- Frequent thunderstorm activity during the final week of November contributed to near-average rainfall during the month, with weekly totals in excess of 100 mm recorded across parts of the region.
- Tropical low and an associated trough influenced the region during the second half of December, resulting in showers and scattered storms. Weekly rainfall totals exceeded 300 mm in some areas, and monthly rainfall was well above average for the region.
- In early February, a slow moving tropical low embedded within an active monsoon trough brought several days of widespread heavy rainfall to most of the region. Multiple locations recorded very high multi-day totals, including 7-day totals rainfall exceeding 1,000 mm, which resulted in major widespread riverine flooding across the region. Rainfall during February and the broader summer period was very much above average across the region.
- Increased onshore flows during March further contributed to widespread rainfall, with monthly totals greater than 500 mm contributing to the region's seventh-wettest March on record.
- By the end of April, the region had recorded its fifth-wettest wet season on record, accounting for more than 90% of the annual total.rainfall observed during the reporting period, largely due to the extreme rainfall events in February and March.
- Although rainfall eased during May and June, the very wet conditions from late summer into autumn were sufficient for several locations across the region to record more than well above their long-term averages.
- Further information on the 2024–25 northern wet season can be found in Australia's 2024–25 Northern Wet Season, while more details on Australia's climate and water during the 2024–25 reporting period can be found in the Financial Year Climate and Water Statement 2024–25.
Figure C2 Total monthly rainfall for the Burdekin region during the 2024–25 reporting period, compared with the average and percentiles for the region
- Rainfall during December, February, and March was very much above average across the region, reflecting the sustained wet conditions that developed across the region during the wet season.
- Throughout the reporting period, rainfall was generally near-average to above average, with no extended periods of very low rainfall observed across the region.
Actual evapotranspiration
Figure C3 Annual and monthly actual evapotranspiration deciles for the Burdekin region during the 2024–25 reporting period
- Total area-averaged actual evapotranspiration was above average across much of the Burdekin region during 2024–25, reflecting sustained rainfall and retained moisture availability throughout the reporting period.
- At the start of the reporting period, evapotranspiration was near-average to above average across much of the region, following wetter-than-average conditions in June 2024, that supported soil moisture levels into the dry season.
- Throughout spring, evapotranspiration declined slightly, becoming more variable across the region, with below-average conditions occuring in parts of the western Burdekin, west of the Great Dividing Range.
- Increased rainfall during the second half of December, evapotranspiration became above average across much of the region, with very much above-average conditions evident in northern and central parts of the Burdekin Basin.
- During February, evapotranspiration was generally closer to average across much of the region, despite very wet conditions, reflecting the influence of persistent cloud cover and reduced evaporative demand during the active monsoon period.
- Evapotranspiration increased again during March and became very much above average across large parts of the region during April and May, consistent with continued wet conditions and high soil moisture following the major rainfall events earlier in the year.
- By June, evapotranspiration remained above average across much of the region, particularly in inland and central areas, indicating that elevated soil moisture persisted as the region transitioned into the dry season.
Soil moisture
Figure C4 Annual and monthly soil moisture deciles for the Burdekin region during the 2024–25 reporting period
- Total area-averaged soil moisture in the root zone (0–1 m depth) was above average across much of the Burdekin region during 2024–25, consistent with sustained rainfall and elevated moisture throughout the reporting period.
- Soil moisture was generally average to above average across much of the region in July and August, supported by above-average rainfall in June 2024 that increased soil moisture levels during the dry season.
- Conditions became more varied through spring, with below-average soil moisture developing across inland parts of the region, particularly west of the Great Dividing Range, while coastal and northern areas remained closer to average.
- By November, below-average soil moisture had expanded across much of the region, before increased rainfall during late November and December led to improving soil moisture conditions across the northern and central areas of the Burdekin Basin.
- Despite some easing in January, soil moisture remained predominantly average to above average across the region, before increasing increasing further during February in response to widespread heavy rainfall associated with the active monsoon period.
- Soil moisture levels peaked towards the end of the northern wet season, when much of the region was very much above average conditions, reflecting the cumulative effect of sustained wet-season rainfall.
- Although rainfall eased towards the end of the reporting period, average to above-average conditions persisted across the region, indicating that moisture accumulated earlier in the year retained in the soil profile as the region transitioned into the dry season.
- Further information on soil moisture conditions across the Burdekin region during the 2024–25 reporting period is available on the Australian Water Outlook.
Streamflow responses
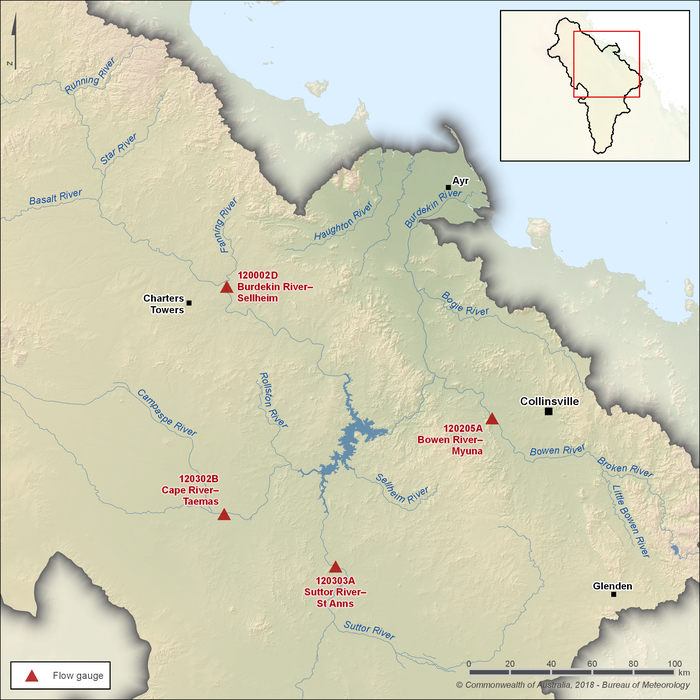
Figure C5 Key flow gauging stations along the main rivers within the Burdekin region
- The Burdekin, Cape, and Suttor rivers are the primary river systems within the Burdekin region and flow into Lake Dalrymple, which supports the Burdekin Haughton Water Supply Scheme.
- Four gauging stations (shown in Figure C5) are used to represent seasonal flow patterns in the region's rivers. Three monitor flows into Lake Dalrymple, while the fourth—Bowen River at Myuna (Station 120205A)—monitors flows in the Bowen River downstream of Lake Eungella, which supports the Bowen Broken Water Supply Scheme.
- Flows in rivers upstream of Lake Dalrymple are generally very low or may cease during the dry season from May to October. In contrast, flows downstream of Lake Dalrymple in the Burdekin River and Lake Eungella in the Bowen River are regulated by dam releases and are therefore generally perennial.
Figure C6 Total monthly flow for major rivers in the Burdekin region during the 2024–25 reporting period, compared with the average and percentiles for each gauging station
- Streamflows in the Burdekin region during 2024–25 were generally above average at the region's major gauging stations, reflecting the very wet-season conditions that produced substantial runoff across the river systems, particularly in catchments upstream of Lake Dalrymple.
- Streamflow responses in the upper Burdekin and Cape rivers were especially strong during the wet season, with flows well above the long-term average for extended periods, consistent with the magnitude and persistence of the wet-season.
- As is typical of the region, flows during the dry season were low. The Cape and Suttor rivers ceased to flow between August and October, while flows in the upper Burdekin River remained closer to average early in the reporting period before declining later in the dry season.
- Increased rainfall during December led to rising flows across all monitored river systems, with streamflows in the upper Burdekin River reaching high flow levels relative to the historical distribution for that time of year.
- Widespread heavy rainfall during February resulted in major flooding across the region, with all four gauging stations recording their highest monthly flows of the reporting period. Streamflows at several sites were very much above during this time, reflecting the widespread nature of the rainfall and runoff.
- Streamflows decreased during March, particularly in the Bowen River, while remaining above average in the upper Burdekin and Cape rivers, indicating increased variability in runoff responses following the main wet-season rainfall events.
- A further period of elevated streamflows occurred during April, with all gauging stations recording above-average to very high flows, reflecting the persistence of wet catchment conditions as rainfall gradually eased across the region.
- Consistent with the strongly seasonal nature of the Burdekin hydrology, the majority of streamflow during the reporting period occured between October and April, highlighting the dominant influence of the northern wet season on river flows.
- Streamflows decrlined through May and June, as is typical for this time of year, with flows becoming near-average to below average across most sites. Flow in the upper Burdekin River remained above average, likely reflecting runoff sustained by the very wet conditions earlier in the year.