


Burdekin: Key findings
For the water account period 1 July 2024 to 30 June 2025
- Rainfall during 2024–25 was above average for the fifth consecutive year.
- Total water inflows to the Burdekin region during 2024–25 were 33,871 GL, almost five times higher than the previous reporting period.
- Approximately 40% of surface water and groundwater available in the Burdekin region were taken, mainly for allocated diversions to irrigation users under the Burdekin Haughton Water Supply Scheme.
Climate and water
Rainfall

1,040 mm
58% above the average of 660 mm
Streamflow

well above average
from February to May
Storage

101.6% full

5.8% more than last year
Water use from all sources
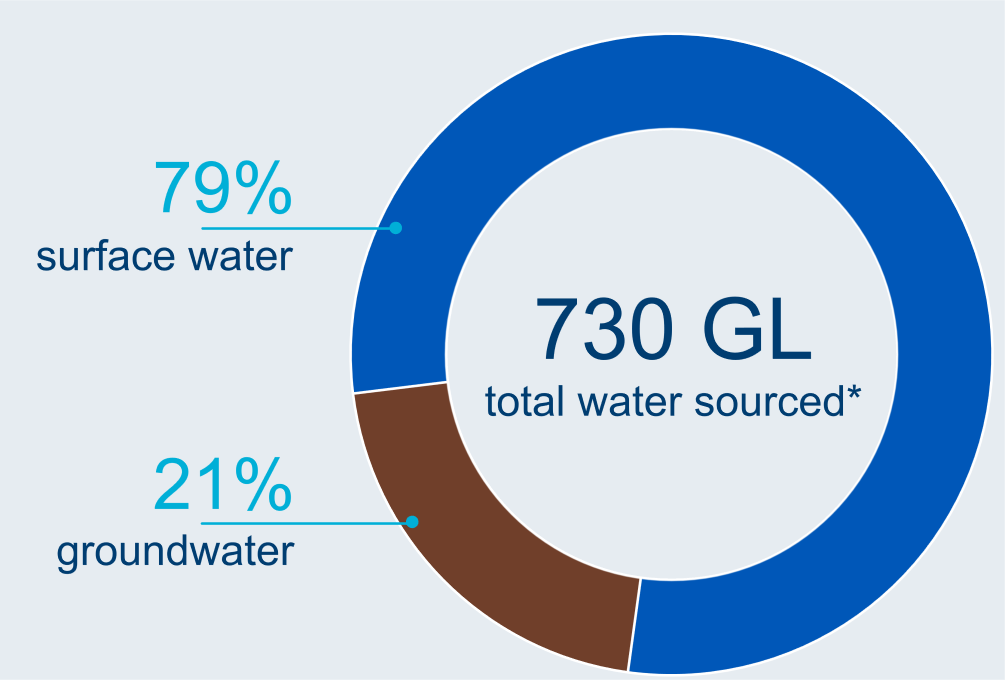
Water sourced
Water supplied
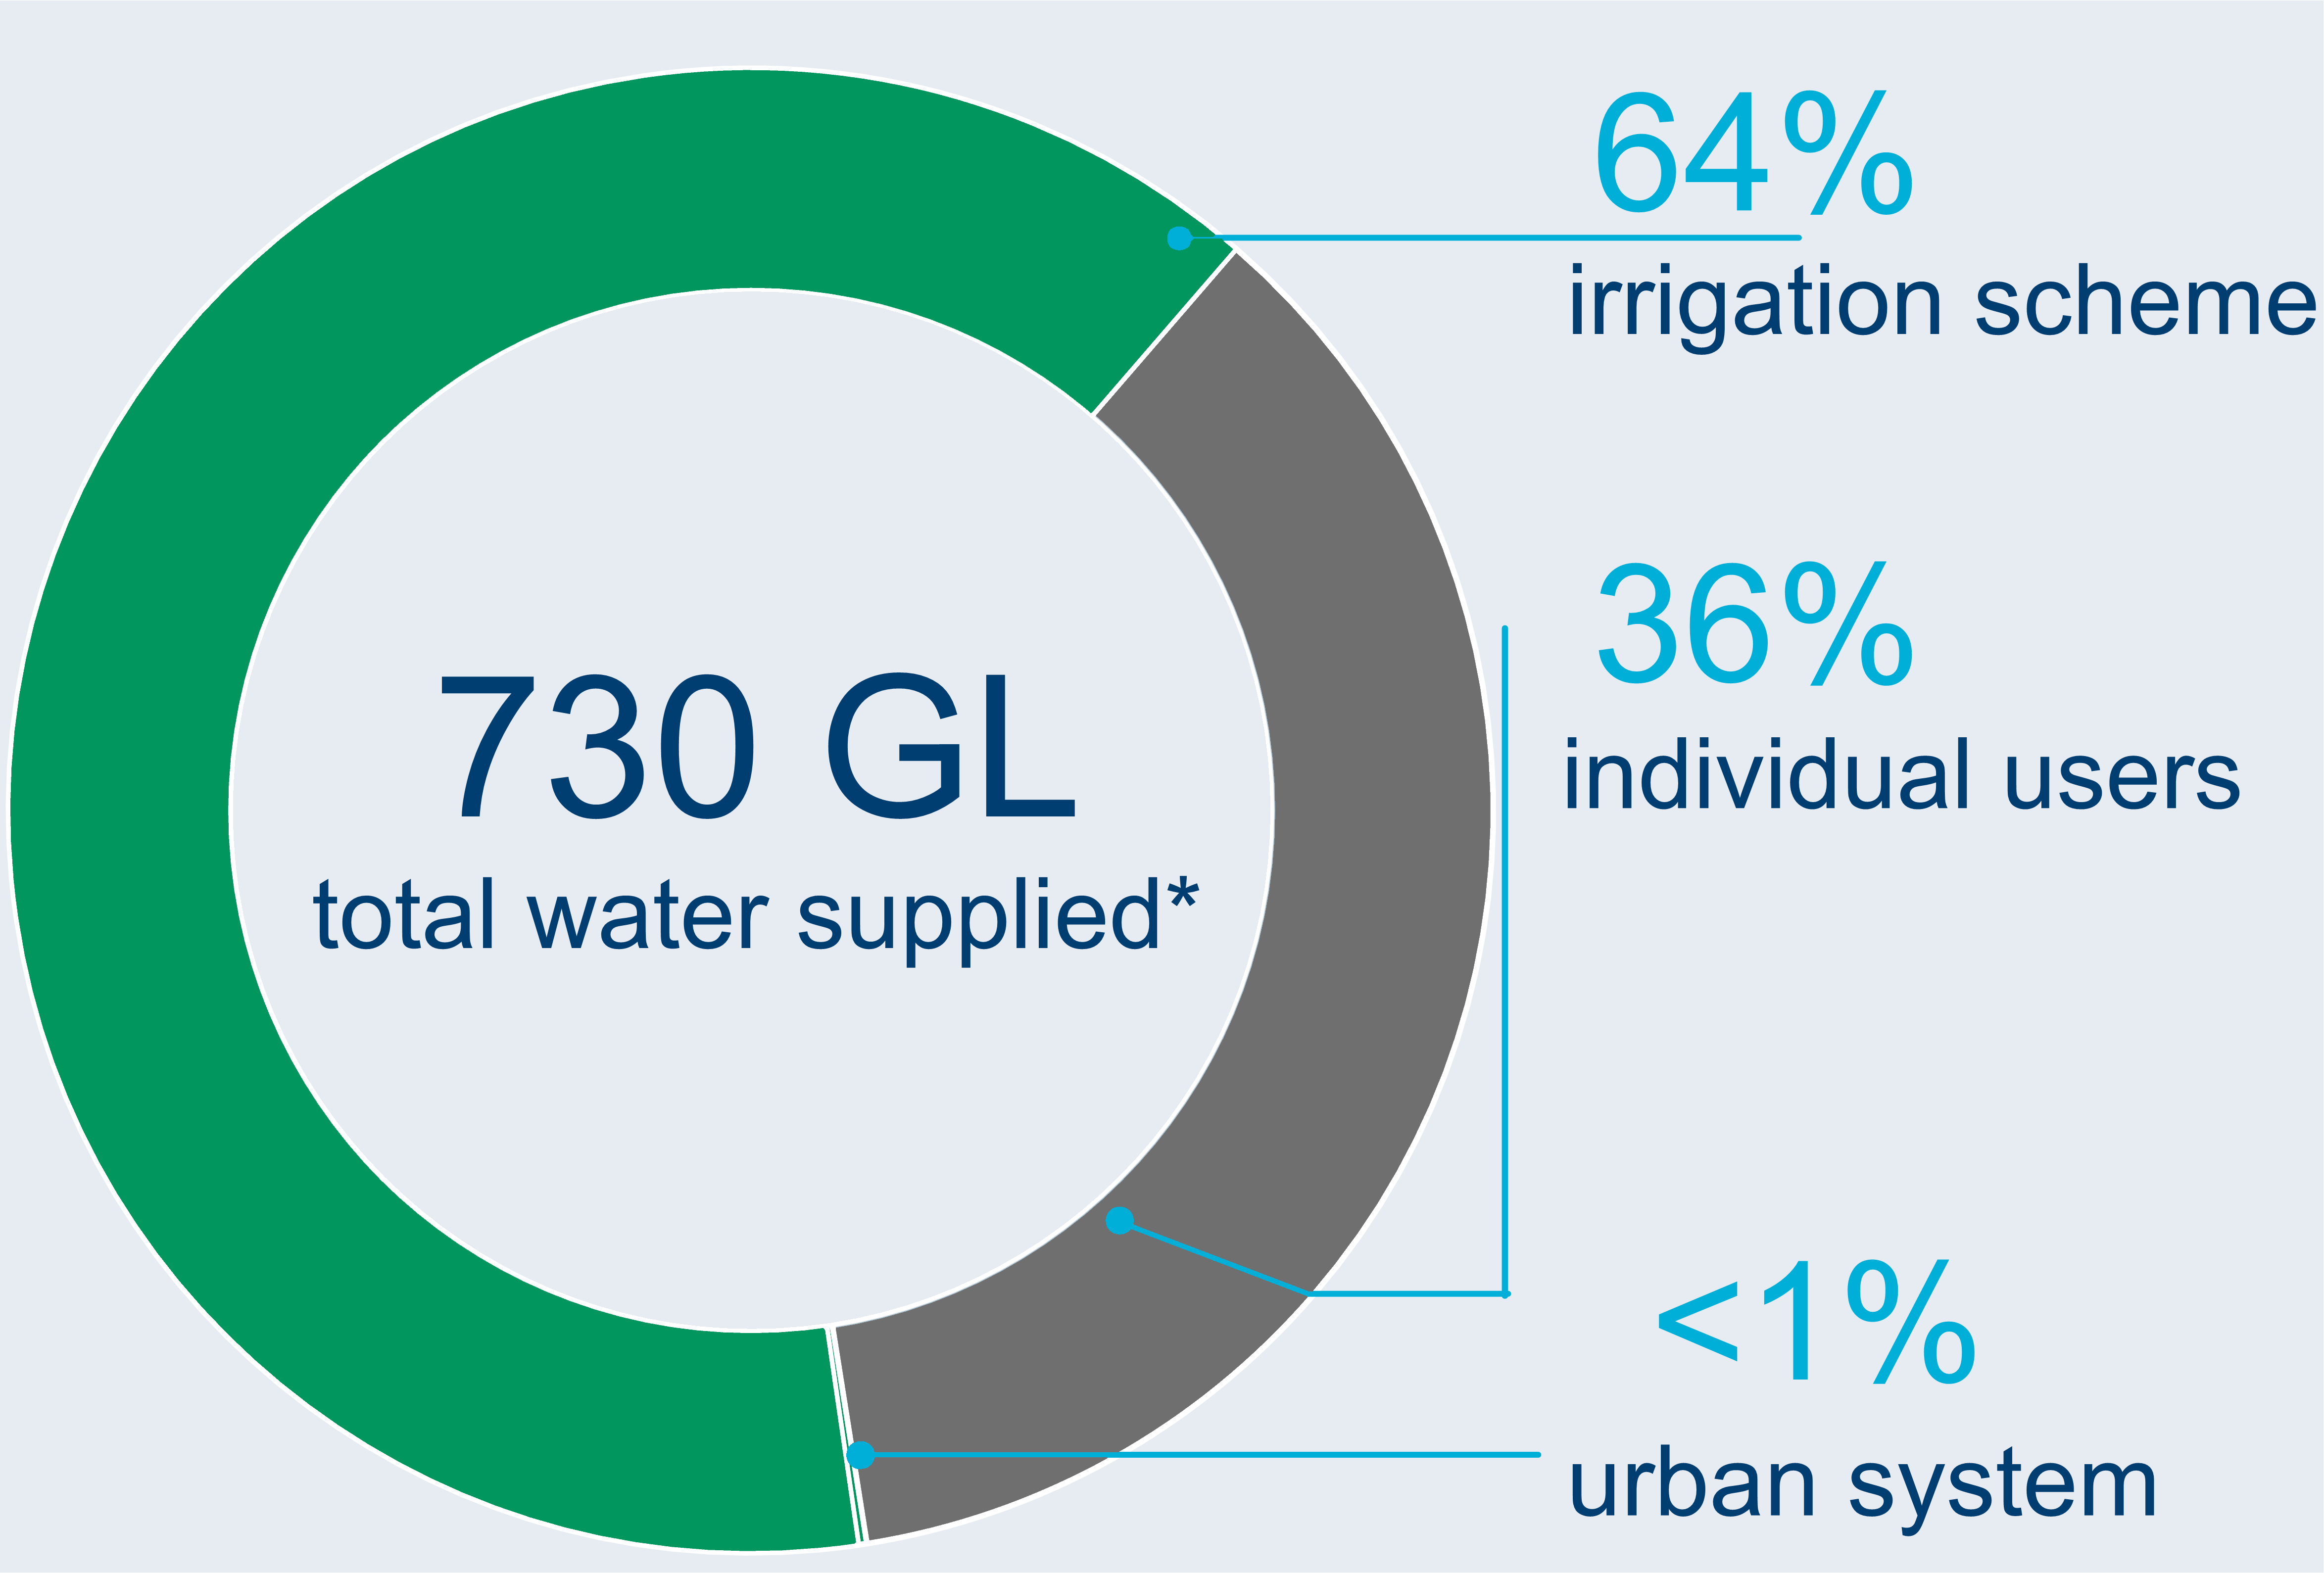
* Includes non-allocated water use
Water status of water resources
Water availability
33,905 GL
surface water available in 2024–25
336% more than last year
Water accessible
1,729 GL
total surface water and groundwater accessible in 2024–25
slightly more than last year
Water taken
730 GL
total surface water and groundwater taken in 2024–25

11% less than last year