


Burdekin: Supporting information
For the water account period 1 July 2024 to 30 June 2025
- Total water inflows to the Burdekin region during 2024–25 were 33,871 GL, almost five times higher than the previous reporting period.
- Total storage volume in the Burdekin region finished the reporting period at 101.6% full.
- Approximately 40% of surface water and groundwater resources in the Burdekin region were taken, mainly for allocated diversions to irrigation users under the Burdekin Haughton Water Supply Scheme.
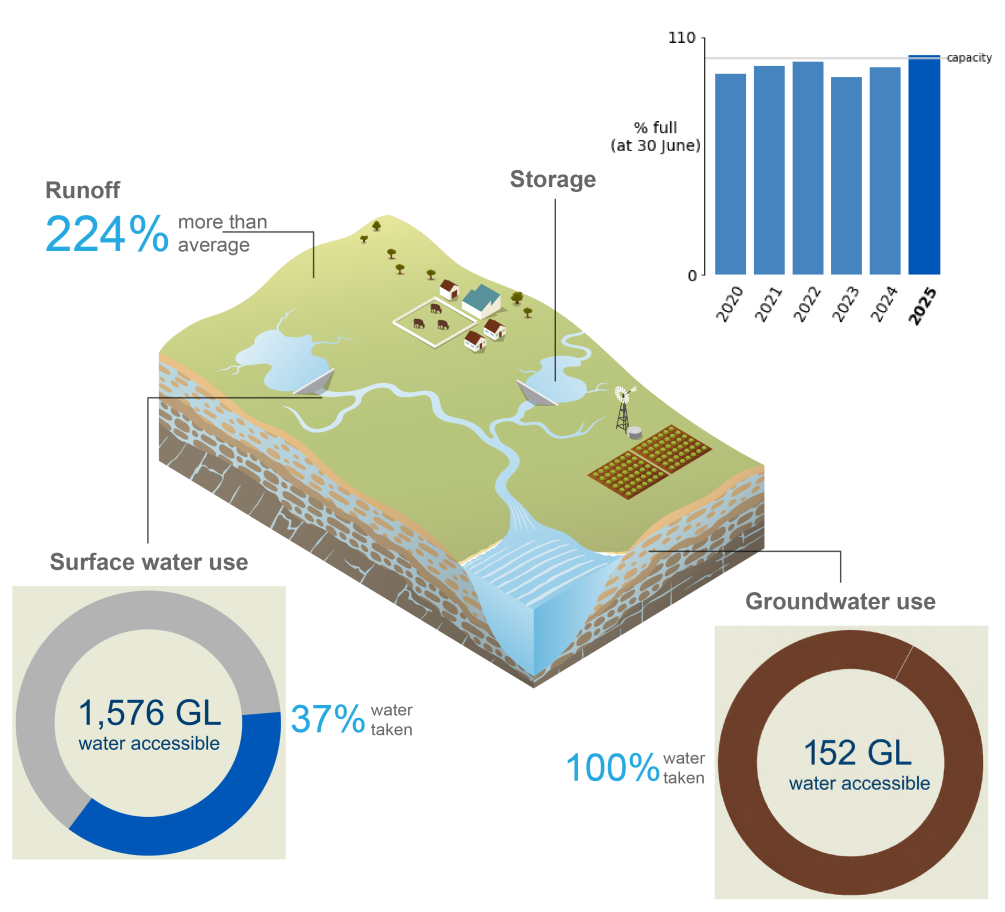
This section provides a detailed breakdown of water assets, liabilities, flows, availability, and use in the Burdekin region over the past six water accounting periods, outlining where water is stored and how it is used across the region.
For further information, scroll down this page or click on the links below:
Water assets
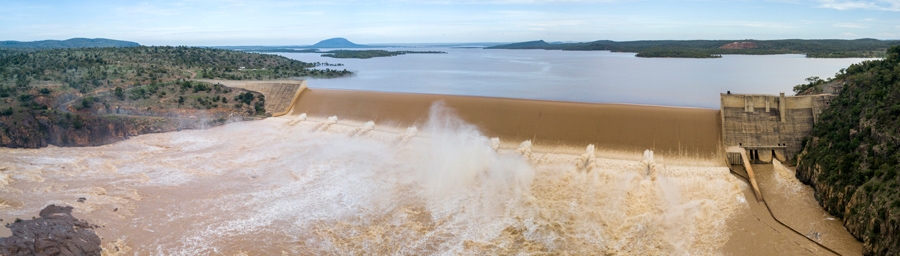
- Total water assets in the Burdekin region on 30 June 2025 were 2,227 GL, slightly higher than the previous reporting period, and the highest end-of-year water asset volume since the account commenced in 2012–13.
- Approximately 90% of the region’s water assets were held in surface water storages, while groundwater aquifers accounted for 10% of total assets.
- A detailed breakdown of water assets in the Burdekin region is available in the Statement of Water Assets and Water Liabilities.
Surface water assets
| Surface water | 2025 | 2024 | 2023 | 2022 | 2021 | 2020 |
| Burdekin Falls | 1,877,923 | 1,770,861 | 1,690,213 | 1,850,538 | 1,804,949 | 1,728,597 |
| Clare Weir | 25,156 | 16,394 | 13,012 | 14,401 | 15,673 | 15,512 |
| Eungella | 111,681 | 111,748 | 109,664 | 92,526 | 91,926 | 97,396 |
| Giru Weir | 685 | 833 | 690 | 657 | 711 | 764 |
| Lake Paluma | 8,199 | 11,512 | 10,229 | 9,427 | 11,309 | 7,846 |
| Accessible total | 2,023,644 | 1,911,348 | 1,823,808 | 1,967,549 | 1,924,568 | 1,850,115 |
| Dead storage | 9,405 | 9,405 | 9,405 | 9,405 | 9,405 | 9,405 |
| Total storage | 2,033,049 | 1,920,753 | 1,833,213 | 1,976,954 | 1,933,973 | 1,859,520 |
| Total capacity | 2,000,897 | 2,000,897 | 2,000,897 | 2,000,897 | 2,000,897 | 2,000,897 |
| % full | 101.6% | 96.0% | 91.6% | 98.8% | 96.7% | 92.9% |
- The total storage volume in the Burdekin region increased by 6 percentage points during 2024–25, finishing at 101.6% full on 30 June 2025.
- This was the first time since 2011–12 that storages had finished above 100% full, and the highest end-of-year storage volume since the same reporting period.
- Lake Dalrymple, formed by Burdekin Falls Dam, accounts for approximately 90% of the region's total storage capacity.
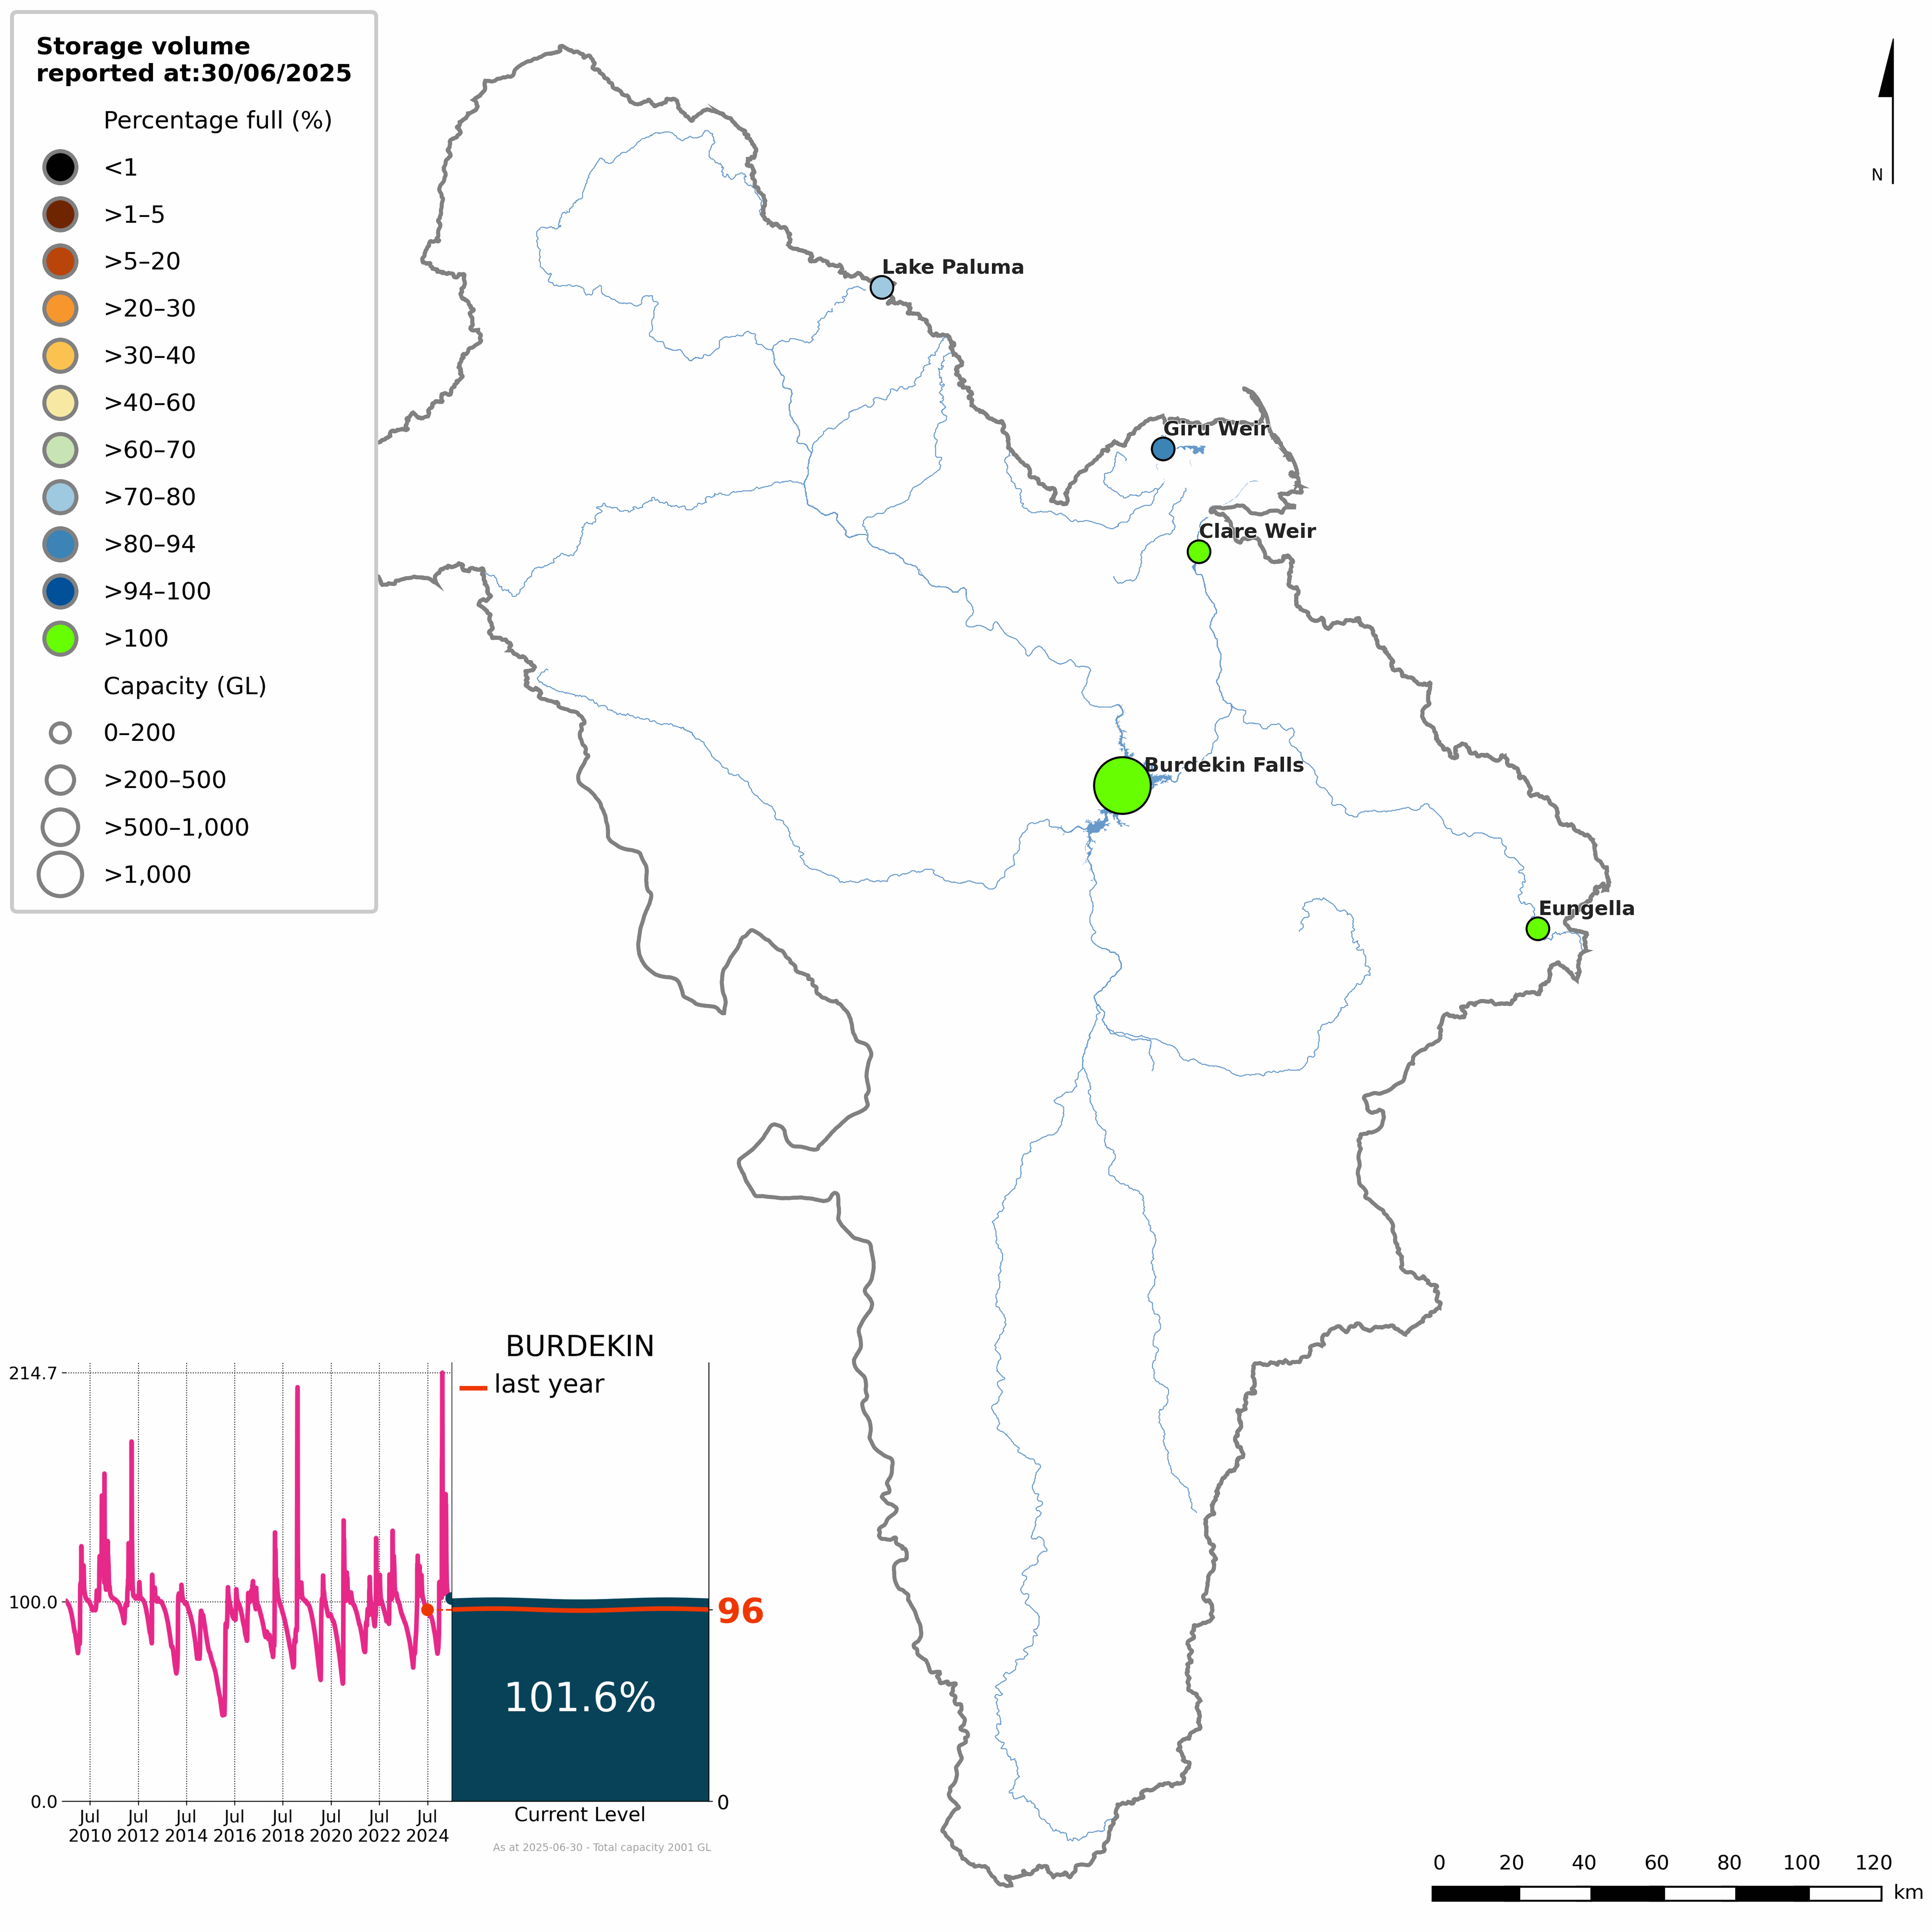
Figure S1 Percentage-full volume on 30 June 2025 for each storage and total storage volume since July 2009 (inset)
- The total storage volume in the Burdekin region began the 2024–25 reporting period at 96% full.
- Although rainfall remained close to average throughout winter and spring, storages declined steadily through this period, falling to just under 75% full towards the end of November—its lowest point during the reporting period.
- Increased thunderstorm activity and heavy rainfall in mid-December saw storage levels increase from 85% to 110% and remaining above 100% full through to the new calender year.
- During the first week of February, a slow-moving tropical low delivered above average rainfall, causing storage volumes to surge rapidly and peak at 215% full on 11 February—the highest storage level on record (since January 1980).
- Following the extreme rainfall event in February, storages declined rapidly through the remainder of the month before stabilising at just above 100% full during March.
- Another heavy rainfall in late March generated a second increase in storage levels, peaking at just over 150% full, before gradually declining again through April.
- From May through to the end of June, storage levels remained relatively stable, finishing at 101.6% full on 30 June 2025.
- More detailed information on individual storages in the Burdekin region is available on the Bureau of Meteorology's Water Information Dashboard.
Water liabilities
- Water liabilities in the Burdekin region refer to the volume of allocation remaining on licence entitlements at the end of the reporting period (30 June).
- Licence entitlements in the Burdekin region include carryover provisions, allowing any unused portion of the allocation to be carried over into the next reporting period.
- As all groundwater extractions are taken for non-allocated purposes, there are no groundwater allocation licences in the Burdekin region.
- A more detailed description of water allocations in the Burdekin region is provided in the Water use section.
Surface water liabilities
| Description | 2025 | 2024 | 2023 | 2022 | 2021 | 2020 | |
| Opening balance at 01 July | 269,898 | 269,898 | 0 | 159,976 | 108,151 | 119,813 | |
| add | Allocations | 1,140,093 | 1,140,093 | 1,140,093 | 1,140,093 | 1,181,223 | 1,170,327 |
| less | Allocated diversions | 411,016 | 540,790 | 396,116 | 542,378 | 540,953 | 645,988 |
| less | Adjustments and forfeitures | 998,975 | 599,303 | 474,079 | 757,691 | 588,445 | 536,001 |
| Closing balance at 30 June | 0 | 269,898 | 269,898 | 0 | 159,976 | 108,151 | |
- Surface water allocations in the Burdekin region during 2024–25 were 1,140 GL, predominantly for medium security surface water licences, with an additional 270 GL of water carried over from the previous year.
- Approximately 35% (411 GL) of the total surface water volume accessible for take was diverted during the reporting period, primarily for irrigation supply under allocated diversions.
- Due to spillage from Burdekin Falls Dam, no surface water allocations were carried over into the next reporting period, resulting in a closing balance of 0 ML on 30 June 2025.
Water flows
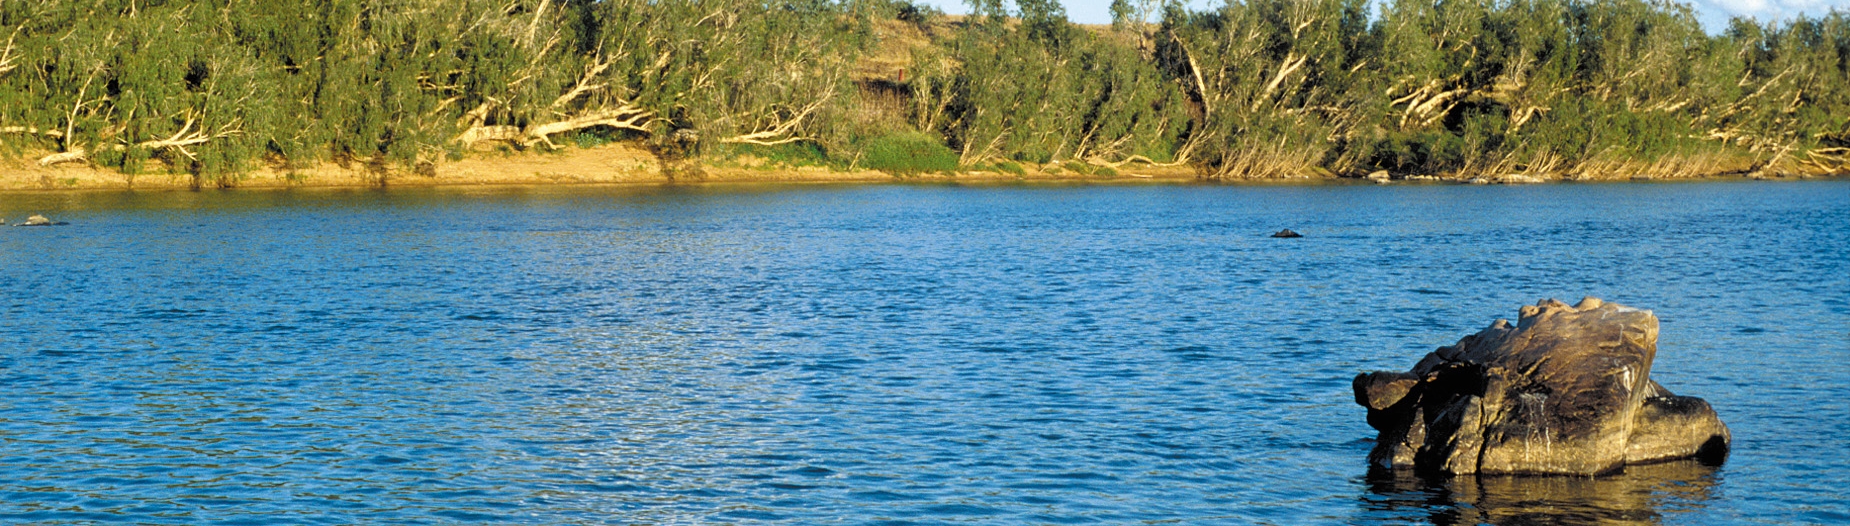
- Water flows in the Burdekin region describe the movement of water between surface water and groundwater stores.
- A summary of total inflows and outflows for each water store is provided below.
- For a detailed breakdown of inflows and outflows in the Burdekin region, refer to the Statement of Changes in Water Assets and Water Liabilities.
| Water inflows | 2025 | 2024 | 2023 | 2022 | 2021 | 2020 |
| Surface water inflows | 32,727,694 | 6,106,287 | 11,932,970 | 6,260,543 | 10,612,475 | 2,742,522 |
| Groundwater inflows | 1,143,151 | 825,553 | 903,968 | 737,028 | 788,841 | 654,951 |
| Total water inflows | 33,870,845 | 6,931,840 | 12,836,938 | 6,997,571 | 11,401,316 | 3,397,473 |
- Total water inflows to the Burdekin region during 2024–25 were 33,871 GL, almost five times higher than the previous reporting period, driven by increased surface water inflows.
- Surface water inflows contributed just over 95% (32,728 GL) of total inflows, with runoff accounting for approximately 90% of all inflows to the region, reflecting its dominant role in the region's water balance.
- Runoff into the region's surface water storages was more than three times the long-term average of 9,639 GL (based on area-averaged modelled data since July 1971), and the highest since the 2008–09 reporting period.
- Groundwater inflows made up the remaining volume (1,143 GL) of total inflows, of which approximately 95% was associated with recharge from surface water.
| Water outflows | 2025 | 2024 | 2023 | 2022 | 2021 | 2020 |
| Surface water outflows | 37,253,052 | 8,508,528 | 14,080,617 | 7,396,325 | 11,459,572 | 4,753,317 |
| Groundwater outflows | 152,357 | 118,959 | 94,000 | 106,635 | 148,028 | 147,521 |
| Total water outflows | 37,405,409 | 8,627,487 | 14,174,617 | 7,502,960 | 11,607,600 | 4,900,838 |
- Total water outflows from the Burdekin region during 2024–25 were 37,405 GL, more than four times higher than the previous reporting period, and the highest on record since the account commenced in 2013–14.
- Surface water outflows accounted for more than 99% (37,253.1 GL) of total outflows, with outflows to sea contributing nearly 90% of all outflows from the region, reflecting the strong influence runoff has on outflows from the region.
- Outflows to sea were more than three times the long-term average of 9,897 GL (based on area-averaged modelled data since July 1971), corresponding to the substantial increase in runoff across the region, particularly between February and April.
- Groundwater outflows made up the remaining volume (152 GL) of total outflows, primarily from non-allocated extractions to irrigation users.
Water availability
| Surface water | 2025 | 2024 | 2023 | 2022 | 2021 | 2020 |
| Water availability | 33,904,509 | 7,776,210 | 13,580,891 | 8,063,117 | 12,231,676 | 4,687,760 |
| Water accessible | 1,576,292 | 1,571,913 | 1,301,408 | 1,478,335 | 1,447,413 | 1,448,179 |
| Water taken | 577,317 | 702,712 | 557,431 | 720,644 | 698,992 | 804,027 |
| % water accessible taken | 37% | 45% | 43% | 49% | 48% | 56% |
- Surface water availability in the Burdekin region during 2024–25 was more than three times the long-term average of 10,762 GL, and 335% higher than the previous reporting period, reflecting the significant increase in runoff across the region following the fifth-wettest wet season on record.
- Changes in water availability across the Burdekin region are strongly influenced by runoff. Generally, when runoff increases or decreases, water availability responds in a similar way.
- Surface water accessible for take in the Burdekin region was similar to the previous reporting period, reflecting allocations and carryover.
- Water taken from surface water resources in the Burdekin region was 25% below the average of 769 GL, and 20% lower than the previous reporting period, mainly due to decreased allocated diversions to irrigation users.
- Overall, approximately 35% of the surface water accessible for take in the Burdekin region was taken, mainly for allocated diversions to irrigation users and non-allocated diversions to other users.
Water use
Consumptive use
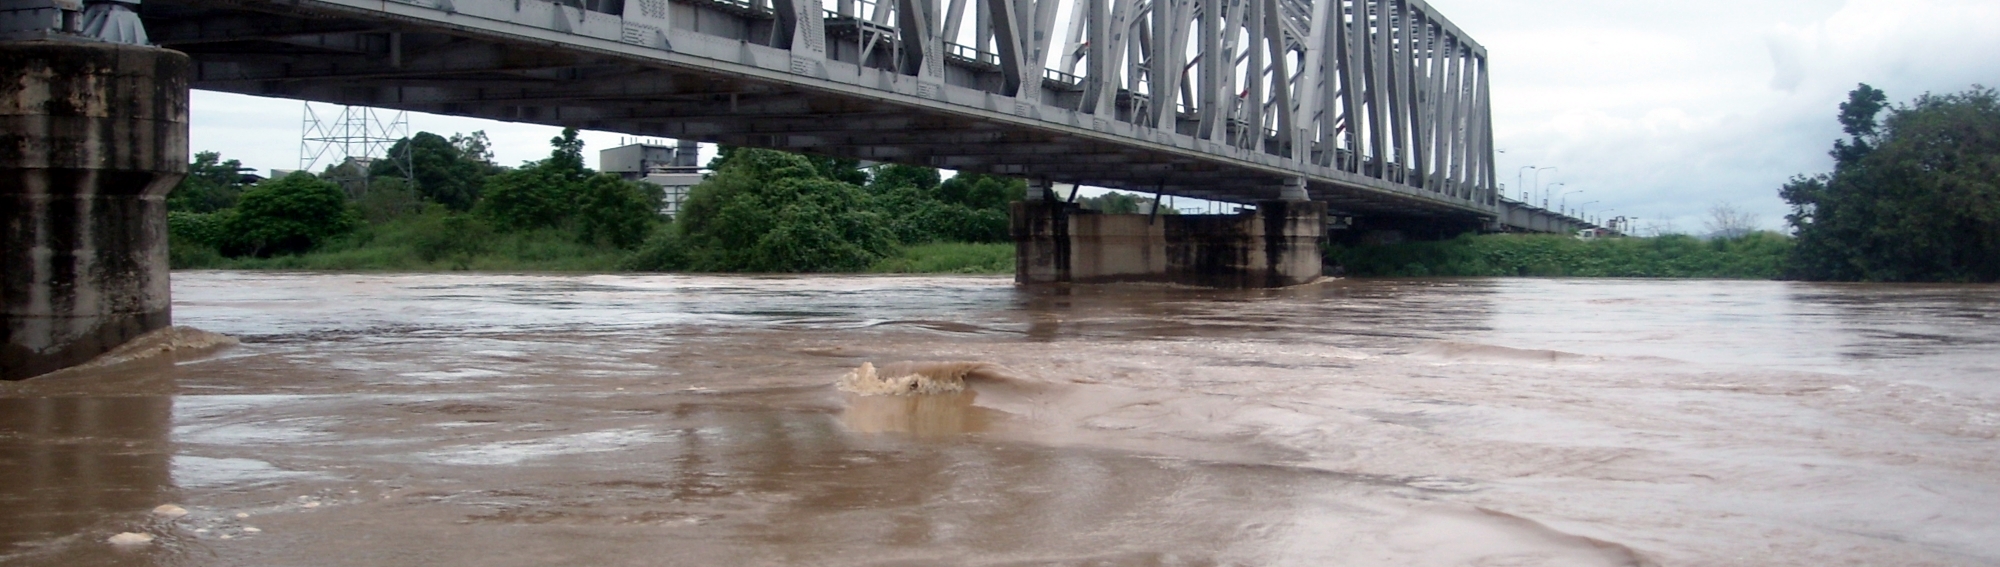
- A total of 730 GL of water was taken from surface water and groundwater resources for consumptive use in the Burdekin region during 2024–25, approximately 10% lower than the previous reporting period, mainly due to decreased irrigation diversions.
| Surface water | 2025 | 2024 | 2023 | 2022 | 2021 | 2020 |
| Individual users | 70,361 | 72,562 | 40,950 | 46,374 | 255,420 | 261,377 |
| Industrial users | 13,706 | 26,301 | 23,706 | 27,383 | 0 | 0 |
| Inter-region supply | 10,857 | 12,700 | 12,700 | 12,700 | 12,539 | 20,108 |
| Irrigation users | 314,857 | 427,859 | 317,508 | 454,195 | 429,153 | 520,330 |
| Other users | 138,167 | 133,790 | 133,165 | 150,153 | 0 | 0 |
| Stock and domestic | 28,372 | 28,408 | 28,426 | 28,426 | 0 | 0 |
| Urban users | 997 | 1,092 | 976 | 1,413 | 1,880 | 2,212 |
| Total | 577,317 | 702,712 | 557,431 | 720,644 | 698,992 | 804,027 |
- Surface water diversions across the Burdekin region during 2024–25 were 577 GL, approximately 20% lower than the previous reporting period, mainly due to decreased diversions to irrigation users.
- Irrigation users (under the Burdekin Haughton Water Supply Scheme) accounted for approximately 55% of total surface water diversions, while other users made up a further 25% of diversions.
- The remaining volume of surface water diversions was distributed across individual, stock and domestic, and industrial users, as well as inter-region supply, while urban users accounted for a relatively small proportion of total diversions.
- Allocated diversions comprised approximately 70% of total surface water diversions, with the remaining volume associated with non-allocated diversions.
| Groundwater | 2025 | 2024 | 2023 | 2022 | 2021 | 2020 |
| Individual users | - | - | - | - | 148,028 | 147,521 |
| Commercial users | 105 | 104 | 104 | 104 | - | - |
| Industrial users | 1,152 | 1,029 | 1,232 | 679 | - | - |
| Irrigation users | 149,551 | 116,291 | 91,022 | 103,720 | - | - |
| Mining users | 140 | 140 | 140 | 556 | - | - |
| Other users | 313 | 447 | 338 | 364 | - | - |
| Stock and domestic | 688 | 648 | 648 | 648 | - | - |
| Urban users | 408 | 300 | 516 | 564 | - | - |
| Total | 152,357 | 118,959 | 94,000 | 106,635 | 148,028 | 147,521 |
- Groundwater extractions across the Burdekin region during 2024–25 were 152 GL, approximately 30% higher than the previous reporting period, likely associated with increased water harvesting for recharge by irrigation users during periods of high flow.
- Nearly all of the groundwater extractions were made by irrigation users, with only a small distribution across industrial, stock and domestic, urban, other, mining, and commercial users.
- As there are no groundwater allocations in the Burdekin region, all groundwater extractions were for non-allocated purposes.
Allocations and diversions
| Surface water | 2025 | 2024 | 2023 | 2022 | 2021 | 2020 |
| Individual users | ||||||
| Carryover | 269,898 | 269,898 | 0 | 159,976 | 108,151 | 119,813 |
| Allocated announcements | 1,140,093 | 1,140,093 | 1,140,093 | 1,140,093 | 1,181,223 | 1,170,327 |
| Allocated diversions | 411,016 | 540,790 | 396,116 | 542,378 | 540,953 | 645,988 |
| % used | 29% | 38% | 35% | 42% | 42% | 50% |
- Total surface water allocations in the Burdekin region during 2024–25 were 1,140 GL, same as recent reporting periods, with an additional 270 GL of water carried over from the previous year.
- Approximately 30% of available surface water allocations were used during the reporting period, around 25% lower than the previous reporting period, mainly due to decreased allocated diversions to irrigation users.
- Despite high allocations, the proportion of allocations used remained relatively low, likely reflecting the extreme conditions in late summer.