


Canberra: Key findings
For the water account period 1 July 2024 to 30 June 2025
- Rainfall in the Canberra region during 2024–25 was below average for the first time since 2019–20.
- Total storage volume in the Canberra region decreased by approximately 6 percentage points during the reporting period, finishing at 91.3% full on 30 June 2025.
- Total water inflows to the Canberra region during 2024–25 were 613 GL, approximately 35% lower than the previous reporting period.
Climate and water
Rainfall

675 mm
15% below the average of 799 mm
Streamflow

well below average
for most of the year
Storage

91.3% full

6.5% less than last year
Water use from all sources
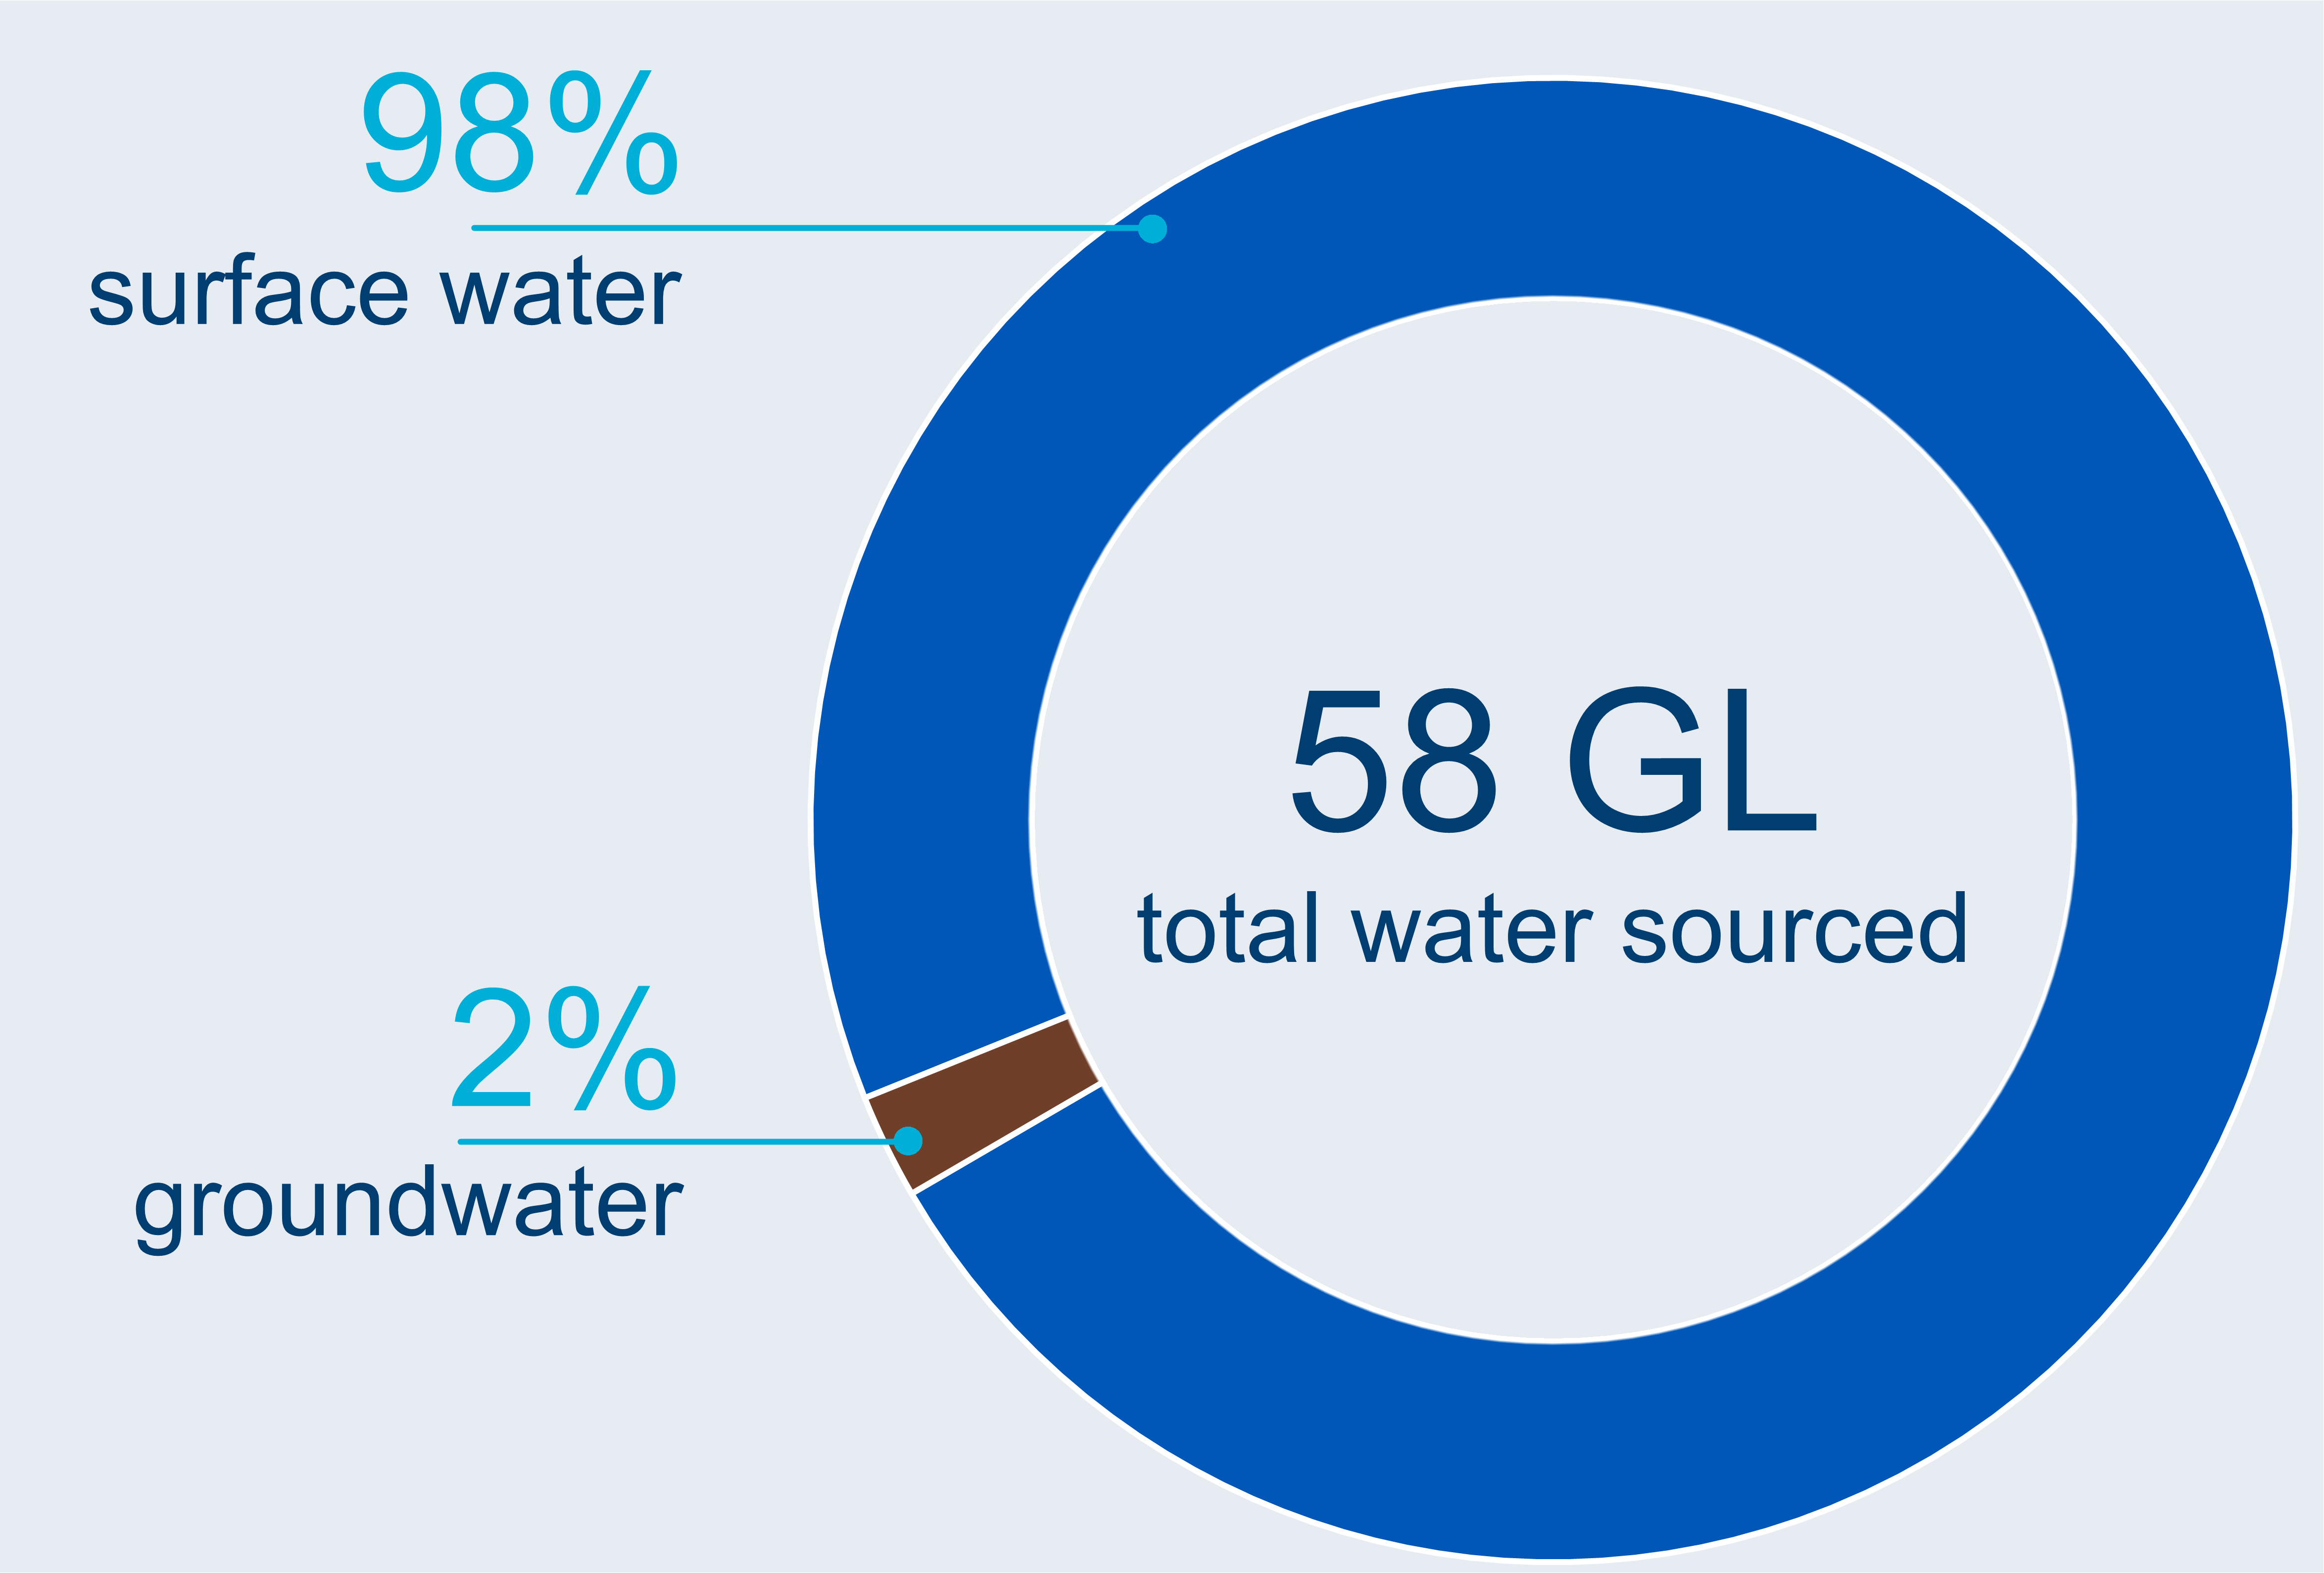
Water sourced
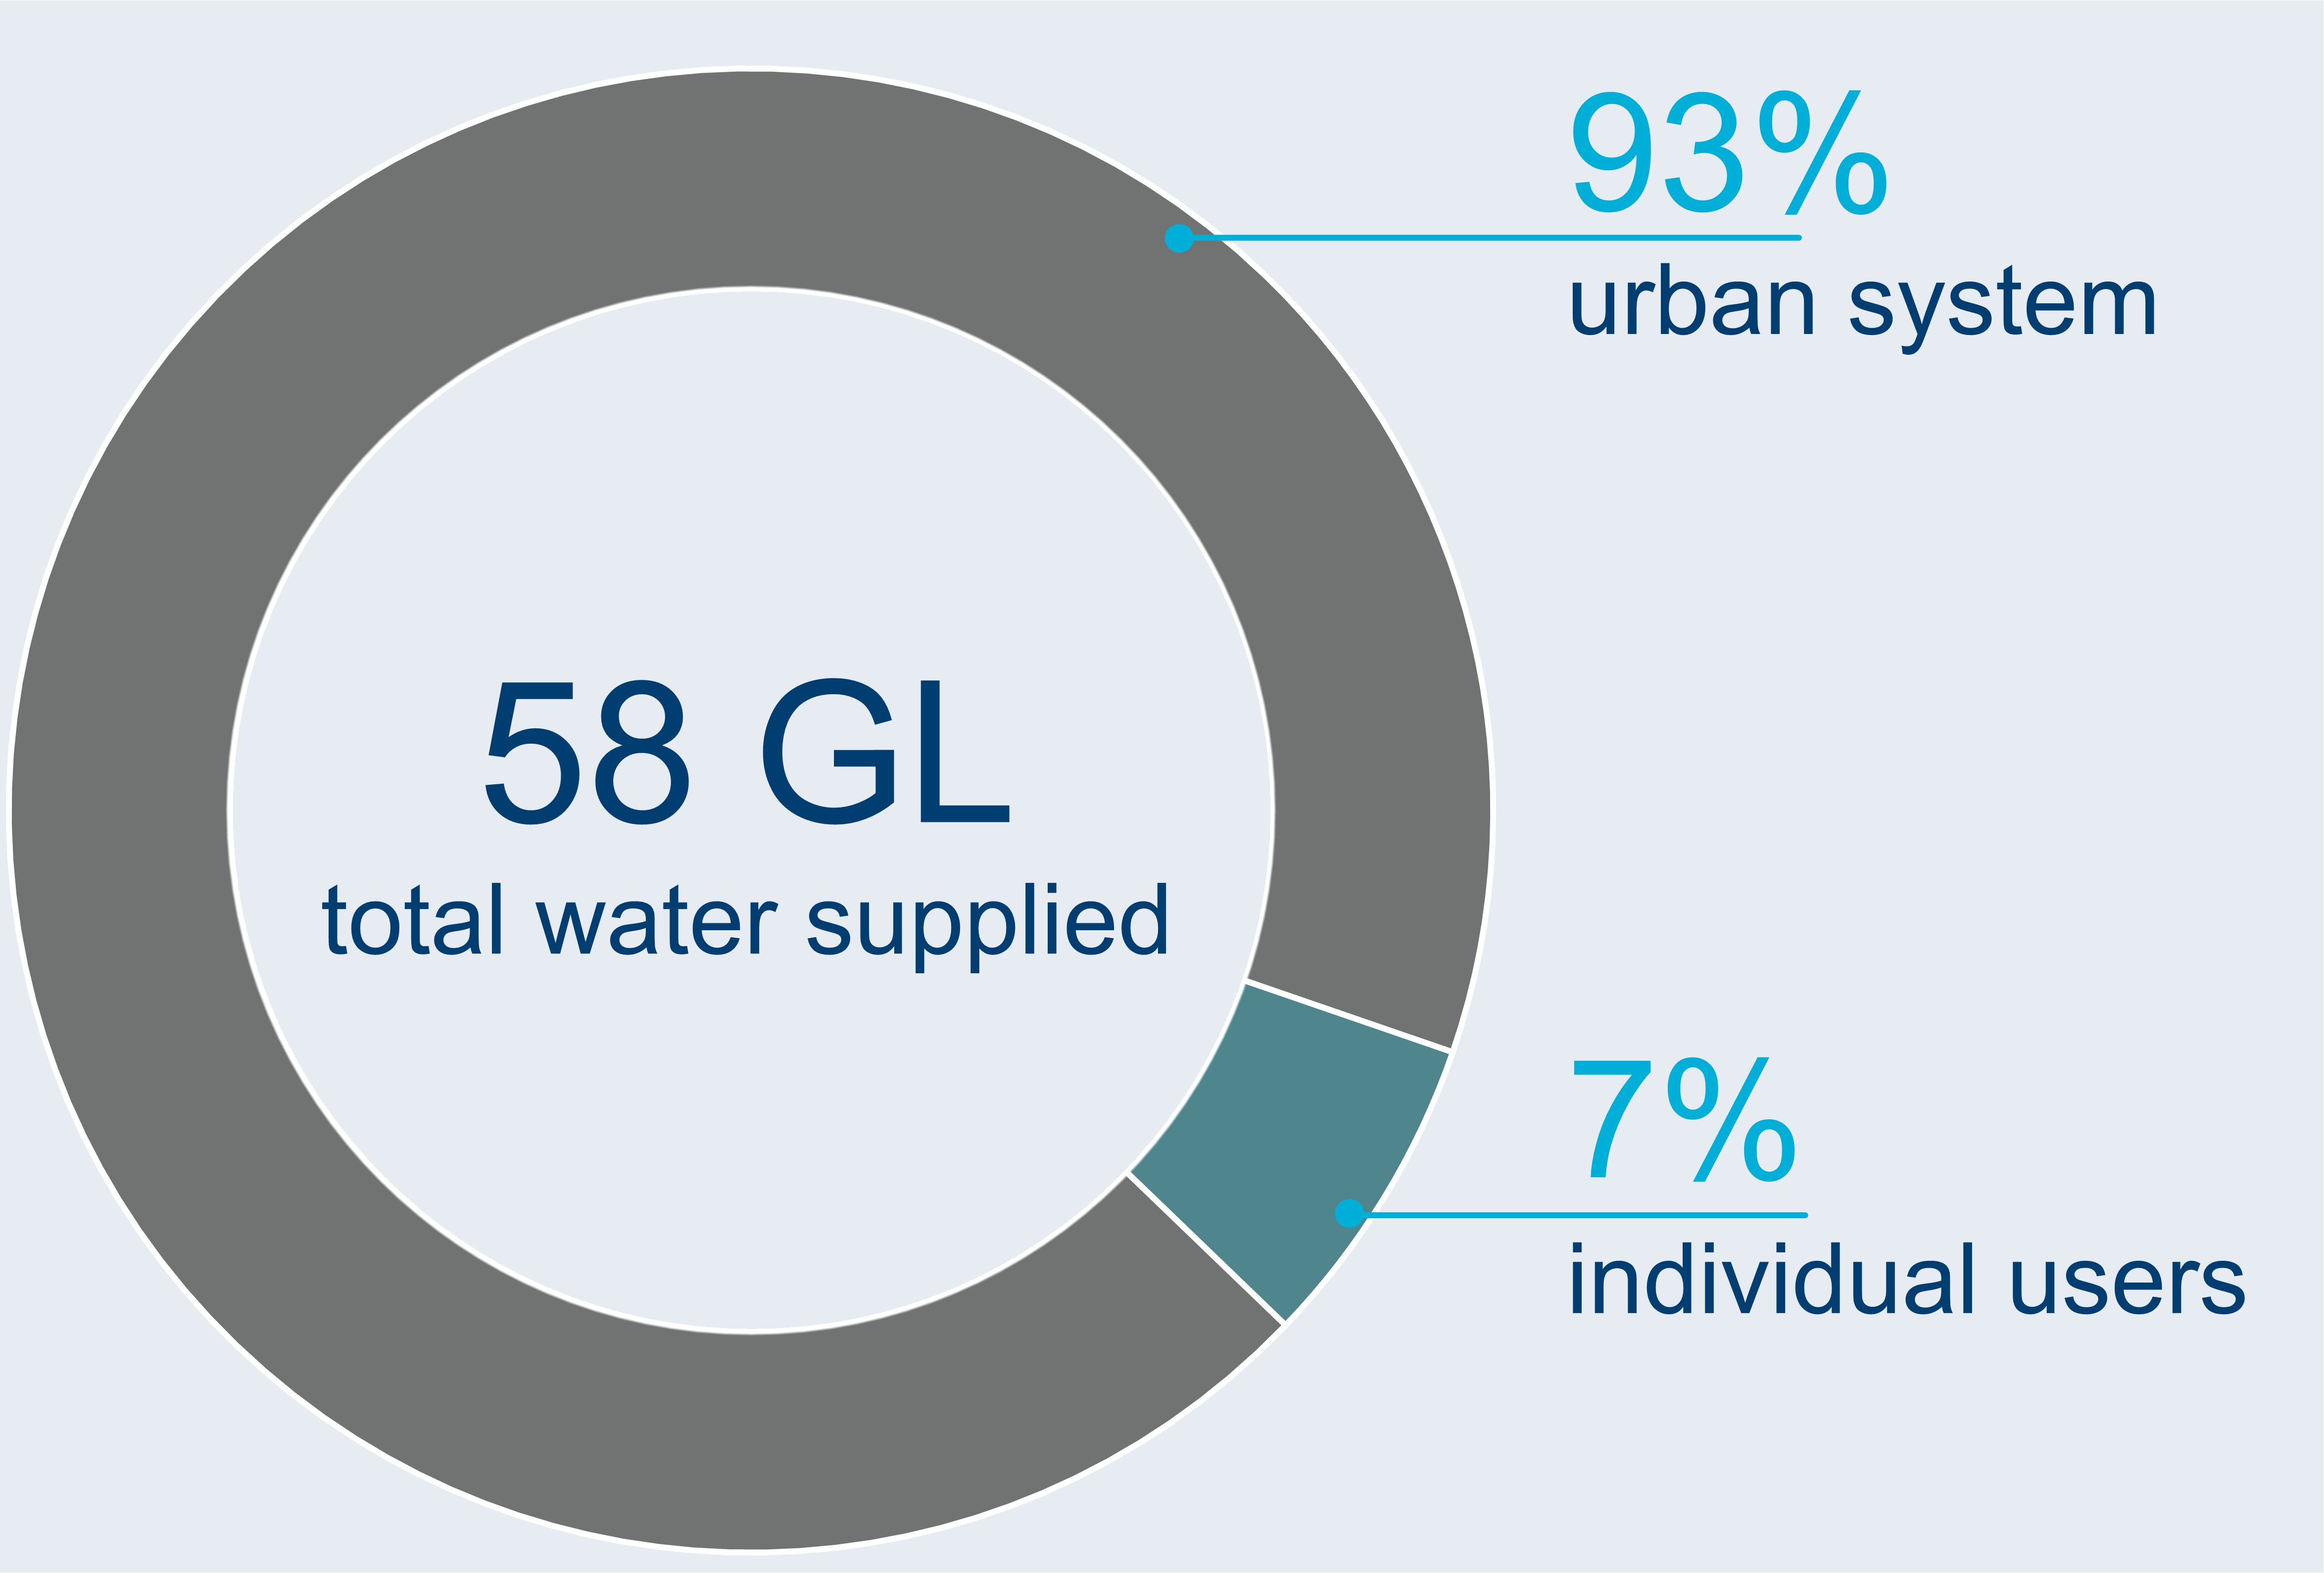
Water supplied
Water status of water resources
Water availability
566 GL
surface water available in 2024–25
23% less than last year
Water accessible
87 GL
total surface water and groundwater accessible in 2024–25

slightly more than last year
Water taken
58 GL
total surface water and groundwater taken 2024-25
6% more than last year