


Canberra: Supporting information
For the water account period 1 July 2024 to 30 June 2025
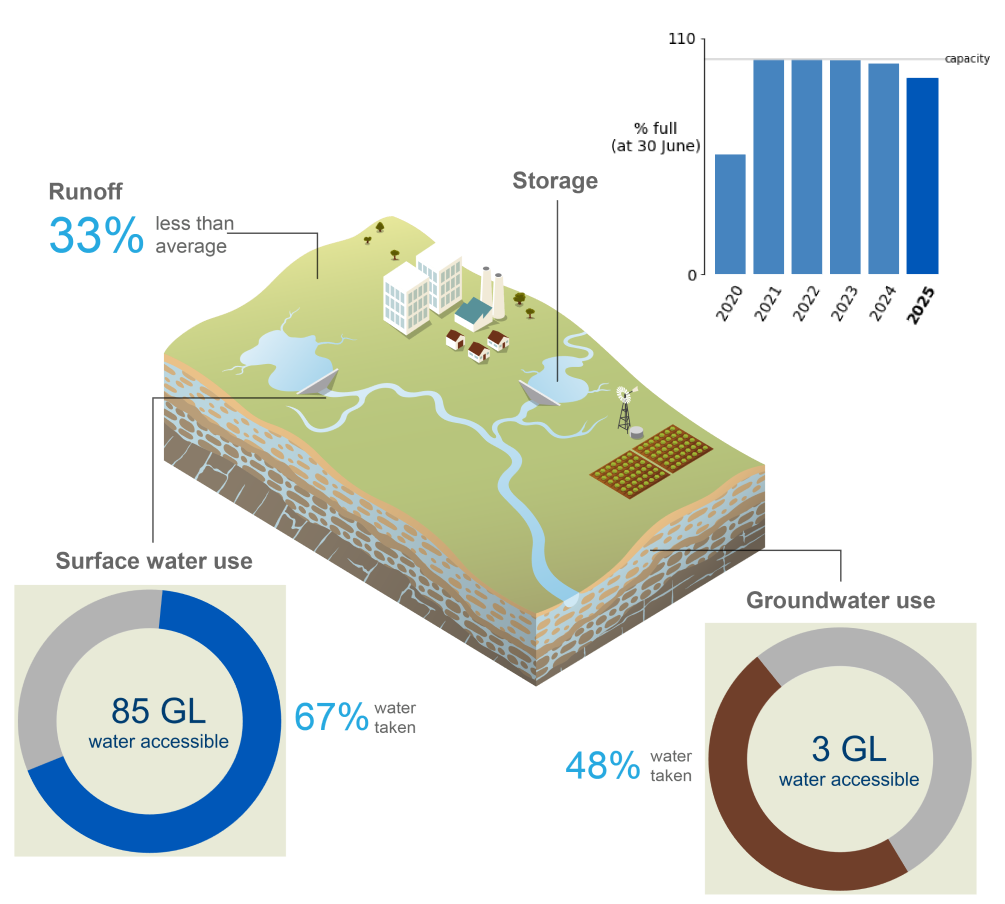
- Total storage volume in the Canberra region decreased by approximately 6 percentage points during the reporting period, finishing at 91.3% full on 30 June 2025.
- Total water inflows to the Canberra region during 2024–25 were 613 GL, approximately 35% lower than the previous reporting period.
- Approximately 65% of surface water and groundwater resources in the Canberra region were taken, mainly for surface water diversions to the urban system.
This section provides a detailed breakdown of water assets, liabilities, flows, availability, and use in the Canberra region over the past six water accounting periods, outlining where water is stored and how it is used across the region.
For further information, scroll down this page or click on the links below:
Water assets
- Total water assets in the Canberra region on 30 June 2025 were 301 GL, approximately 5% lower than the previous reporting period, primarily driven by decreases in surface water assets.
- Just under 85% of the region's water assets were held in accessible water storages, while lakes and wetlands are estimated to contribute less than 15% of the total assets.
- The remaining volume of water assets (approximately 1%) are contained within rivers and the urban water supply system.
- A detailed breakdown of water assets in the Canberra region is available in the Statement of Water Assets and Water Liabilities.
| Surface water | 2025 | 2024 | 2023 | 2022 | 2021 | 2020 |
| Bendora | 9,683 | 10,399 | 11,446 | 11,446 | 11,446 | 9,506 |
| Corin | 48,112 | 65,702 | 69,283 | 70,787 | 70,787 | 30,332 |
| Cotter | 76,197 | 76,197 | 76,197 | 76,197 | 76,197 | 57,488 |
| Googong | 119,351 | 119,409 | 119,409 | 119,409 | 119,409 | 55,439 |
| Accessible total | 253,343 | 271,707 | 276,335 | 277,839 | 277,839 | 152,765 |
| Dead storage | 5,058 | 5,058 | 5,058 | 5,058 | 5,058 | 5,058 |
| Total storage | 258,401 | 279,765 | 281,393 | 282,897 | 282,897 | 157,823 |
| Total capacity | 282,898 | 282,898 | 282,898 | 282,898 | 282,898 | 282,898 |
| % full | 91.3% | 97.8% | 99.5% | 100.0% | 100.0% | 55.8% |
- The total storage volume in the Canberra region decreased slightly more than 6 percentage points during 2024–25, finishing at 91.3% full on 30 June 2025.
- Canberra's total storage volume has remained above 90% full for the past five years, with an average of 98% full over this period, reflecting prolonged wet conditions since 2020.
- Googong Dam, located on the Queanbeyan River, holds approximately 45% of the Canberra region’s total surface water storage, while the remaining volume is held in the Bendora, Corin, and Cotter reservoirs.
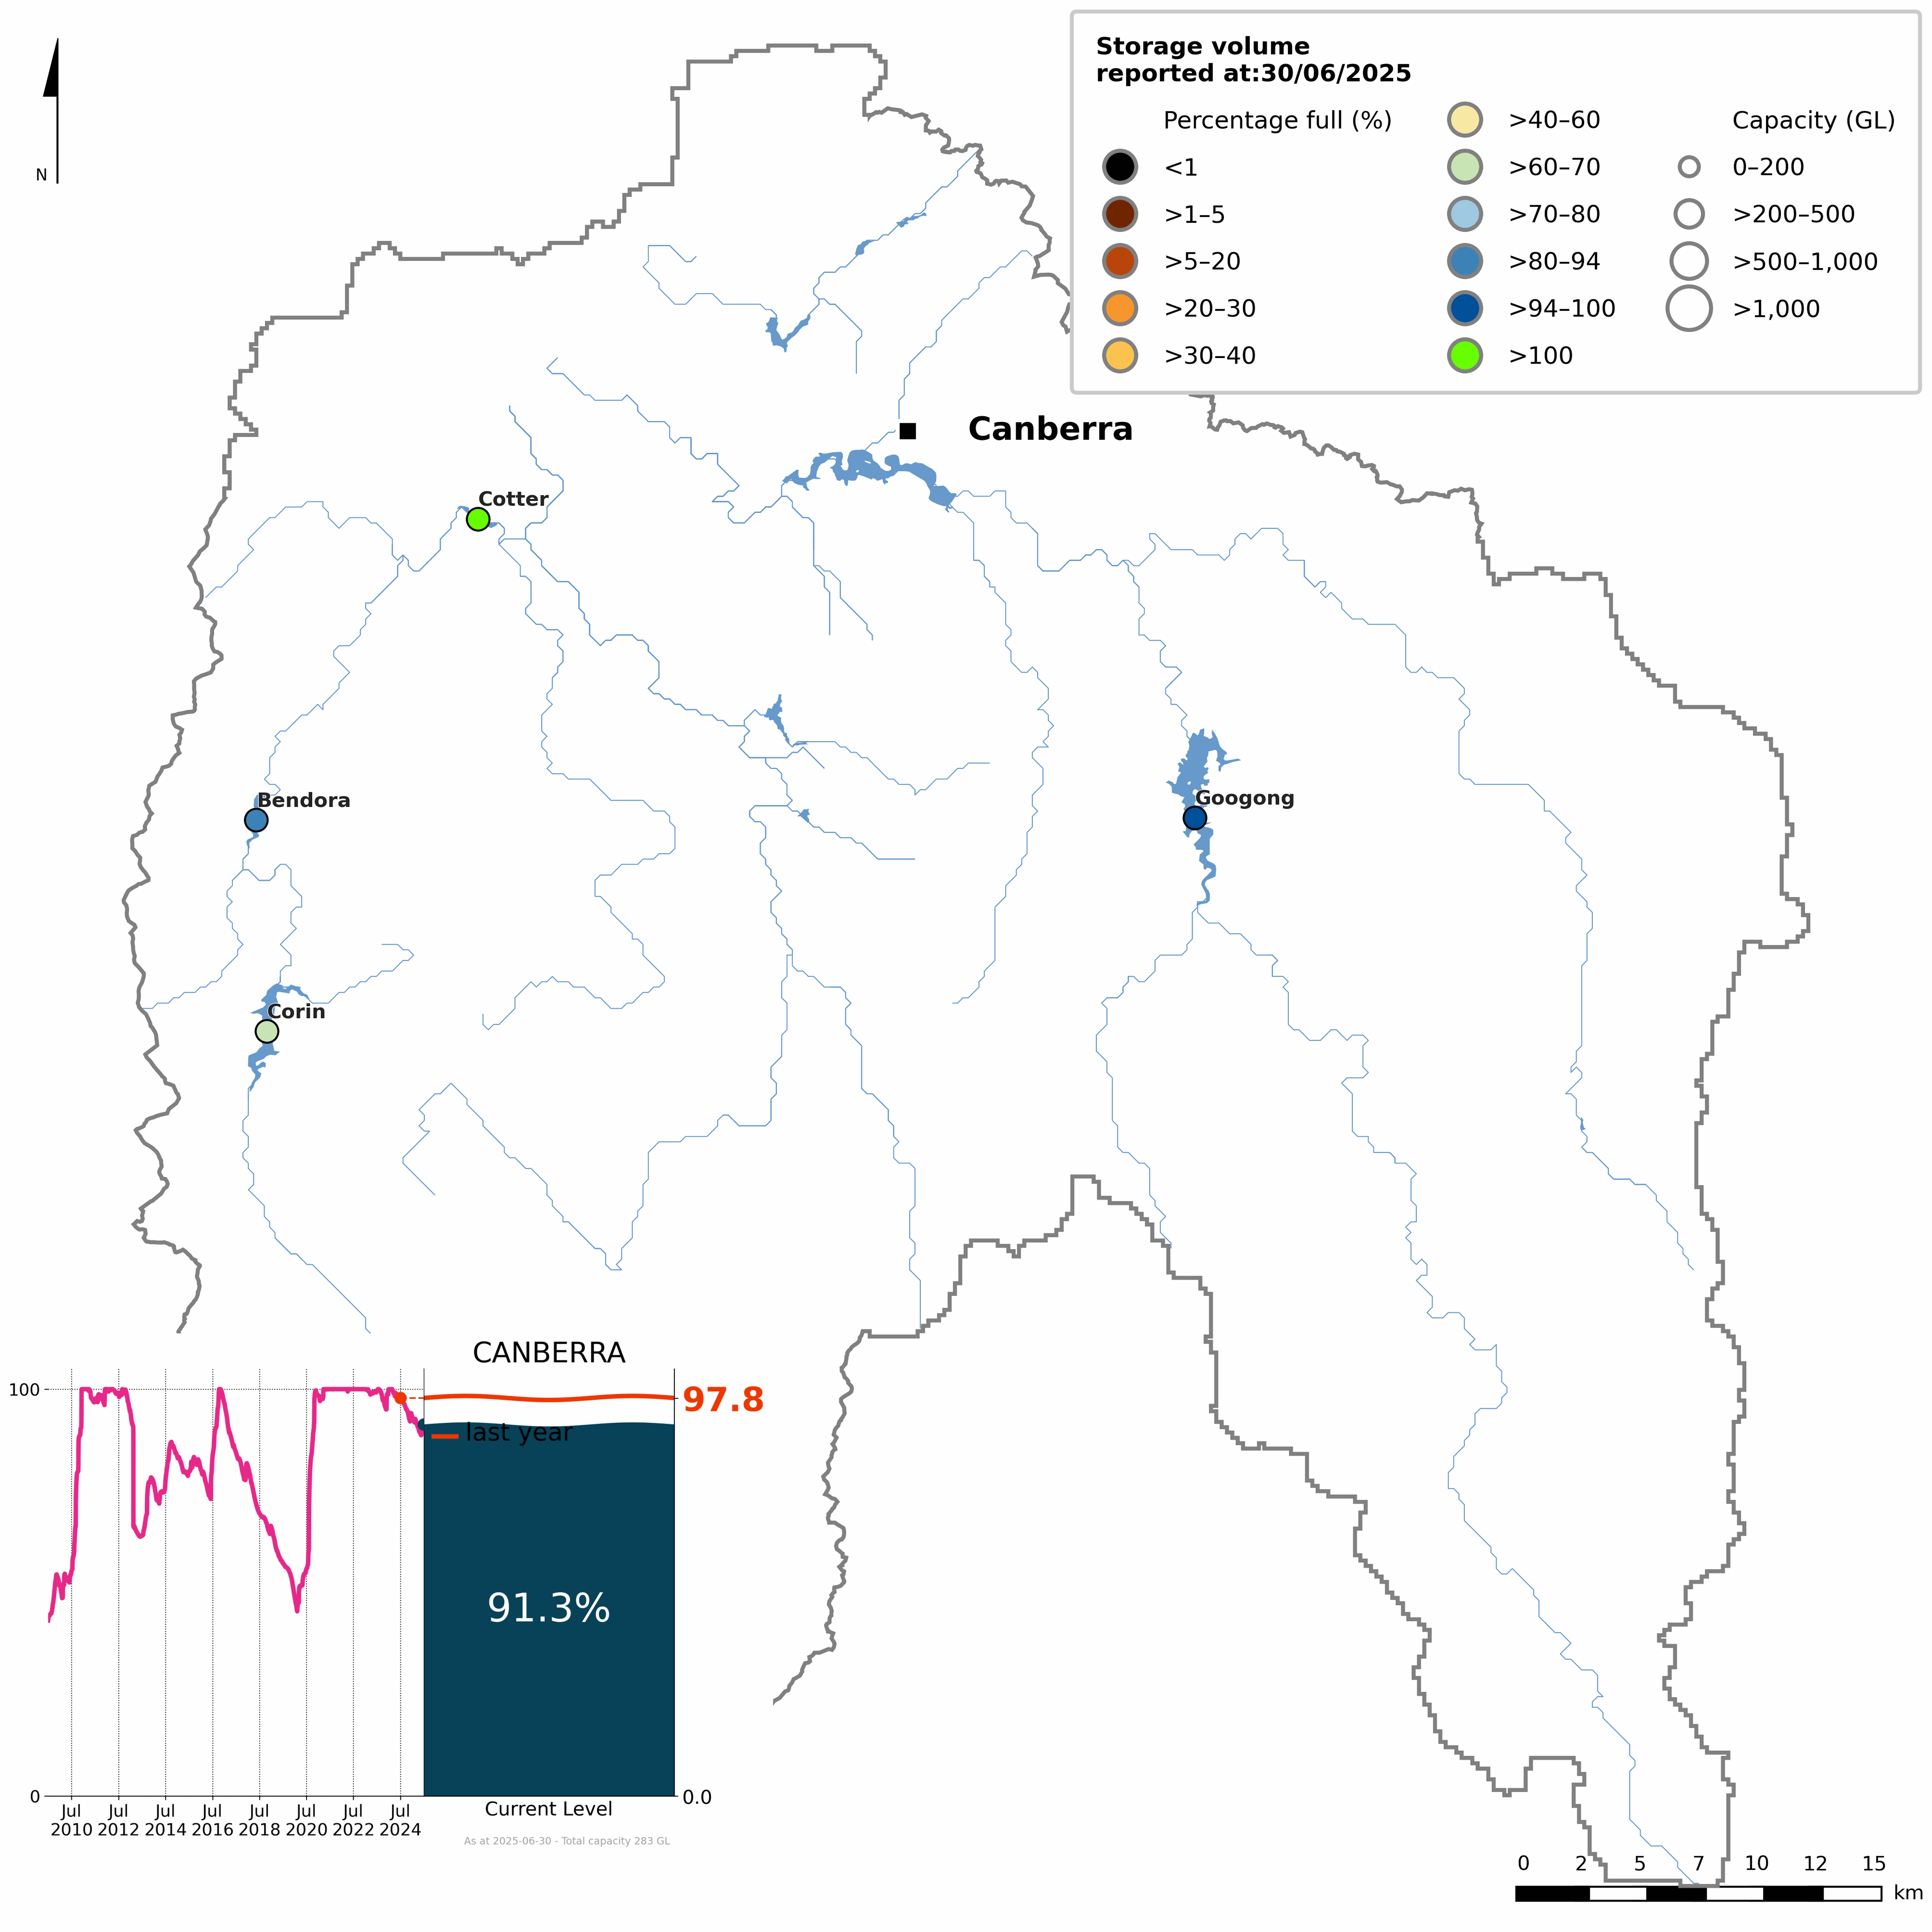
Figure S1 Percentage-full volume on 30 June 2025 for each storage and total daily storage volume since July 2009 (inset)
- The total storage volume in the Canberra region began the 2024–25 reporting period at 97.8% full.
- Storage levels declined steadily through winter and spring, falling to approximately 90% full by late November, due to reduced rainfall that decreased surface water inflows to storages.
- In the first half of December, storage volumes briefly increased, reaching around 95% by mid-December, before resuming a gradual downward trend through summer.
- During mid-February, up to 100 mm of rain fell across parts of the catchments, resulting in a second brief rise in storage levels, before declining again.
- Throughout autumn, storage levels continued to decrease, reaching a low of 89%, before a few rainfall events caused storages to increase and remain above 90% through to the end of the reporting period.
- By 30 June 2025, the total storage volume in the Canberra region was 91.3% full, with only the Corin Reservoir finishing below 80% full.
- More detailed information on individual storages within the Canberra region is available on the Bureau of Meteorology’s Water Information Dashboard.
Water liabilities
- Water liabilities in the Canberra region refer to the volume of allocation remaining on licence entitlements at the end of the reporting period (30 June).
- Licences in the Canberra region do not have carryover provisions for unused allocations. As a result, any remaining allocation is forfeited at the end of the reporting period, and the closing balance is 0 ML for both surface water and groundwater licences.
- A more detailed description of water allocations in the Canberra region is provided in the Water use section.
Surface water liabilities
| Description | 2025 | 2024 | 2023 | 2022 | 2021 | 2020 | |
| Opening balance at 01 July | 0 | 0 | 0 | 0 | 0 | 0 | |
| add | Allocations | 12,994 | 11,991 | 6,870 | 9,250 | 9,255 | 9,253 |
| less | Allocated diversions | 2,075 | 1,818 | 1,341 | 782 | 933 | 2,784 |
| less | Adjustments and forfeitures | 10,919 | 10,173 | 5,529 | 8,468 | 8,322 | 6,469 |
| Closing balance at 30 June | 0 | 0 | 0 | 0 | 0 | 0 | |
| Description | 2025 | 2024 | 2023 | 2022 | 2021 | 2020 | |
| Opening balance at 01 July | 0 | 0 | 0 | 0 | 0 | 0 | |
| add | Entitlements | 71,000 | 71,000 | 71,000 | 71,000 | 71,000 | 71,000 |
| less | Diversions to the urban system | 54,262 | 51,390 | 47,768 | 45,390 | 49,318 | 55,383 |
| less | Adjustments and forfeitures | 16,738 | 19,610 | 23,232 | 25,610 | 21,682 | 15,617 |
| Closing balance at 30 June | 0 | 0 | 0 | 0 | 0 | 0 | |
- Surface water allocations for individual users in the Canberra region during 2024–25 were 13 GL, approximately 10% higher than the previous reporting period, and the highest volume since the account commenced in 2010–11.
- A little over 15% (2 GL) of surface water allocations for individual users were diverted during the reporting period, with the remaining volume forfeited on 30 June 2025 due to the absence of carryover provisions.
- Urban system entitlements remained unchanged at 71 GL, consistent with all previous reporting periods.
- Approximately 75% (54 GL) of urban system entitlements were delivered to the urban system during the reporting period, with no water carried over into the next account in accordance with licence conditions.
Groundwater liabilities
| Description | 2025 | 2024 | 2023 | 2022 | 2021 | 2020 | |
| Opening balance at 01 July | 0 | 0 | 0 | 0 | 0 | 0 | |
| add | Allocations | 2,353 | 2,342 | 2,342 | 4,651 | 4,698 | 2,448 |
| less | Allocated extractions | 898 | 639 | 453 | 319 | 549 | 1,064 |
| less | Adjustments and forfeitures | 1,455 | 1,703 | 1.889 | 4,332 | 4,149 | 1,384 |
| Closing balance at 30 June | 0 | 0 | 0 | 0 | 0 | 0 | |
- Groundwater allocations for individual users in the Canberra region during 2024–25 were 2 GL, broadly consistent with recent reporting periods, though lower than the elevated allocations reported between 2021–22 and 2022–23.
- Less than 1 GL of groundwater allocations were extracted during the reporting period, the highest since 2019–20, with no water carried over into the next account due to the absence of carryover provisions.
Water flows
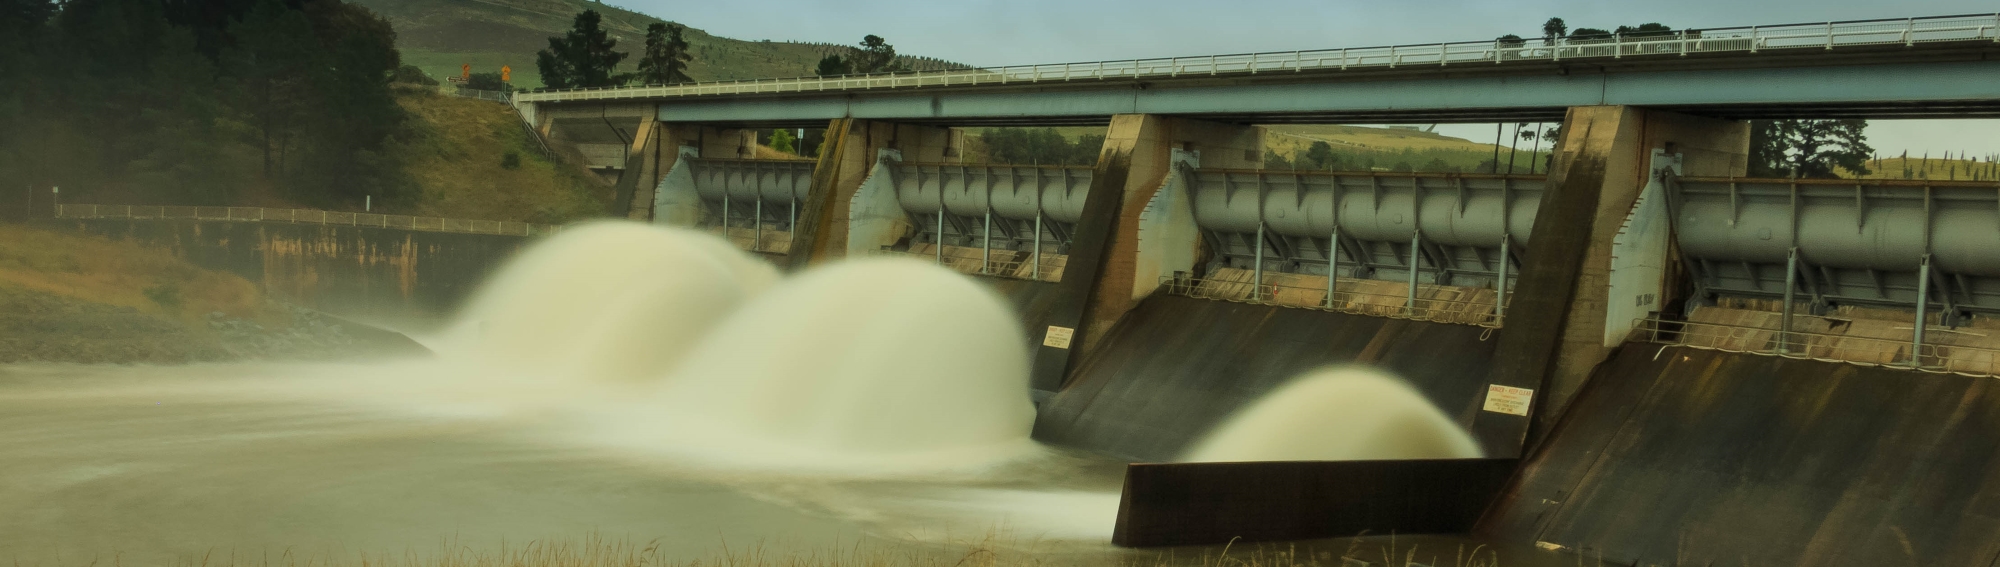
- Water flows in the Canberra region describe the movement of water between surface water, groundwater, and the urban system.
- A summary of total inflows and outflows for each water store is provided below.
- For a detailed breakdown of inflows and outflows in the Canberra region, refer to the Statement of Changes in Water Assets and Water Liabilities.
| Water inflows | 2025 | 2024 | 2023 | 2022 | 2021 | 2020 |
| Surface water inflows | 466,706 | 807,479 | 1,647,848 | 2,127,640 | 1,129,253 | 250,877 |
| Groundwater inflows | 53,055 | 66,564 | 92,427 | 99,465 | 67,521 | 37,551 |
| Urban system inflows | 93,634 | 92,981 | 96,797 | 95,271 | 97,408 | 94,593 |
| Total water inflows | 613,395 | 967,024 | 1,837,072 | 2,322,376 | 1,294,182 | 383,021 |
- Total water inflows to the Canberra region during 2024–25 were 613 GL, approximately 35% lower than the previous reporting period, and the lowest since 2019–20, reflecting reduced surface water inflows.
- Surface water inflows accounted for around 75% (467 GL) of total inflows, approximately 40% less compared to the previous reporting period, largely driven by reduced runoff.
- Groundwater inflows contributed about 10% (53 GL) of total inflows, representing a 20% decrease from the previous reporting period, with groundwater recharge being the largest contributor at near 95% of the groundwater inflows.
- Urban system inflows made up 15% (94 GL) of total inflows, consisting of surface water diversions for distribution to customers and and returned flows from wastewater collected.
| Water outflows | 2025 | 2024 | 2023 | 2022 | 2021 | 2020 |
| Surface water outflows | 448,996 | 831,157 | 2,164,542 | 2,961,593 | 1,395,351 | 284,111 |
| Groundwater outflows | 1,332 | 1,073 | 887 | 753 | 983 | 1,499 |
| Urban system outflows | 93,469 | 96,503 | 94,996 | 90,005 | 90,588 | 89,808 |
| Total water outflows | 543,797 | 928,733 | 2,260,425 | 3,052,351 | 1,486,922 | 375,418 |
- Total water outflows from the Canberra region during 2024–25 were 544 GL, around 40% lower than the previous reporting period, and the lowest since 2019–20, reflecting reduced surface water outflows across the region.
- Surface water outflows comprised almost 85% (449 GL) of total outflows, declining by just over 45% compared to the previous reporting period, largely influenced by river outflows.
- Groundwater outflows accounted for less than 1% of total outflows, increasing slightly compared to the previous reporting period, while remaining a minor component of the region's overall water balance.
- Urban system outflows represent approximately 15% (94 GL) of total outflows, broadly consistent with previous reporting periods.
Water availability
| Surface water | 2025 | 2024 | 2023 | 2022 | 2021 | 2020 |
| Water availability | 566,229 | 734,664 | 1,171,342 | 1,151,877 | 777,516 | 325,975 |
| Water accessible | 84,622 | 83,486 | 78,365 | 80,745 | 80,750 | 80,748 |
| Water taken | 56,965 | 53,703 | 49,604 | 46,667 | 50,746 | 58,662 |
| % water accessible taken | 67% | 64% | 63% | 58% | 63% | 73% |
- Surface water availability in the Canberra region during 2024–25 was 566 GL, around 25% lower than the previous reporting period, and less than half the volume observed during the high availability years of 2021–22 and 2022–23.
- The decline in water availability across the Canberra region was heavily influenced by runoff, which was a little over 65% lower than the volume reported in 2022–23, and 30% below the long-term average of 415 GL.
- Despite the decrease in water availability, the volume of water accessible for take in the Canberra region remained relatively stable at 85 GL, the highest volume reported since the account commenced in 2010–11.
- Water taken from surface water resources in the Canberra region increased to 57 GL during 2024–25, a little over 5% higher than the previous reporting period, and the highest since 2019–20.
- Overall, approximately 65% of surface water accessible for take in the Canberra region was taken during the reporting period, mainly for supply to the urban system.
Water use
Consumptive use
- A total of 58 GL of water was taken from surface water and groundwater resources for consumptive use in the Canberra region during 2024–25, a little over 5% higher than the previous reporting period, and the highest since 2019–20.
| Surface water | 2025 | 2024 | 2023 | 2022 | 2021 | 2020 |
| Individual users | - | 1,818 | 1,341 | 782 | 933 | 2,784 |
| Agriculture users | 616 | - | - | - | - | - |
| Commercial users | 0 | - | - | - | - | - |
| Industrial users | 54 | - | - | - | - | - |
| Irrigation users | 1,405 | 0 | - | - | - | - |
| Statutory rights | 628 | 495 | 495 | 495 | 495 | 495 |
| Urban system | 54,262 | 51,390 | 47,768 | 45,390 | 49,318 | 55,383 |
| Total | 56,965 | 53,703 | 49,604 | 46,667 | 50,746 | 58,662 |
- Surface water diversions in the Canberra region during 2024–25 were 57 GL, a little over 5% higher than the previous reporting period, and the highest since 2019–20, reflecting increased diversions to the urban system.
- Approximately 95% of surface water diversions were to the urban system, slightly higher than the previous reporting period, and the highest since 2019–20.
- Individual users accounted for nearly 4% (2 GL) of surface water use in the Canberra region, primarily from irrigation users (<1 GL), followed by agricultural users (>1 GL), with minor contributions from industrial users.
- Users with statutory rights accounted less than 1 GL of surface water diversions.
| Groundwater | 2025 | 2024 | 2023 | 2022 | 2021 | 2020 |
| Individual users | - | 639 | 453 | 319 | 549 | 1,064 |
| Agriculture users | 81 | - | - | - | - | - |
| Commercial users | 92 | - | - | - | - | - |
| Industrial users | 0 | - | - | - | - | - |
| Irrigation users | 725 | - | - | - | - | - |
| Statutory rights | 434 | 434 | 434 | 434 | 434 | 435 |
| Total | 1,332 | 1,073 | 887 | 753 | 983 | 1,499 |
- Groundwater extractions in the Canberra region during 2024–25 were a little over 1 GL, approximately 25% higher than the previous reporting period, and the highest since 2019–20.
- Approximately 65% (< 1 GL) of total groundwater extractions were made by individual users, primarily from irrigation users, with commercial and agricultural users accounting for a minor component.
- Users with statutory rights represented a little over 30% of groundwater extractions, consistent with volumes reported in previous reporting periods.
Allocations and diversions
| Surface water | 2025 | 2024 | 2023 | 2022 | 2021 | 2020 |
| Individual users | ||||||
| Carryover | 0 | 0 | 0 | 0 | 0 | 0 |
| Allocated announcements | 12,994 | 11,991 | 6,870 | 9,250 | 9,255 | 9,253 |
| Allocated diversions | 2,075 | 1,818 | 1,341 | 782 | 933 | 2,784 |
| % used | 16% | 15% | 20% | 8% | 10% | 30% |
| Urban users | ||||||
| Carryover | 0 | 0 | 0 | 0 | 0 | 0 |
| Allocated entitlements | 71,000 | 71,000 | 71,000 | 71,000 | 71,000 | 71,000 |
| Allocated diversions | 54,262 | 51,390 | 47,768 | 45,390 | 49,318 | 55,383 |
| % used | 76% | 72% | 67% | 64% | 69% | 78% |
| Total | ||||||
| Carryover | 0 | 0 | 0 | 0 | 0 | 0 |
| Allocations | 83,994 | 82,991 | 77,870 | 80,250 | 80,255 | 80,253 |
| Allocated diversions | 56,337 | 53,208 | 49,109 | 46,172 | 50,251 | 58,167 |
| % used | 67% | 64% | 63% | 58% | 63% | 72% |
- Total surface water allocations in the Canberra region during 2024–25 were 84 GL, slightly higher than the previous reporting period, with no water carried over from the previous account due to the absence of carryover provisions.
- Surface water allocations for individual users were 13 GL, the highest since the account commenced in 2010–11, though only around 15% of these allocations were diverted during the reporting period.
- Urban system entitlements remained unchanged at 71 GL, with about 75% (54 GL) of these entitlements delivered to the urban system, the highest since 2019–20.
- Overall, approximately 65% (56 GL) of total allocated surface water was diverted during 2024–25, nearly 5% higher than the previous reporting period, mainly driven by increased diversions to the urban system.
| Groundwater | 2025 | 2024 | 2023 | 2022 | 2021 | 2020 |
| Individual users | ||||||
| Carryover | 0 | 0 | 0 | 0 | 0 | 0 |
| Allocated announcements | 2,353 | 2,342 | 2,342 | 4,651 | 4,698 | 2,448 |
| Allocated extractions | 898 | 639 | 453 | 319 | 549 | 1,064 |
| % used | 38% | 27% | 19% | 7% | 12% | 43% |
- Total groundwater allocations in the Canberra region during 2024–25 were just over 2 GL, similar to recent reporting periods, with no water carried over from the previous account due to the absence of carryover provisions.
- Approximately 40% was extracted during the reporting period, primarily by irrigation users.
Urban supply system
| Water sources | 2025 | 2024 | 2023 | 2022 | 2021 | 2020 |
| Surface water | 54,262 | 51,390 | 47,768 | 45,390 | 49,318 | 55,383 |
| Total urban water supplied | 54,262 | 51,390 | 47,768 | 45,390 | 49,318 | 55,383 |
- A total of 54 GL of water was sourced to Canberra’s urban supply system during 2024–25, around 5% higher than the previous reporting period, and the highest since 2019–20.
- All water supplied to the urban system was sourced from surface water.
| Supply of drinking water | 2025 | 2024 | 2023 | 2022 | 2021 | 2020 |
| Residential customers | 38,794 | 36,360 | 33,819 | 33,528 | 35,636 | 39,171 |
| Commercial & industrial customers | 11,901 | 15,147 | 9,554 | 8,716 | 10,425 | 12,138 |
| Agricultural & irrigation customers | 4 | 0 | 0 | 0 | 0 | 0 |
| Other customers | 275 | 64 | 74 | 52 | 0 | 0 |
| Total drinking water used | 50,974 | 51,571 | 43,447 | 42,296 | 46,061 | 51,309 |
- A total of 51 GL of drinking water (excluding recycled water) was supplied to urban customers in the Canberra region during 2024–25, slightly lower than the previous reporting period, but higher than volumes observed from 2020–21 to 2022–23.
- Residential customers accounted for approximately 75% (39 GL) of total drinking water supplied, with commercial and industrial customers comprising a little over 20%.
- Other customers represented less than 1% of total supply, while a negligible volumes provided to agricultural and irrigation customers during the reporting period.
Water restrictions
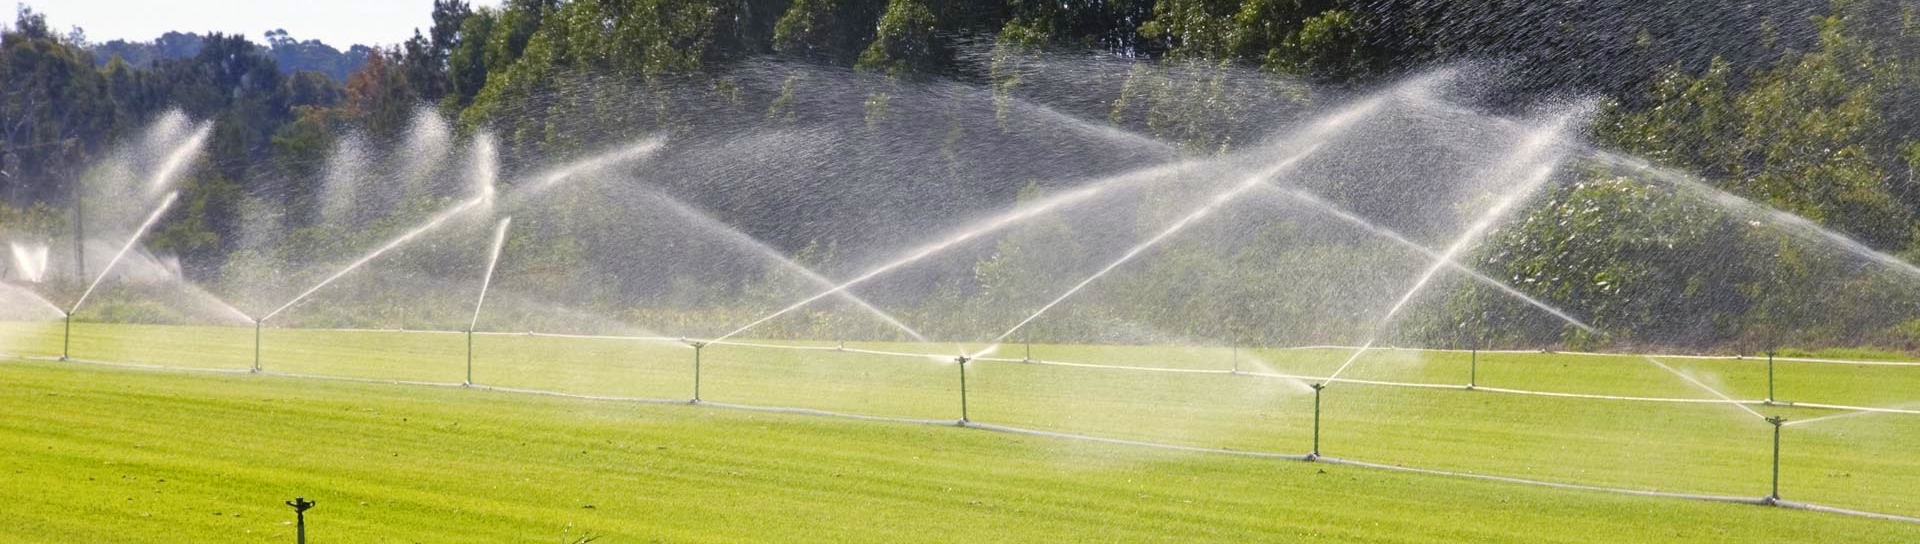
- Icon Water introduced permanent water conservation measures for potable water use in November 2010, which govern how water can be used for gardens and lawns, as well as for pool filling, car washing, and cleaning.
- From September to May, sprinklers and other irrigation systems, including drip irrigation, may only be used to water lawns and plants between 6 pm and 9 am. During the winter months, these systems may be used at any time.
- A hand-held hose fitted with a trigger nozzle, a bucket, or a watering can may be used to water lawns and plants at any time, provided watering does not cause pooling or runoff.
- Pools and spas with a capacity of 3,000 litres or more must not be emptied or refilled without written exemption from Icon Water.
- For more information, refer to the Bureau of Meteorology's Water Restrictions website.