


Canberra: Climate and water
For the water account period 1 July 2024 to 30 June 2025
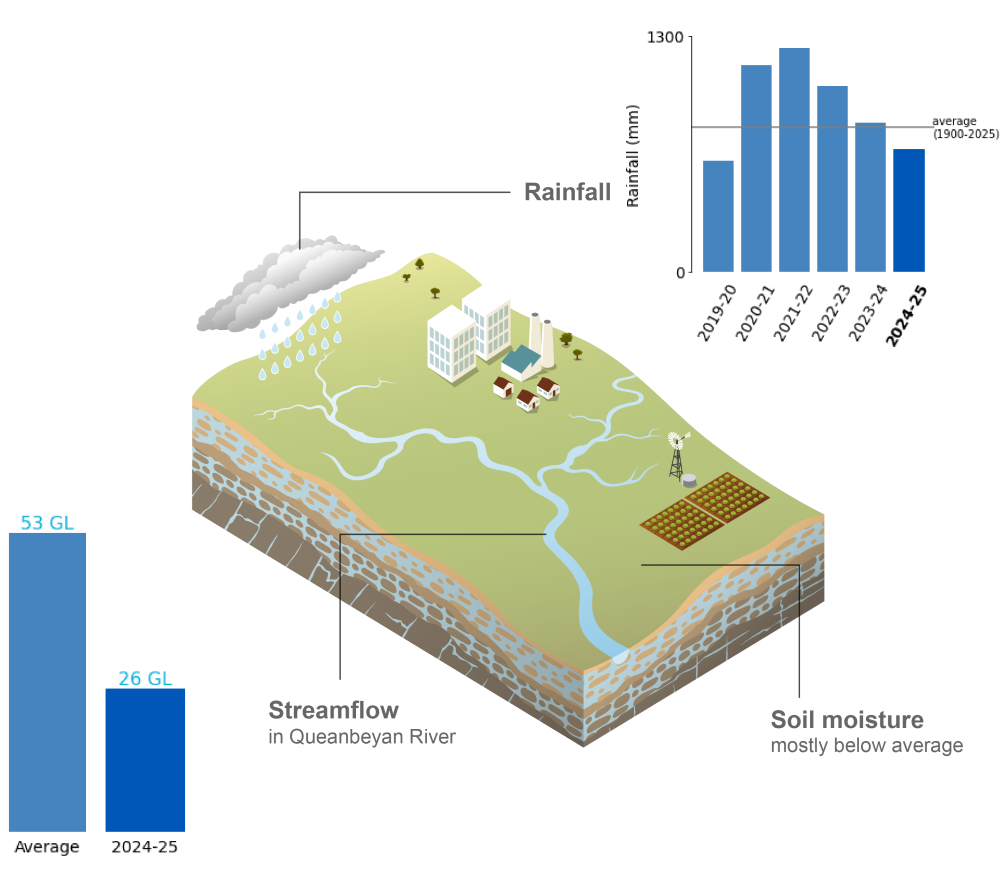
- Rainfall in the Canberra region during 2024–25 was below average for the first time since the 2019–20.
- Soil moisture in the root zone (0–1 m depth) was below average with areas of very much below-averagee across much of the region.
- Streamflows across the region were well below average for 2024–25.
For further information on the climate and water conditions across the Canberra region during the current reporting period, scroll down this page or click on the links below:
About the region
- The Canberra region experiences a subtropical highland climate, characterised by cool to cold winters and mild to warm summers.
- Rainfall is relatively uniform throughout the year, with long-term monthly averages typically ranging from 50 to 75 mm. Higher totals are more common between October and February due to increased thunderstorm activity.
- Streamflows in the Canberra region are generally higher during winter and spring, driven by increased runoff from wetter catchments and, in some years, snowmelt from the region’s highlands. Flows in the Murrumbidgee River can also be influenced by diversions from the Snowy Mountains Scheme.
Climate conditions
Rainfall
Figure C1 Annual and monthly rainfall deciles for the Canberra region during the 2024–25 reporting period
- Total area-averaged rainfall in the Canberra region during 2024–25 was below the long-term average, with approximately 675 mm recorded, around 15% below the long-term average of 799 mm. This represented a return to drier-than-average conditions following several relatively wetter reporting periods.
- Rainfall during July to October was well below average, reflecting an extended dry period. No strongly persistent large-scale climate drivers were evident during this time.
- During December, a series of low-pressure troughs contributed to widespread rainfall and storm activity, with weekly totals of 25 to 50 mm recorded across much of the region. Despite these events, rainfall for the month was generally near to below average when compared with long-term conditions.
- Rainfall during February was influenced by several cold fronts which delivered up to 100 mm of rain to the region. As a result, February rainfall was above-average, contributing to summer rainfall being above the long-term seasonal average.
- Rainfall during autumn was mixed, with below-average conditions in March and April followed by above-average in May, when a coastal trough and upper low combined with moist onshore flow to deliver periods of moderate to locally heavy rainfall across the region.
- Further information on Australia’s climate and water during the 2024–25 reporting period can be found in the Financial Year Climate and Water Statement 2024–25.
Figure C2 Total monthly rainfall for the Canberra region during the 2024–25 reporting period, compared with the average and percentiles for the region
- No months during the reporting period experieced rainfall ranked above the 90th percentile or below the 10th percentile during the reporting period, rainfall was notably below average from July to October.
- Rainfall was above average from December to February, and again in May, though it remained well below the 90th percentile.
Actual evapotranspiration
Figure C3 Annual and monthly actual evapotranspiration for the Canberra region during the 2024–25 reporting period
- Total area-averaged actual evapotranspiration was generally near average across most of the Canberra region during 2024–25, consistent with overall pattern of rainfall and water availability throughout the reporting period.
- Evapotranspiration was below average in July, reflecting drier conditions leading into the winter period.
- During winter and spring, evapotranspiration remained below-average, particularly through spring, as cooler temperatures and generally dry conditions reduced evaporative demand.
- Following increased rainfall in late November and early December, evapotranspiration increased to above average across much of the region, before returning to near-average conditions through to April.
- After high rainfall in late May, evapotranspiration across the upper catchments was above to very much above average, while the lower areas of the region remained near average.
- By June, evapotranspiration returned to average levels, as cooler and drier conditions limited the evaporative potential across the region.
Soil moisture
Figure C4 Annual and monthly soil moisture deciles for the Canberra region during the 2024–25 reporting period
- Total area-averaged soil moisture in the root zone (0–1 m depth) was below average with areas of very much below-average across the Canberra region during 2024–25, reflecting the dry conditions experienced during the early part of the reporting period.
- In response to below-average rainfall through winter and spring, soil moisture was below average across much of the region during winter, before declining to very much below average in spring.
- Increased rainfall from late November to early December contributed to an increase in soil moisture, with conditions becoming average to above average across the region.
- Soil moisture remained predominantly average during summer, supported by above-average rainfall and near-average evapotranspiration.
- During autumn, soil moisture decreased slightly, but remained close to average, as moisture from summer rainfall gradually moved through the soil profile.
- Following the rain event in late May, soil moisture was mostly average across the region, with above-average conditions persisting in the upper parts of the Queanbeyan and Molonglo catchments into June, supported by cooler conditions that reduced moisture loss.
- Further information on soil moisture conditions across the Canberra region during the 2024–25 reporting period is available on the Australian Water Outlook.
Streamflow responses
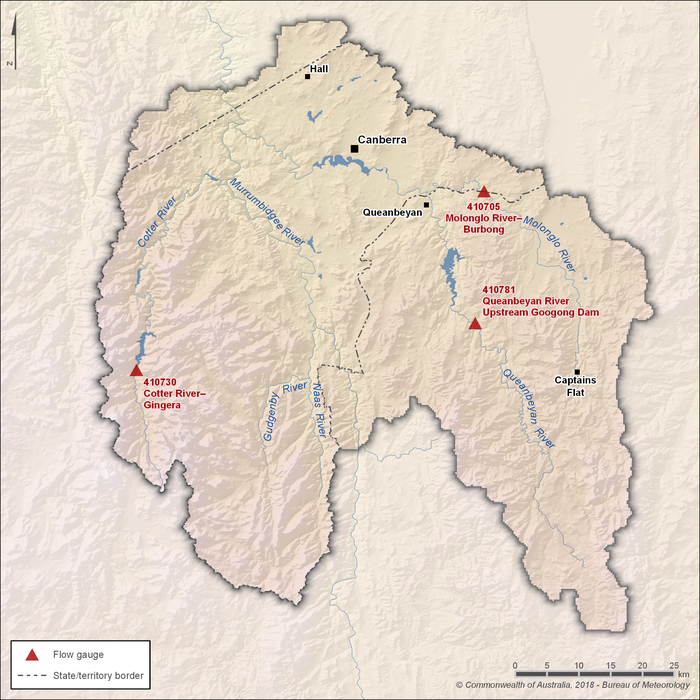
Figure C5 Key flow gauging stations along the main rivers within the Canberra region
- Within the Canberra region, five main river catchments form the streamflow network. Four of these—the Cotter, Gudgenby, Molonglo, and Queanbeyan—feed into the Murrumbidgee River catchment.
- The Cotter and Queanbeyan rivers supply the majority of inflows into Canberra's surface water storages. As a result, streamflows upstream of these storages are monitored at two key gauging stations: Cotter River at Gingera (Station 410730) and Queanbeyan River upstream of Googong Dam (Station 410781).
- Flows in the Molonglo River, a major tributary of the Murrumbidgee River, pass through Canberra, where Scrivener Dam impounds the river to form Lake Burley Griffin. Streamflows upstream of Lake Burley Griffin are monitored at the Molonglo River at Burbong gauging station (Station 410705).
Figure C6 Total monthly flow for major rivers in the Canberra region during the 2024–25 reporting period, compared with the average and percentiles for each gauging station
- Streamflows across the Canberra region during 2024–25 predominantly below average, reflecting the dry conditions that persisted early in the reporting period.
- Annual streamflow volumes at all monitored gauging stations were lower than the long-term average, with particularly low flows recorded in the Molonglo River at Burbong (Station 410705) compared with other rivers in the region.
- Streamflows remained generally low throughout winter and spring, particularly in the Molonglo River, where monthly flows remained well below average in response to the prolonged absence of rainfall.
- Although flows briefly rose above average in the Queanbeyan River in February, seasonal streamflows remained below average across all three gauging stations during summer.
- Throughout autumn, streamflows declined across much of the region, with the Molonglo River continuing to record particularly low flows relative to average, while the Cotter and Queanbeyan rivers remained below average despite some variability between months.
- Following rainfall in late May, streamflows increased across the region, though responses were strongest in the Queanbeyan River, where flows in May were well above average but tapered off in June, with all three sites finishing the reporting period below average.