


Daly: Climate and water
For the water account period 1 July 2024 to 30 June 2025
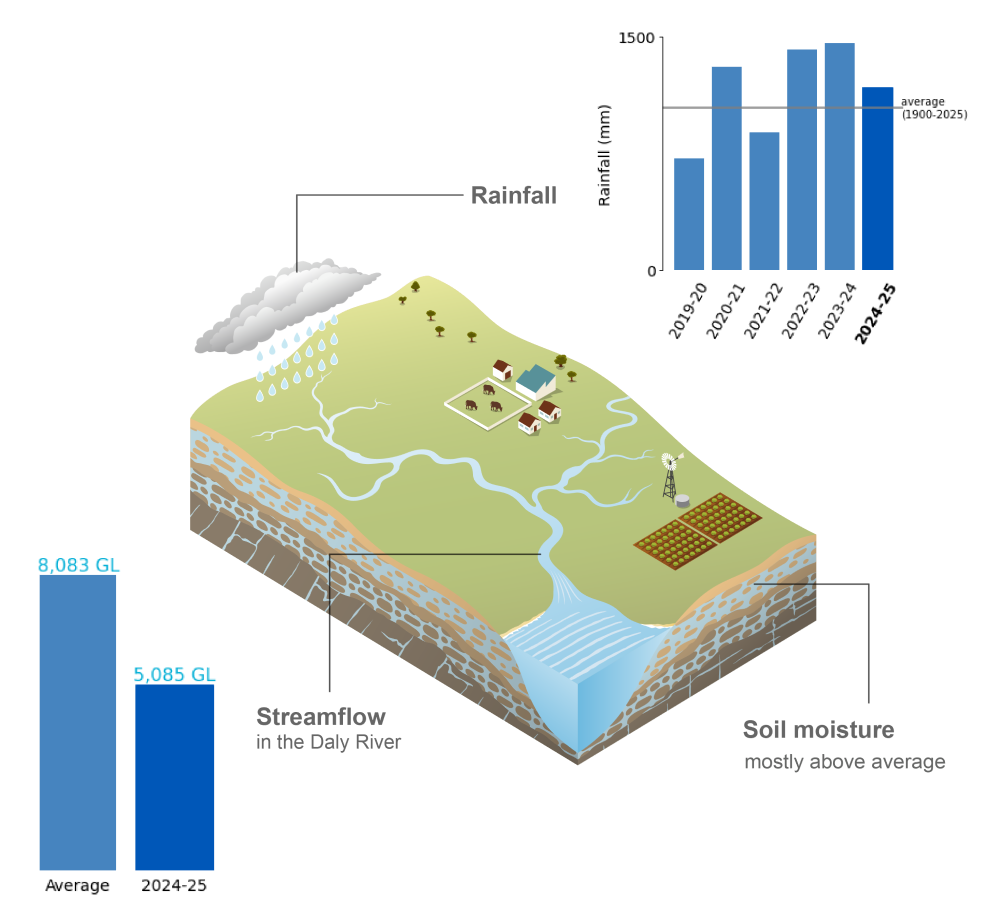
- Rainfall in the Daly region during 2024–25 was above average, with most rainfall occurring in the northern wet season.
- Soil moisture in the root zone (0–1 m depth) was average to above average across much of the region, supported by consistent wet-season rainfall.
- Streamflows in the Daly region during 2024–25 were predominantly below average, particularly in the Daly River.
- Unseasonable late-season rainfall played a key role in sustaining groundwater levels in the Tindall Limestone aquifer during 2024–25.
For further information on the climate and water conditions across the Daly region during the current reporting period, scroll down this page or click on the links below:
About the region
- The Daly region experiences a tropical climate characterised by hot, humid summers and warm, dry winters.
- More than 98% of the region's rainfall occurs during the northern wet season. Throughout the dry season, rainfall is sparse, with some months often recording no rainfall.
- Streamflows reflect the seasonal rainfall pattern, with most flows occurring between December and April. The Daly River, however, is one of the few perennial rivers in northern Australia, with dry-season flows largely sustained by discharge from the Tindall Limestone and Oolloo Dolostone aquifers.
Climate conditions
Rainfall
Figure C1 Annual and monthly rainfall deciles for the Daly region during the 2024–25 reporting period
- Total area-averaged rainfall in the Daly region during 2024–25 was 1,174 mm, 13% above the long-term average of 1,042 mm, with rainfall generally average to above average across most of the region.
- Little to no rainfall occurred across the region during July and August, which is typical for this time of year.
- In September, an upper-level trough combined with tropical moisture led to several days of widespread rainfall and thunderstorms, with locally moderate to heavy falls recorded across areas of the region. As a result, rainfall for September was well above average across the Daly region.
- Multiple rain-bearing systems brought widespread rainfall and isolated thunderstorms during November, with monthly totals above average across much of the Daly region, contributing to a wetter-than average spring.
- Despite the delayed onset of the monsoon, rainfall during the wet-season was above the long-term average, accounting for approximately 90% of the annual rainfall recorded during the reporting period.
- In the final week of May, widespread rain and scattered thunderstorms across the region, resulted in very high May on record rainfall totals in many areas, Katherine and the upper Daly catchment.
- No rainfall was recorded across the region in June, which is typical for this time of year.
- Further information on the 2024–25 northern wet season can be found in Australia’s 2024–25 Northern Wet Season, while more details on Australia's climate and water during the 2024–25 reporting period can be found in the Financial Year Climate and Water Statement 2024–25.
Figure C2 Total monthly rainfall for the Daly region during the 2024–25 reporting period, compared with the average and percentiles for the region
- Rainfall was average to above average across most months.
- January was the only month of the wet season to record below-average rainfall.
Actual evapotranspiration
Figure C3 Annual and monthly actual evapotranspiration deciles for the Daly region during the 2024–25 reporting period
- Total area-averaged actual evapotranspiration was very much above average across the Daly region during 2024–25, with large areas surrounding Pine Creek ranking within the highest decile on record.
- In the lead-up to the wet season, evapotranspiration gradually increased across the region, becoming very much above average following several rain events in September, which increased soil moisture.
- Although evapotranspiration declined slightly in October, it remained near-average to above-average through November across most of the region, consistent with the onset of early wet-season rainfall.
- Evapotranspiration increased further during December, becoming very much above average across most of the region, particularly through central parts of the Daly region.
- The delayed onset of the monsoon contributed to a decrease in evapotranspiration during February, with much of the region returning to either average or below-average conditions.
- Following renewed rainfall through late summer and early autumn, evapotranspiration increased again, becoming mostly above average during the final month of the wet season.
- Evapotranspiration remained above average across much of the region through May and June, reflecting increased soil moisture following the wet season and enhanced evaporation under clear conditions.
Soil moisture
Figure C4 Annual and monthly soil moisture deciles for the Daly region during the 2024–25 reporting period
- Total area-averaged soil moisture in the root zone (0–1 m depth) was generally average to above average across most of the Daly region during 2024–25, reflecting consistent rainfall that maintained adequate moisture through much of the wet season.
- Soil moisture was average to above average across the region during July and August, with high rainfall from the previous wet season sustaining moisture availability through the dry season.
- Following very wet conditions during September, soil moisture increased sharply, becoming very much above average across much of the region.
- In response to widespread early wet-season rainfall, soil moisture remained predominantly above average throughout October and November.
- High rainfall during spring and early summer contributed to very high soil moisture during December across large areas of the Daly region, building on moisture gained from rainfall in the preceding months.
- The delayed onset of the monsoon, combined with below-average rainfall in January, caused soil moisture to decline through summer, becoming average to below average across much of the region by March, before improving again in April as renewed rainfall replenished upper-soil stores.
- Widespread out-of-season rainfall during the final week of May saturated soils across the region, resulting in areas of the Daly region recording its highest soil moisture on record for June.
- Further information on soil moisture conditions across the Daly region during the 2024–25 reporting period is available on the Australian Water Outlook.
Hydrological responses
Streamflow
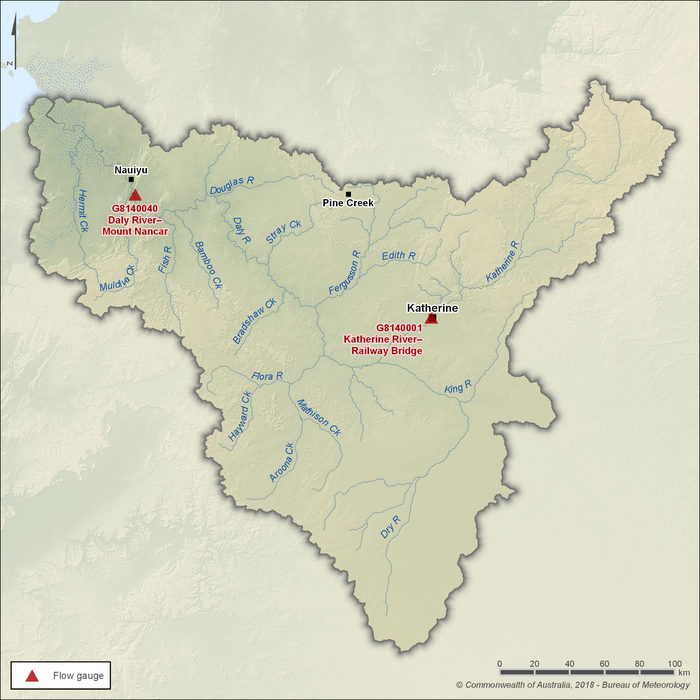
Figure C5 Key flow gauging stations along the main rivers within the Daly region
- The Katherine and Daly rivers are the two primary river systems in the Daly region, with the Katherine River acting as the main tributary to the Daly River, one of the larger river systems in the Northern Territory.
- Two gauging stations (shown in Figure C5) are used to represent seasonal flow patterns across the region.
- Although streamflows are strongly influenced by annual rainfall patterns, the Daly River is one of the few perennial rivers in northern Australia, with year-round flows sustained by groundwater discharge from the Tindall Limestone and Oolloo Dolostone aquifers, which are separated by an intervening siltstone aquitard.
Figure C6 Total monthly flow for major rivers in the Daly region during the 2024–25 reporting period, compared with the average and percentiles for each gauging station
- Streamflows in the Daly region during 2024–25 were predominantly below average, particularly in the Daly River, reflecting generally moderate runoff responses to rainfall events across the region.
- As is typical for this region, the majority of streamflow occured during the northern wet season, with most flows in both the Daly and Katherine rivers occuring between October and April.
- In the lead-up to the wet season, flows in the Daly River were above average, supported by sustained groundwater discharge from the underlying Tindall Limestone and Oolloo Dolostone aquifers.
- Despite a wetter-than-average spring, streamflow responses were limited, with only modest increases observed at both gauging stations.
- Both rivers increased in December, rising close to the 90th percentile at both sites, before stabilising in January as the delayed onset of the monsoon limited further flow increases.
- Although streamflows peaked in volume during February at both sites, streamflows remained near average before declining through March, reflecting the absence of sustained rainfall during the peak of the wet season.
- Flows in the Daly River rose slightly during April, supported by above-average late wet-season rainfall, and remained above average through to the end of the reporting period.
- Following the late-season rainfall in May, streamflows in the Katherine River increased markedly, with elevated flows persisting into early dry-season conditions.
Groundwater levels
- The Tindall Limestone and Oolloo Dolostone aquifers are important groundwater stores that support dry-season flows in parts of the Daly catchment.
- Several smaller, local, low-yielding aquifers are also present in the region and are primarily used for stock and domestic supply.
- Two key groundwater level monitoring bores—one for the Tindall Limestone aquifer near Katherine, and one for the Oolloo Dolostone aquifer near the junction of the Douglas and Daly rivers—are used to monitor groundwater levels across the Daly region.
Figure C7 Groundwater level in key bores within the Daly region since July 2014
- Groundwater levels in the Tindall Limestone aquifer declined through the early part of the reporting period, reaching a seasonal low in late October, consistent with typical dry-season recession following recharge from the previous wet season.
- Groundwater levels began to recover during late spring and early summer, responding to increased rainfall and recharge associated with wetter-than-average spring conditions.
- Despite variability in summer rainfall, groundwater levels continued to respond to individual high-rainfall events, peaking during February before gradually declining again through autumn as recharge became less frequent.
- An unseasonable rainfall event in late May resulted in a marked increase in groundwater levels, interrupting the normal seasonal decline and contributing additional recharge late in the reporting period.
- By the end of June, groundwater levels had declined slightly from their late-season peak but remained substantially higher than at the start of the reporting period, indicating that late-season rainfall played a key role in sustaining groundwater during 2024–25.
- More information on groundwater resources in the Daly region is available in the Region description.