


Daly: Supporting information
For the water account period 1 July 2024 to 30 June 2025
- Total water inflows to the Daly region during 2024–25 was 6,621 GL, approximately 60% less than the previous reporting period.
- Approximately 30% of surface water allocations and 25% of groundwater allocations were used in the Daly region during the reporting period, primarily for agricultural use.
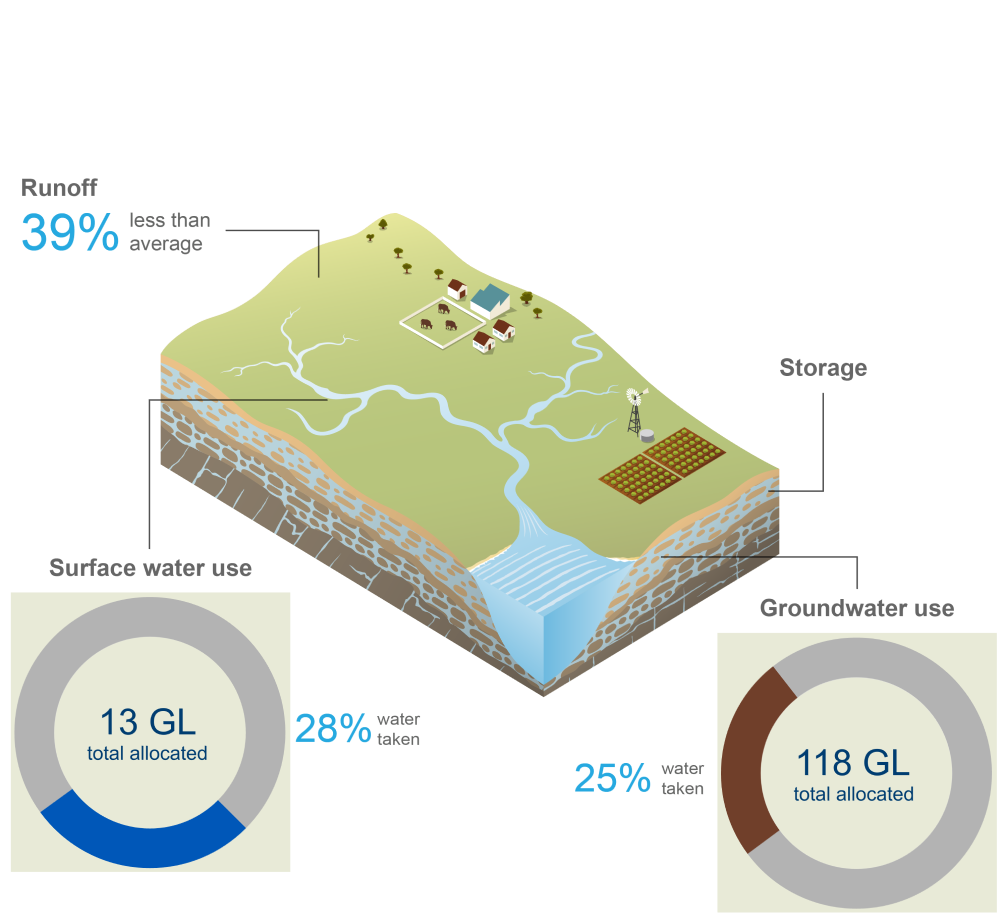
This section provides a detailed breakdown of water assets, liabilities, flows, availability, and use in the Daly region over the past six water accounting periods, outlining where water is stored and how it is used across the region.
For further information, scroll down this page or click on the links below:
Water assets
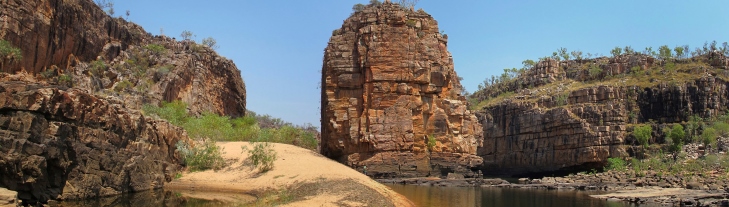
- Total water assets in the Daly region on 30 June 2025 were 28 GL, 50% higher than the previous reporting period, and the highest since the 2013–14 reporting period.
- Rivers account for the entire volume of water assets in the region, as surface water storage volumes are not reported due to data availability.
- Surface water storages do exist in the Daly region, such as Copperfield Dam, but represent a negligible component of the region’s overall water resources.
- A detailed breakdown of water assets in the Daly region is available in the Statement of Water Assets and Water Liabilities.
Surface water assets
- Surface water assets in the Daly region are entirely represented by river volumes, as surface water storage volumes are not reported due to data limitations.
- Although surface water storages exist in the region, such as Copperfield Dam, they represent a negligible component of the region’s overall water resources and are not included in reported asset volumes.
Groundwater assets
- The volume of groundwater held in aquifers across the Daly region cannot be quantified due to the complex interaction between surface water and groundwater systems.
- Historical estimates of annual changes in aquifer storage were previously reported; however, this information has not been available since 2023 due to data limitations in the Daly region.
Water liabilities
- Water liabilities in the Daly region refer to the volume of allocation remaining on licence entitlements at the end of the reporting period (30 June).
- Most surface water and groundwater licences in the Daly region operate on a management year that ends on 30 June. As carryover is not permitted, any unused allocation is forfeited at the end of the water year; consequently, the closing balance for surface water and groundwater licences is 0 ML.
- A more detailed description of water allocations in the Daly region is provided in the Water use section.
| Description | 2025 | 2024 | 2023 | 2022 | 2021 | 2020 | |
| Opening balance at 01 July | 0 | 0 | 0 | 0 | 0 | 0 | |
| add | Allocations | 12,964 | 9,750 | 10,364 | 14,441 | 8,884 | 9,430 |
| less | Allocated diversions | 3,573 | 3,195 | 3,399 | 3,832 | 3,473 | 3,721 |
| less | Adjustments and forfeitures | 9,391 | 6,555 | 6,965 | 10,609 | 5,411 | 5,709 |
| Closing balance at 30 June | 0 | 0 | 0 | 0 | 0 | 0 | |
- Surface water allocations in the Daly region during 2024–25 were 13 GL, with no water carried over from the previous year due to the absence of carryover provisions.
- Approximately 30% (4 GL) of the total surface water allocations were diverted during the reporting year, primarily to urban users.
- The remaining volume of allocated water (9 GL) was forfeited at the end of the reporting year in accordance with licence conditions.
| Description | 2025 | 2024 | 2023 | 2022 | 2021 | 2020 | |
| Opening balance at 01 July | 0 | 0 | 0 | 0 | 0 | 0 | |
| add | Allocations | 117,546 | 142,607 | 144,548 | 144,473 | 143,993 | 146,663 |
| less | Allocated extractions | 28,914 | 23,953 | 48,613 | 46,314 | 37,289 | 48,609 |
| less | Adjustments and forfeitures | 88,632 | 118,654 | 95,935 | 98,159 | 106,704 | 98,054 |
| Closing balance at 30 June | 0 | 0 | 0 | 0 | 0 | 0 | |
- Groundwater allocations in the Daly region during 2024–25 were 118 GL, with no water carried over from the previous year due to the absence of carryover provisions.
- Approximately 25% (29 GL) of the total groundwater allocations were extracted during the reporting year, primarily for agricultural users.
- The remaining volume of allocated groundwater (89 GL) was forfeited at the end of the reporting year in accordance with licence conditions.
Water flows
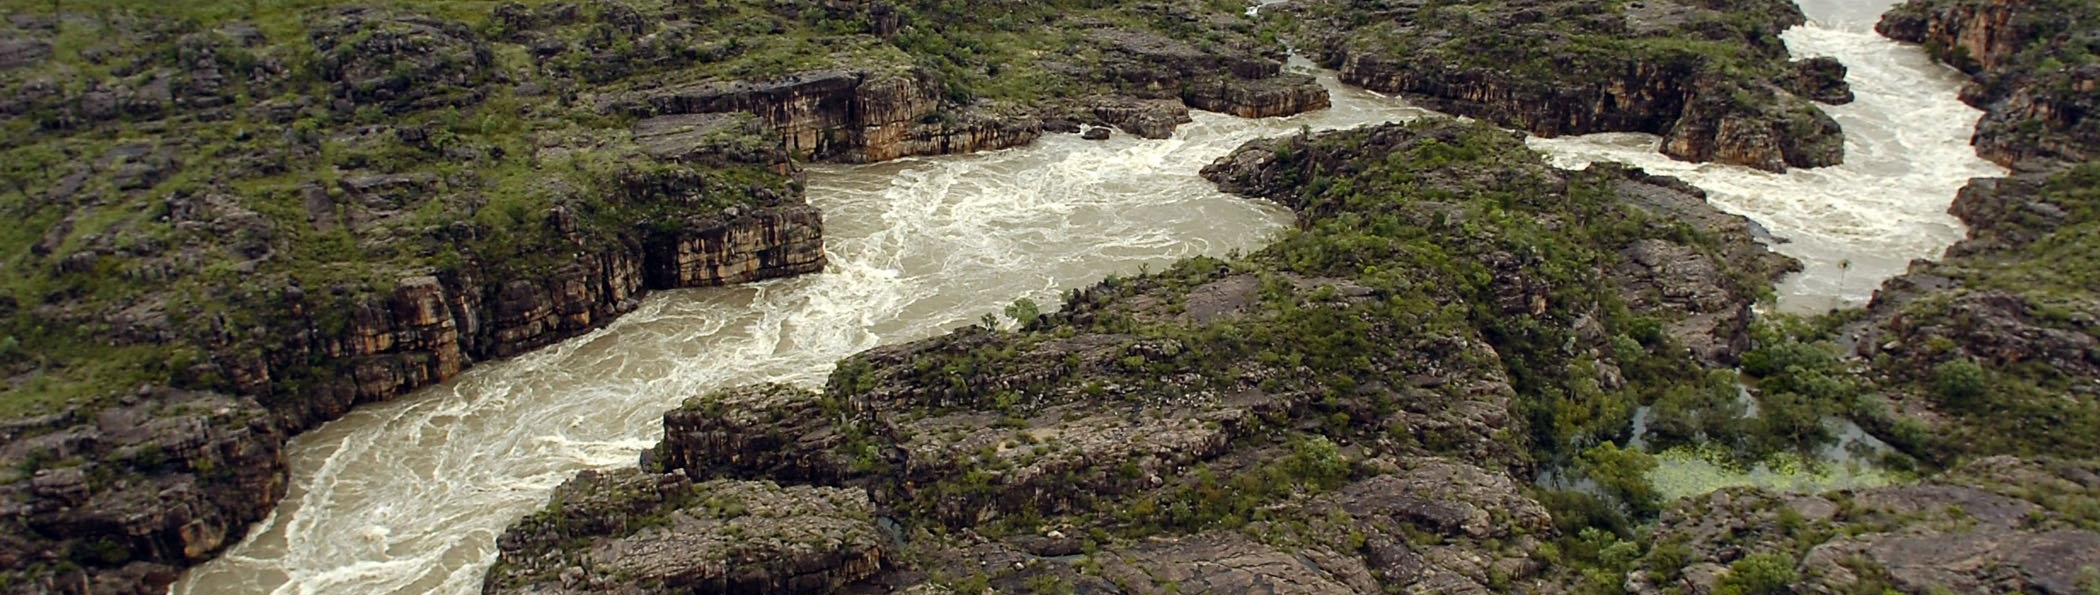
- Water flows in the Daly region describe the movement of water between surface water and groundwater stores.
- A summary of total inflows and outflows for each water store is provided below.
- For a detailed breakdown of inflows and outflows in the Daly region, refer to the Statement of Changes in Water Assets and Water Liabilities.
| Water inflows | 2025 | 2024 | 2023 | 2022 | 2021 | 2020 |
| Surface water inflows | 6,120,751 | 17,091,298 | 11,696,430 | 5,679,446 | 11,205,894 | 2,123,493 |
| Groundwater inflows | 500,169 | 488,495 | 475,878 | 439,943 | 1,033,332 | 245,805 |
| Total water inflows | 6,620,920 | 17,579,793 | 12,172,308 | 6,119,389 | 12,239,226 | 2,369,298 |
- Total water inflows to the Daly region during 2024–25 were 6,621 GL, approximately 60% less than the previous reporting period, and 30% below the long-term average of 9,740 GL.
- Surface water inflows contributed around 90% (6,121 GL) of total inflows, with runoff accounting for 85% of surface water inflows.
- Runoff into the region's surface water systems was 65% lower than the previous reporting period, and 40% below the long-term average of 8,465 GL (based on area-averaged modelled data since July 1971), reflecting the absence of major rainfall events during the wet season.
- Groundwater inflows made up the remaining volume (500 GL) of total inflows, mostly from recharge from landscape and recharge from surface water.
| Water outflows | 2025 | 2024 | 2023 | 2022 | 2021 | 2020 |
| Surface water outflows | 6,273,674 | 18,081,634 | 9,979,314 | 4,288,474 | 10,555,146 | 2,499,543 |
| Groundwater outflows | 667,344 | 662,383 | 687,043 | 794,914 | 591,579 | 661,009 |
| Total water outflows | 6,941,018 | 18,744,017 | 10,666,357 | 5,083,388 | 11,146,725 | 3,160,552 |
- Total water outflows from the Daly region during 2024–25 were 6,941 GL, approximately 65% lower than the previous reporting period, corresponding to the significant decrease in total water inflows across the region.
- Surface water outflows accounted for around 90% (6,274 GL) of total outflows, primarily from outflows to sea, which contributed 90% of surface water outflows.
- Outflows to sea from the region's rivers were 65% lower than the previous reporting period, and 30% below the long-term average of 8,455 GL (based on area-averaged modelled data since July 1971), reflecting the reduction in runoff and surface water inflows across the region.
- Groundwater outflows made up the remaining volume (667 GL) of total outflows, largely associated with discharge to surface water.
Water use
Consumptive use
- A total of 42 GL of water was taken from surface water and groundwater resources for consumptive use in the Daly region during 2024–25, representing an increase of approximately 14% compared to the previous reporting period.
| Surface water | 2025 | 2024 | 2023 | 2022 | 2021 | 2020 |
| Agriculture users | 960 | 1,002 | 1,307 | 1,150 | 780 | 949 |
| Cultural users | 255 | 281 | 164 | 216 | - | - |
| Industrial users | 53 | 24 | 40 | 105 | 80 | 75 |
| Mining users | 0 | 0 | 0 | 0 | - | - |
| Other users | 5,415 | 5,415 | 5,415 | 5,369 | 5,369 | 5,369 |
| Urban users | 2,485 | 2,068 | 2,068 | 2,541 | 2,793 | 2,877 |
| Total | 9,168 | 8,790 | 8,994 | 9,381 | 9,022 | 9,270 |
- Surface water diversions across the Daly region during 2024–25 were 9 GL, slightly higher than the previous reporting period, reflecting increased diversions to urban users.
- Approximately 60% of surface water diversions were by users with statutory rights, while urban users accounted for a further 25% of diversions.
- Agricultural users made up around 10% of surface water diversions, with cultural and industrial users comprising the remaining volume of diversions.
- No surface water diversions were reported for mining users during the reporting period.
| Groundwater | 2025 | 2024 | 2023 | 2022 | 2021 | 2020 |
| Agricultural users | 27,101 | 22,181 | 46,873 | 44,293 | 36,142 | 47,320 |
| Cultural users | 417 | 595 | 402 | 1,160 | 456 | 535 |
| Industrial users | 434 | 469 | 300 | 310 | 293 | 377 |
| Mining users | 128 | 263 | 143 | 86 | - | - |
| Other users | 4,280 | 4,280 | 4,280 | 4,280 | 4,280 | 4,280 |
| Urban users | 834 | 445 | 895 | 465 | 398 | 377 |
| Total | 33,194 | 28,233 | 52,893 | 50,594 | 41.569 | 52,889 |
- Groundwater extractions across the Daly region during 2024–25 were 33 GL, approximately 15% higher than the previous reporting period, primarily due to increased extractions by agricultural users.
- Approximately 82% (27 GL) of groundwater extractions were made by agricultural users, while users with statutory rights accounted for a further 15% of extractions.
- The remaining volume of groundwater extractions was distributed across urban, industrial, cultural, and mining users.
Allocations and diversions
| Surface water | 2025 | 2024 | 2023 | 2022 | 2021 | 2020 |
| Individual users | ||||||
| Carryover | 0 | 0 | 0 | 0 | 0 | 0 |
| Allocated announcements | 12,964 | 9,750 | 10,364 | 14,441 | 8,884 | 9,430 |
| Allocated diversions | 3,573 | 3,195 | 3,399 | 3,832 | 3,473 | 3,721 |
| % used | 28% | 33% | 33% | 27% | 39% | 39% |
- Total surface water allocations in the Daly region during 2024–25 were 13 GL, 35% higher than the previous reporting period, with no water carried over from the previous year due to licensing provisions that prohibit carryover.
- Approximately 30% of the available surface water allocations were used during the reporting period, primarily by urban users.
- Although the volume of surface water allocations diverted across the Daly region increased by just over 10% from the previous reporting period, diversions remained relatively low, reflecting limited demand within the region.
| Groundwater | 2025 | 2024 | 2023 | 2022 | 2021 | 2020 |
| Individual users | ||||||
| Carryover | 0 | 0 | 0 | 0 | 0 | 0 |
| Allocated announcements | 117,546 | 142,607 | 144,548 | 144,473 | 143,993 | 146,663 |
| Allocated extractions | 28,914 | 23,953 | 48,613 | 46,314 | 37,289 | 48,609 |
| % used | 25% | 17% | 34% | 32% | 26% | 33% |
- Total groundwater allocations in the Daly region during 2024–25 were 118 GL, less than 20% lower than the previous reporting period, with no water carried over from the previous year due to licensing provisions that prohibit carryover.
- Approximately 25% of the available groundwater allocations were extracted during the reporting period, primarily by agricultural users.
- Although groundwater extractions increased by 20% compared to the previous reporting period, the proportion of allocations used remained relatively low, reflecting limited demand relative to the volume of allocations available.
Water restrictions
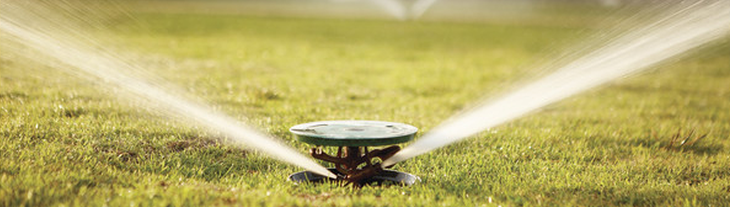
- Under these restrictions, odd-numbered properties may water on Mondays, Wednesdays, and Saturdays between 6 pm and 8 am, while even-numbered properties may water on Tuesdays, Thursdays, and Sundays during the same hours.
- Watering is not permitted on Fridays, and the use of water to clean hard surfaces such as driveways, footpaths, street gutters, and paved areas is prohibited.
- Further details on current water restrictions in the Daly region are available via the Bureau of Meteorology’s Water Restrictions website.