


Fitzroy: Key findings
For the water account period 1 July 2024 to 30 June 2025
- The 2024–25 year in the Fitzroy region featured slightly above-average rainfall, driven largely by late wet season rainfall following variable conditions earlier in the year.
- Soil moisture was generally near-average to above average, with late wet season rainfall increasing soil moisture after earlier spatial variability.
- Total storage volume in the Fitzroy region decreased by 20 percentage points during the reporting period, finishing at 33.2% full on 30 June 2025.
Climate and water
Rainfall

730 mm
8% above the average of 676 mm
Streamflow

below average
across most of the region
Storage

33.2% full

20.1% less than last year
Water use from all sources
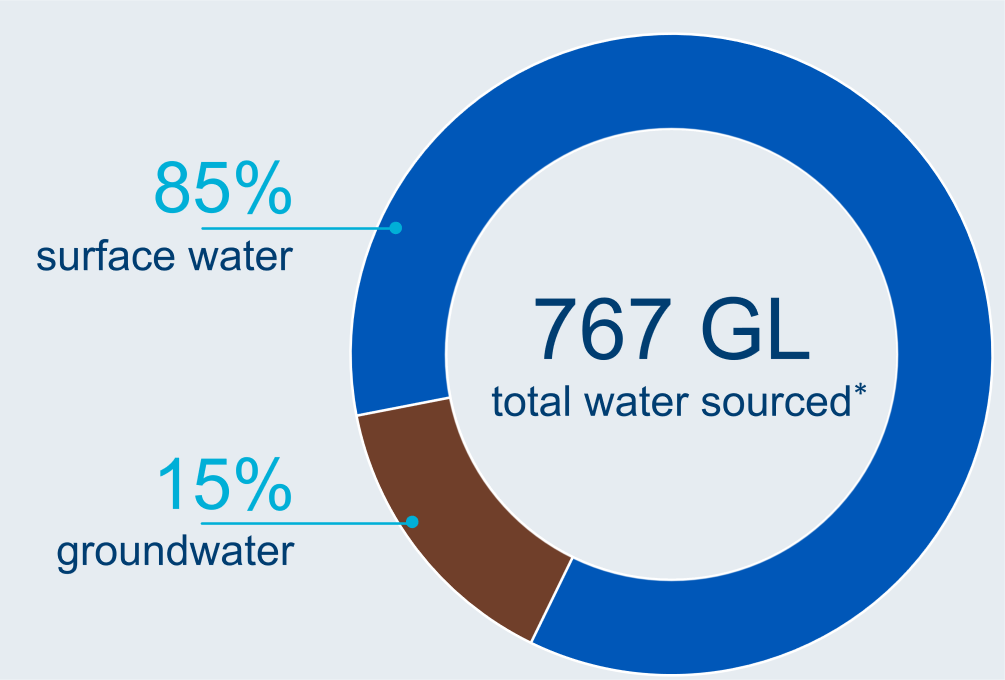
Water sourced
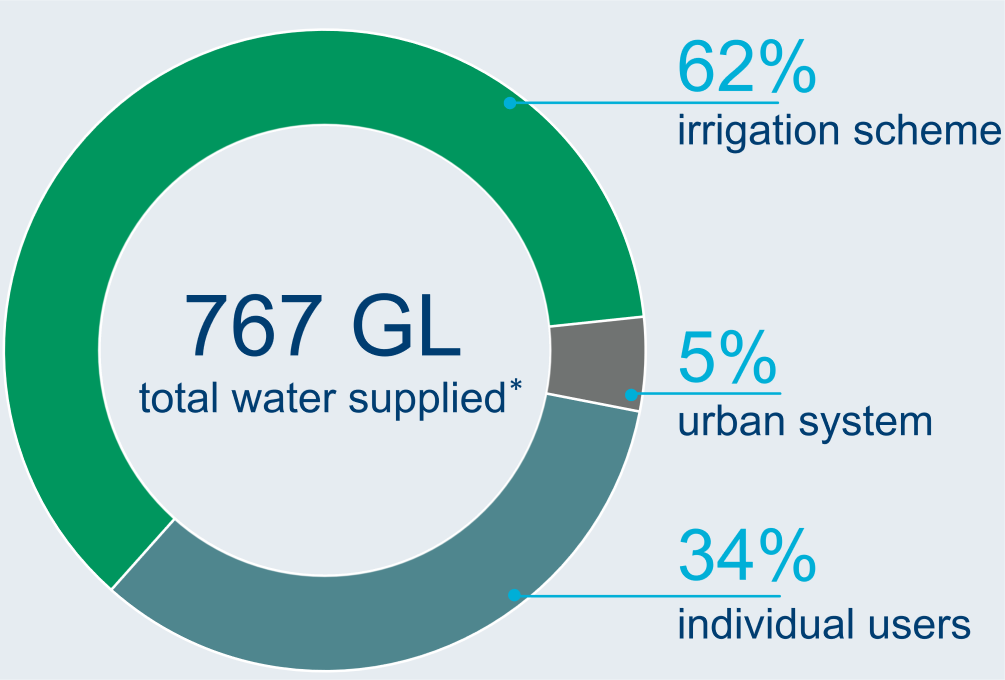
Water supplied
* Includes non-allocated water use
Water status of water resources
Water availability
5,181 GL
surface water available in 2024–25

48% more than last year
Water accessible
1,098 GL
total surface water and groundwater accessible in 2024–25
5% more than last year
Water taken
767 GL
total surface water and groundwater taken in 2024–25
slightly less than last year