


Fitzroy: Climate and water
For the water account period 1 July 2024 to 30 June 2025
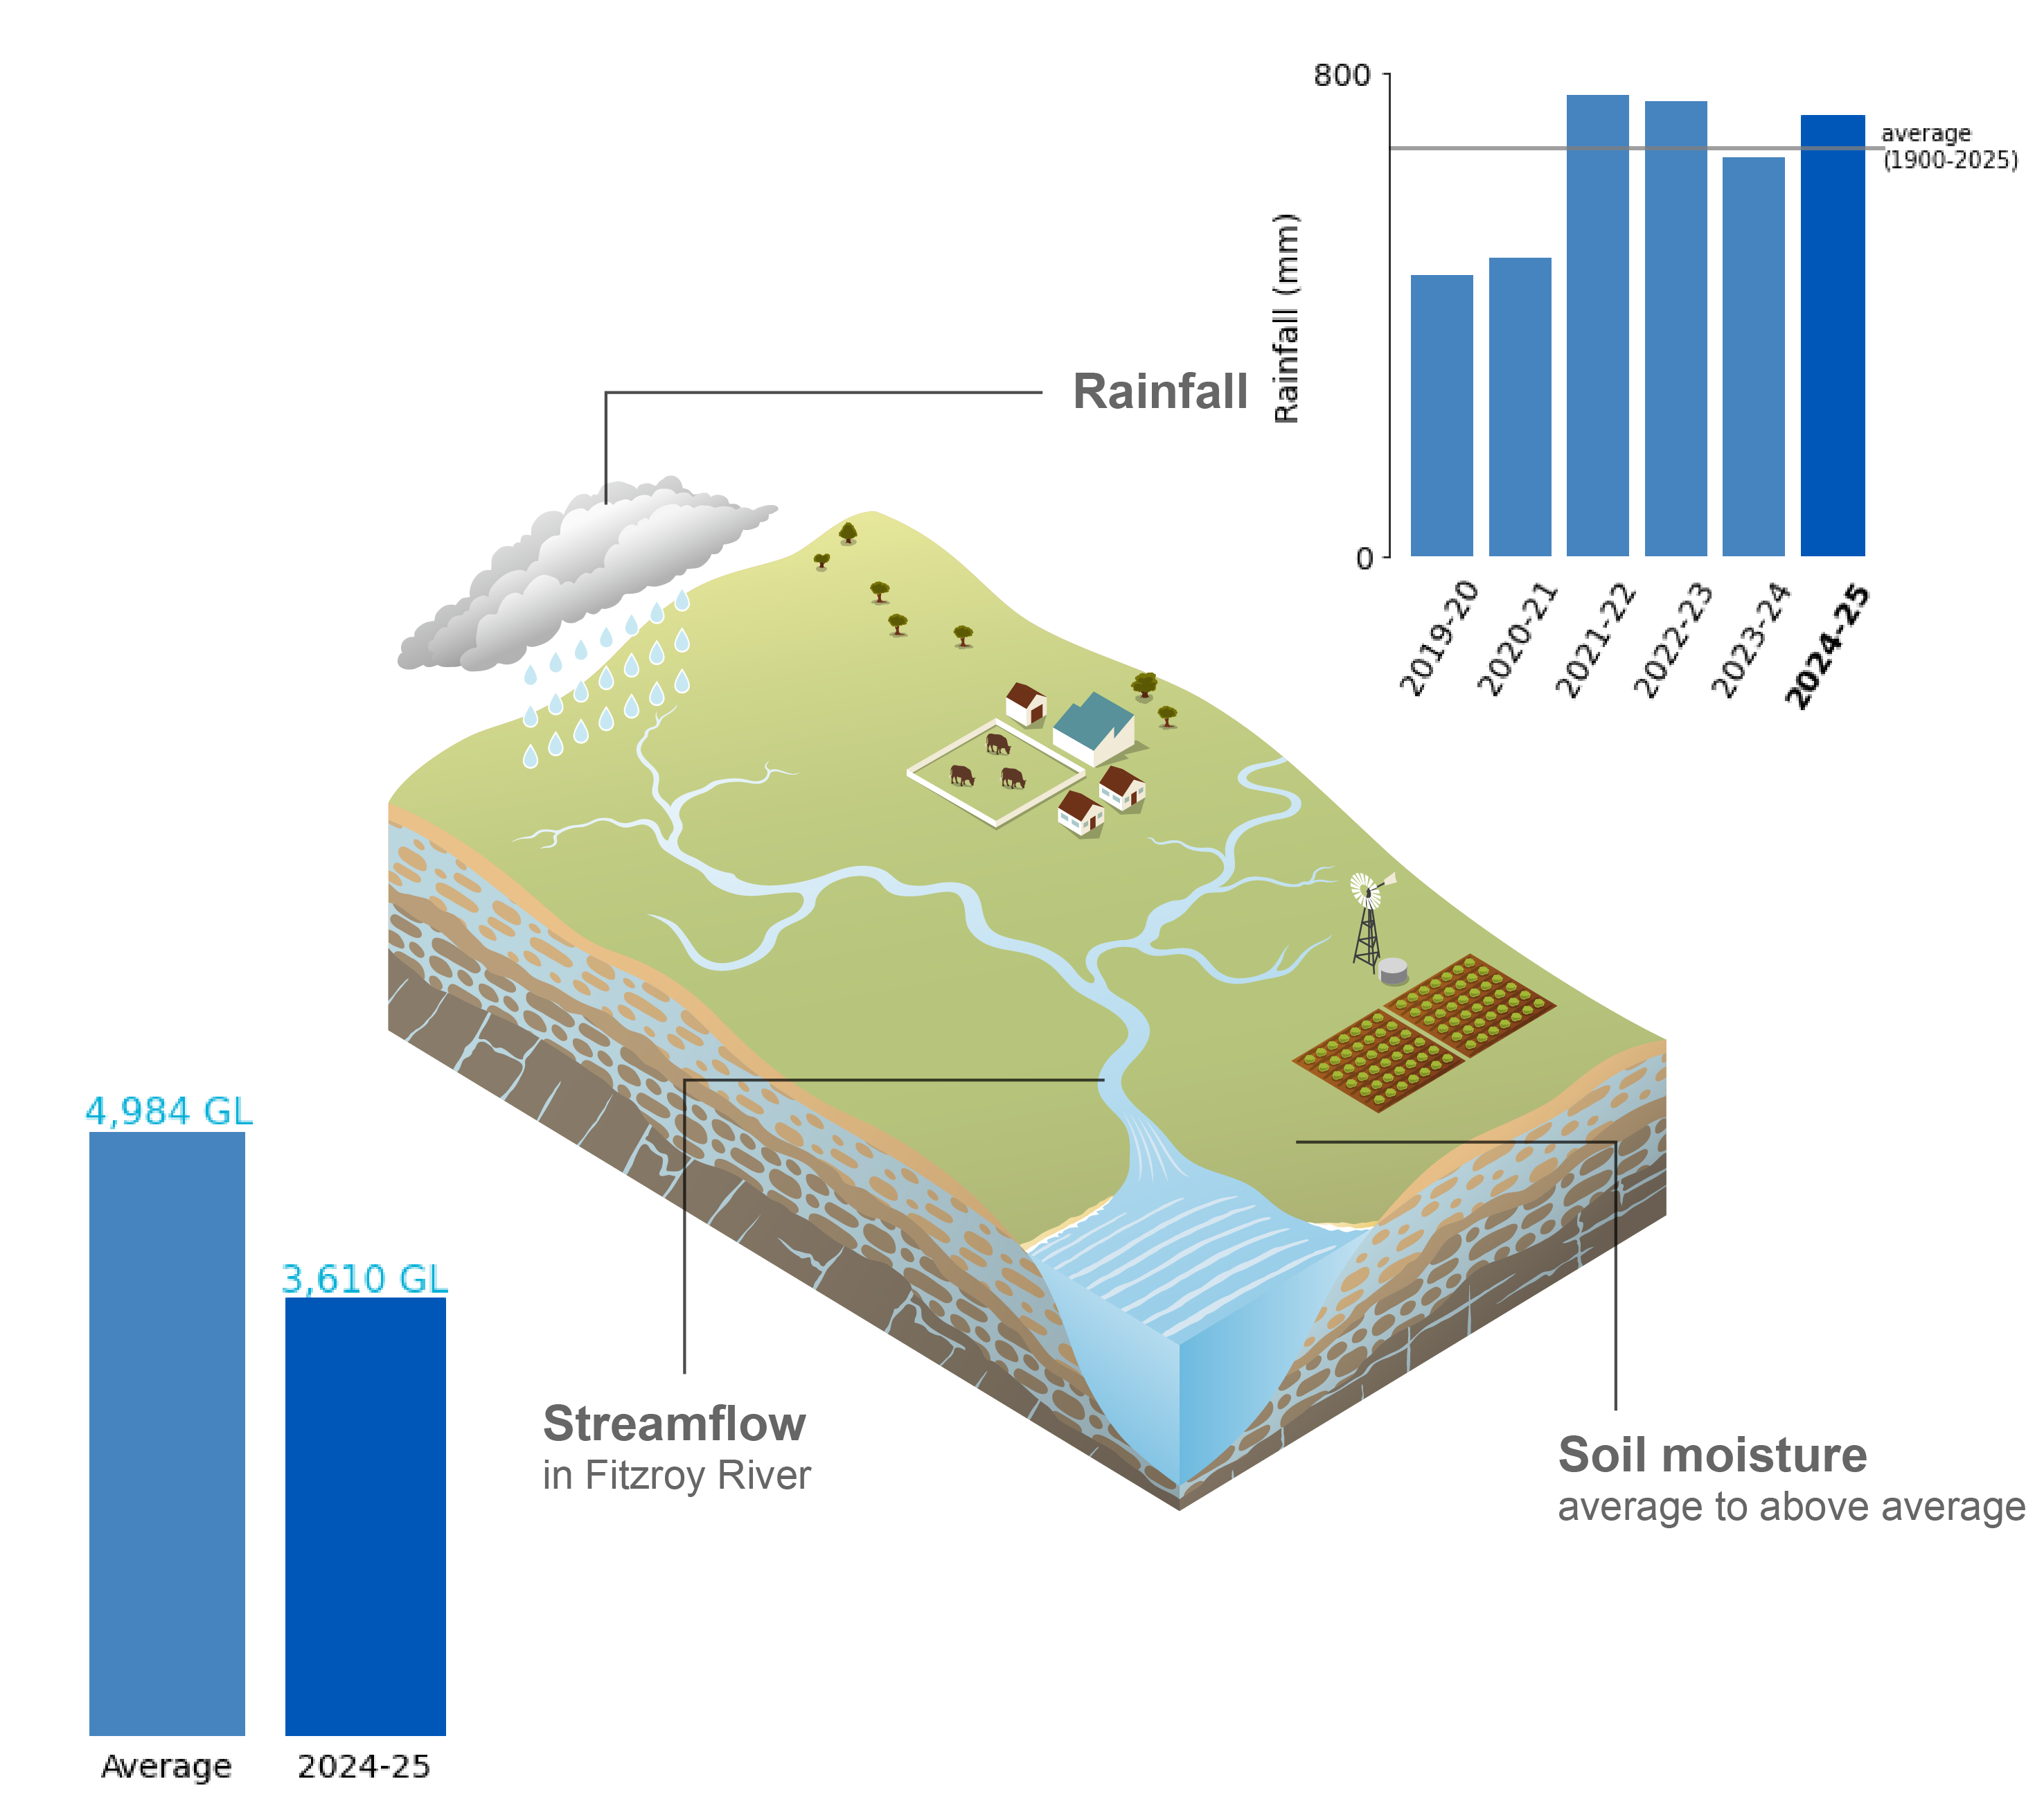
- The 2024–25 year in the Fitzroy region featured slightly above-average rainfall, driven largely by late wet season rainfall following variable conditions earlier in the year.
- Soil moisture was generally near-average to above average, with late wet season rainfall increasing soil moisture after earlier spatial variability.
- Streamflows remained below average across most of the region, with limited contributions from the Nogoa, Comet, and Dawson rivers offsetting stronger flows in the Isaac River.
For further information on the climate and water conditions across the Fitzroy region during the current reporting period, scroll down this page or click on the links below:
About the region
- The Fitzroy region is dissected by the Tropic of Capricorn, giving rise to two climatic zones—the northern and eastern areas are characterised by a subtropical climate, while the southern and western areas experience a semi-arid inland subtropical climate.
- Rainfall across the region has a high inter-annual variability, with some years experiencing very high rainfall followed by periods of drought. High rainfall totals are most common during the northern wet season between October and April, but rainfall can also occur at other times of the year. Coastal areas typically receive higher annual totals than inland areas.
- Streamflows in the region generally reflect the seasonal distribution of rainfall, peaking during the northern wet season between December and April, while rivers can periodically cease to flow during the dry season between May and September.
Climate conditions
Rainfall
Figure C1 Annual and monthly rainfall deciles for the Fitzroy region during the 2024–25 reporting period
- Total area-averaged rainfall in the Fitzroy region during 2024–25 was above the long-term average, with approximatley 730 mm recorded, around 8% above the long-term average of 676 mm, with greater rainfall totals concentrated north of Rockhampton.
- A low-pressure system interacting with an onshore flow brought unseasonable rainfall in mid-August, leading to some locations experiencing their wettest August on record as monthly totals exceeded 100 mm in parts of the east.
- Rainfall during September was well below average, with the region receiving only a small proportion of its long-term September average, consistent with typically dry conditions during this period.
- Multiple thunderstorm outbreaks brought widespread rainfall to the region throughout October and November, contributing to the establishment of the northern rainfall onset.
- Over the course of summer, rainfall was close to average across the region, with no significant rainfall event bringing extreme totals, though below-average conditions were more evident across parts of the south and central inland areas during January.
- The influence of Severe Tropical Cyclone Alfred early in the month, along with subsequent low-pressure systems, resulted in above-average rainfall across much of the region in March.
- Rainfall continued to be above average during April, with the region observing close to double the long-term monthly average, bringing the 2024–25 wet season to a close, which accounted for approximately 80% of the region’s total rainfall during the reporting period.
- Further information on the 2024–25 northern wet season can be found in Australia's 2024–25 Northern Wet Season, while more details on Australia's climate and water during the 2024–25 reporting period can be found in the Financial Year Climate and Water Statement 2024–25.
Figure C2 Total monthly rainfall for the Fitzroy region during the 2024–25 reporting period, compared with the average and percentiles for the region
- Prior to the northern wet season, June and September was below average, although neither month experienced very low rainfall reltive to the long-term record. In contrast, August was unseasonably wet, with rainfall well above average and higher than observed in mot other months during the reporting period.
- Throughout the northern wet season, only April ranked close to the 90th percentile.
Actual evapotranspiration
Figure C3 Annual and monthly actual evapotranspiration deciles for the Fitzroy region during the 2024–25 reporting period
- Total area-averaged actual evapotranspiration during 2024–25 was average to above average across most of the Fitzroy region, consistent with rainfall patterns and moisture availability across the reporting period.
- Unseasonable rainfall and increasing temperatures contributed to above-average evapotranspiration during August, particularly across the central parts of the region.
- Leading up to the northern wet season, evapotranspiration declined slightly during September in response to limited rainfall, although conditions remained above average in eastern areas around Rockhampton, reflecting residual moisture from earlier rainfall.
- Evapotranspiration remained close to average during October and November, before increasing in December following near-average rainfall.
- As temperatures and soil moisture increased, evapotranspiration was above average across much of the region during January.
- During February and early autumn, evapotranspiration was close to average across the region. Rainfall associated with Severe Tropical Cyclone Alfred in March, together with above-average rainfall in April, contributed to above-average evapotranspiration across much of the region by the conclusion of the northern wet season.
- Throughout the final two months of the reporting period, the lack of significant rainfall in addition to lower temperatures led to below-average evapotranspiration emerging across the southern half of the region.
Soil moisture
Figure C4 Annual and monthly soil moisture deciles for the Fitzroy region during the 2024–25 reporting period
- Total area-averaged soil moisture in the root zone (0–1 m depth) during 2024–25 was generally near-average to above average across much of the Fitzroy region, consistent with rainfall patterns through the reporting period.
- Unseasonable rainfall during August led to an increase in soil moisture, with above-average conditions developing across central and eastern parts of the region and wetter conditions more evident in northern catchments.
- Soil moisture declined during spring, particularly across southern and western inland areas, while near-average conditions persisted in lower-lying and eastern catchments, supported by residual moisture from earlier rainfall.
- During summer, soil moisture conditions were spatially variable, remaining near average in northern and eastern areas but becoming below average in parts of the southern and central inland region as rainfall deficits developed.
- Late wet season rainfall in April increased soil moisture conditions, with above average moisture becoming more widespread, before gradually decreasing toward near-average levels by the end of the reporting period.
- Further information on soil moisture conditions across the Fitzroy region during the 2024–25 reporting period is available on the Australian Water Outlook.
Streamflow responses
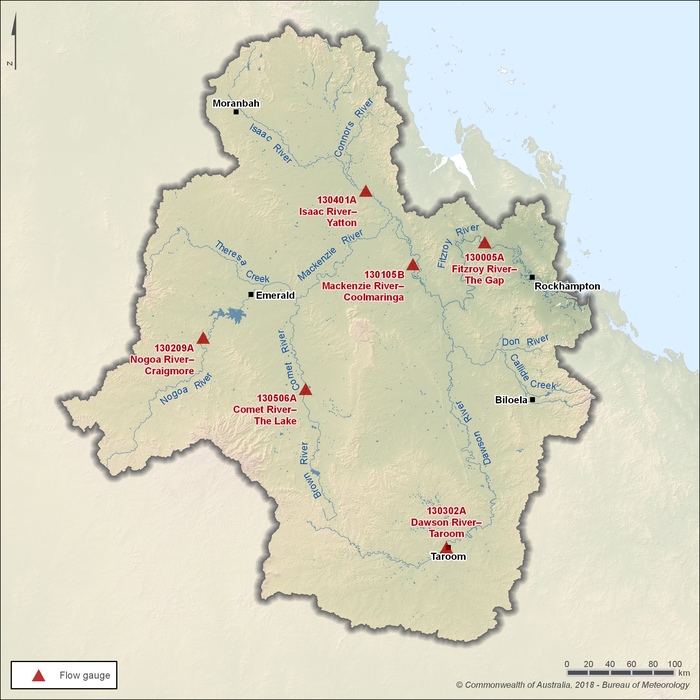
Figure C5 Key flow gauging stations along the main rivers within the Fitzroy region
- The Comet, Dawson, Isaac, Mackenzie, and Nogoa rivers are major tributaries of the Fitzroy River, which flows through Rockhampton before draining into the World Heritage-listed Great Barrier Reef Lagoon.
- Each of the six river catchments corresponds to one of the six sub-basins used for environmental water management (see Water management in 'Region description' for more information).
- Six gauging stations, one on each major river system, are used to represent seasonal flow patterns across the region. Many rivers and creeks in the Fitzroy region can cease to flow between May and October.
- Releases from Fairbairn Dam regulate flows in the Nogoa River to support water supply during the dry season. As a result, flows in the lower reaches of the Fitzroy River are generally perennial.
Figure C6 Total monthly flow for major rivers in the Fitzroy region during the 2024–25 reporting period, compared with the average and percentiles for each gauging station
- Streamflows across the Fitzroy region were well below average at most gauging stations during 2024–25. An exception occured at Issac River at Yatton (Station 130401A), where streamflows were elevated compared with other parts of the region.
- Although flows in the Isaac River, which feed into the Mackenzie and subsequently the Fitzroy rivers, were above average, flows in the Mackenzie and Fitzroy rivers were below average, reflecting limited contributions from the smaller Nogoa, Comet, and Dawson rivers.
- Flows across most river systems remained low during the early part of the reporting period, reflecting the generally dry conditions during winter and spring. Several gauging stations recorded little to no flow during individual months, particularly on the Nogoa, Comet, and Dawson rivers.
- Despite the onset of the northern wet season during October and November, streamflow responses across much of the region remained limited, with flows at most gauging stations staying below average.
- Streamflows increased during summer, particularly in the Isaac River, where above-average rainfall across the northern half of the region contributed to sustained high flows. In contrast, flows in the Nogoa and Comet rivers remained very low, with both stations recording wet season totals below the 10th percentile.
- A more widespread streamflow response occurred later in the wet season, with above-average rainfall in March and April generating peak flows across several river systems. This was most evident in April when flows at all gauging stations peaked for the reporting period and, except for the Nogoa River, rose above the 90th percentile.
- As no significant rainfall occurred across the region during the final two months of the reporting period, flows at all sites dropped to near-base flows, with the Nogoa River ceasing to flow by June.