


Fitzroy: Statement of Water Assets and Water Liabilities
For the water account period 1 July 2024 to 30 June 2025
- In the Fitzroy region, water availability decreased by 18% during 2024–25, entirely from changes in surface water assets.
- Water availability is represented by the net water assets, which are the volume of water in storages minus the water liabilities.
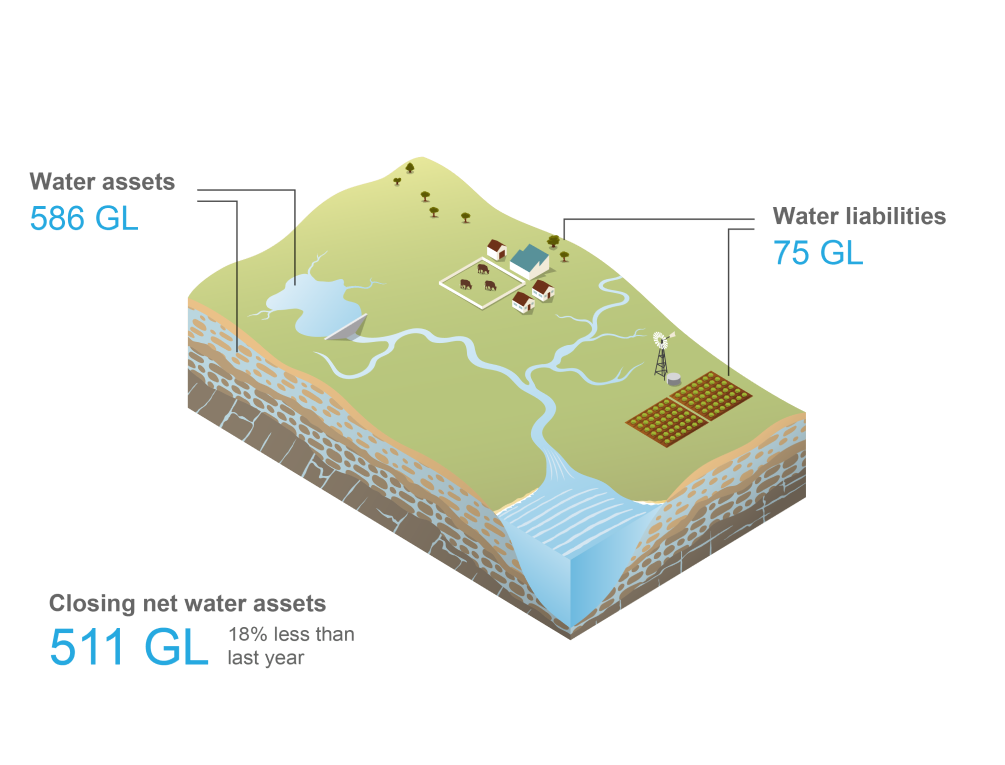
The Statement of Water Assets and Water Liabilities provides a detailed breakdown of the volume of water assets and water liabilities in the Fitzroy region over the past six water accounting periods ending 30 June, as well as changes in net water assets between the start (1 July) and end (30 June) of each reporting period.
To view the Statement of Water Assets and Water Liabilities, scroll down to the table below.
Select comparative year
| 2025 (ML) | 2024 (ML) | 2023 (ML) | 2022 (ML) | 2021 (ML) | 2020 (ML) | ||
|---|---|---|---|---|---|---|---|
| Water assets | |||||||
| Surface water | 571,799 | 760,358 | 711,934 | 494,810 | 411,314 | 362,293 | |
| Accessible storage | 517,134 | 698,934 | 666,380 | 448,341 | 364,584 | 316,226 | |
| Dead storage | 51,353 | 51,353 | 44,942 | 44,942 | 44,942 | 44,942 | |
| Rivers | 3,312 | 10,071 | 612 | 1,527 | 1,788 | 1,125 | |
| Groundwater | 14,500 | 14,500 | 14,624 | 14,624 | 14,624 | 14,624 | |
| Water table aquifer | 14,500 | 14,500 | 14,624 | 14,624 | 14,624 | 14,624 | |
| Total water assets | 586,299 | 774,858 | 726,558 | 509,434 | 425,938 | 376,917 | |
| Water liabilities | |||||||
| Surface water liability | 75,000 | 150,000 | 150,000 | 75,000 | 0 | 0 | |
| Surface water carryover | 75,000 | 150,000 | 150,000 | 75,000 | 0 | 0 | |
| Groundwater liability | 0 | 0 | 0 | 0 | 0 | 0 | |
| Groundwater carryover | 0 | 0 | 0 | 0 | 0 | 0 | |
| Total water liabilities | 75,000 | 150,000 | 150,000 | 75,000 | 0 | 0 | |
| Net water assets | |||||||
| Net surface water assets | 496,799 | 610,358 | 561,934 | 419,810 | 411,314 | 362,293 | |
| Opening net surface water assets | 610,358 | 561,934 | 419,810 | 411,314 | 362,293 | 483,104 | |
| Change in net surface water assets | (113,559) | 48,424 | 142,124 | 8,496 | 49,021 | (120,811) | |
| Closing net surface water assets | 496,799 | 610,358 | 561,934 | 419,810 | 411,314 | 362,293 | |
| Net groundwater assets | 14,500 | 14,500 | 14,624 | 14,624 | 14,624 | 14,624 | |
| Opening net groundwater assets | 14,500 | 14,624 | 14,624 | 14,624 | 14,624 | 14,624 | |
| Change in net groundwater assets | 0 | (124) | 0 | 0 | 0 | 0 | |
| Closing net groundwater assets | 14,500 | 14,500 | 14,624 | 14,624 | 14,624 | 14,624 | |
| Total closing net water assets | 511,299 | 624,858 | 576,558 | 434,434 | 425,938 | 376,917 | |
| Total change in net water assets | (113,559) | 48,300 | 142,124 | 8,496 | 49,021 | (120,811) | |
Note: quantification approaches used to derive each item volume are provided in the Methods