


Fitzroy: Supporting information
For the water account period 1 July 2024 to 30 June 2025
- Rainfall in the Fitzroy region during 2024–25 was slightly above average, though runoff remained below the long-term average.
- Total storage volume in the Fitzroy region decreased by 20 percentage points during the reporting period, finishing at 33.2% full on 30 June 2025.
- Approximately 70% of the surface water and groundwater resources in the Fitzroy region were taken, mainly for surface water diversions.
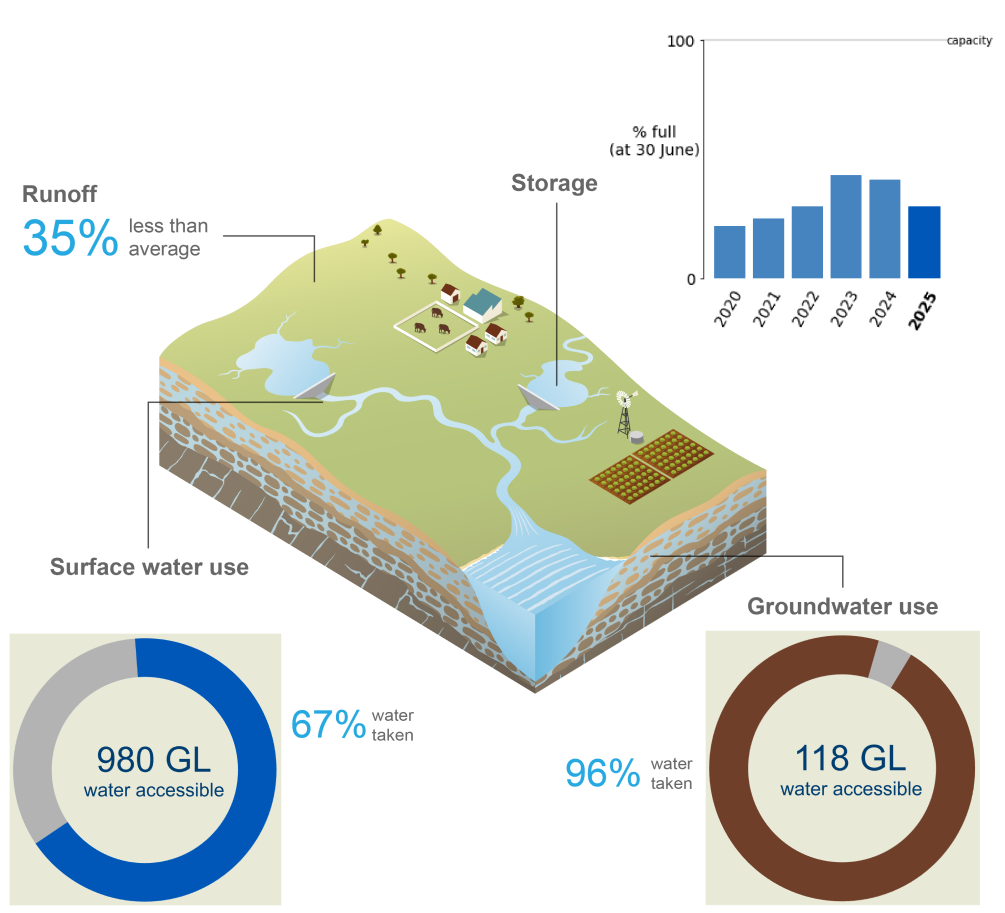
This section provides a detailed breakdown of water assets, liabilities, flows, availability, and use in the Fitzroy region over the past six water accounting periods, outlining where water is stored and how it is used across the region.
For further information, scroll down this page or click on the links below:
Water assets
- Total water assets in the Fitzroy region on 30 June 2025 were 586 GL, approximately 25% lower than the previous reporting period, entirely due to decreases in surface water assets.
- Approximately 95% of the region’s water assets were held in surface water storages, while groundwater aquifers accounted for about 2% of total water assets. The remaining volume was contained in rivers.
- A detailed breakdown of water assets in the Fitzroy region is available in the Statement of Water Assets and Water Liabilities.
Surface water assets
| Surface water | 2025 | 2024 | 2023 | 2022 | 2021 | 2020 |
| Bedford Weir | 15,865 | 15,746 | 15,892 | 15,875 | 15,791 | 14,519 |
| Bingegang Weir | 6,877 | 5,208 | 4,797 | 6,764 | 3,964 | 3,260 |
| Callide | 21,187 | 21,091 | 27,093 | 31,107 | 28,450 | 39,719 |
| Fairbairn | 277,158 | 462,033 | 504,169 | 268,034 | 203,746 | 143,528 |
| Fitzroy Barrage | 59,500 | 58,552 | 56,999 | 59,844 | 56,502 | 58,389 |
| Glebe Weir | 17,518 | 17,574 | 17,065 | 17,495 | 17,471 | 17,456 |
| Gyranda Weir | 14,635 | 14,437 | 11,136 | 14,659 | 10,052 | 7,727 |
| Kroombit | 67 | 107 | 98 | 93 | 64 | 144 |
| Mount Morgan No.7 | 2,576 | 2,613 | 1,044 | 556 | 135 | 608 |
| Moura Offstream Storage | 2,480 | 2,572 | 2,347 | 2,674 | 2,527 | 2,416 |
| Moura Weir | 6,824 | 6,696 | 4,254 | 7,206 | 6,906 | 6,362 |
| Neville Hewett Weir | 9,995 | 9,721 | 8,443 | 10,307 | 9,056 | 8,722 |
| Rookwood Weir | 68,654 | 67,758 | - | - | - | - |
| Tartrus Weir | 9,651 | 10,679 | 8,987 | 9,604 | 5,892 | 9,309 |
| Theodore Weir | 4,147 | 4,147 | 4,056 | 4,123 | 4,028 | 4,067 |
| Accessible total | 517,134 | 698,934 | 666,380 | 448,341 | 364,584 | 316,226 |
| Dead storage | 51,353 | 51,353 | 44,942 | 44,942 | 44,942 | 44,942 |
| Total storage | 568,487 | 750,287 | 711,322 | 493,283 | 409,526 | 361,168 |
| Total capacity | 1,714,464 | 1,714,464 | 1,640,139 | 1,640,139 | 1,640,139 | 1,640,139 |
| % Full | 33.2% | 43.8% | 43.4% | 30.1% | 25.0% | 22.0% |
- The total storage volume in the Fitzroy region decreased by 20.1 percentage points during 2024–25, finishing at 33.2% full on 30 June 2025.
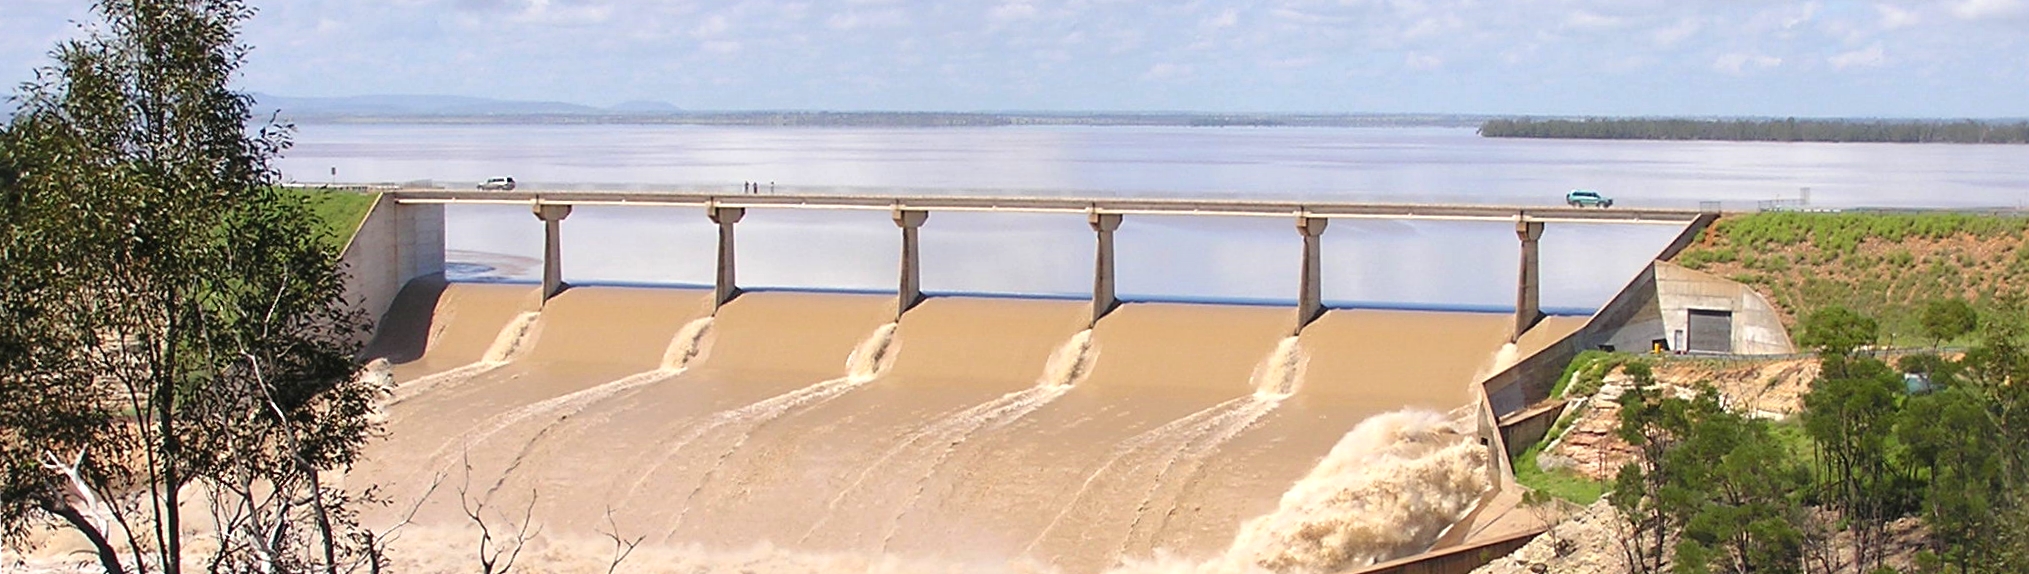
- Lake Maraboon, formed by Fairbairn Dam, accounts for approximately 75% of the region’s total surface water storage.
- Construction of Rookwood Weir was completed in late 2023, increasing the region’s total storage capacity from 1,640 GL to 1,714.5 GL.
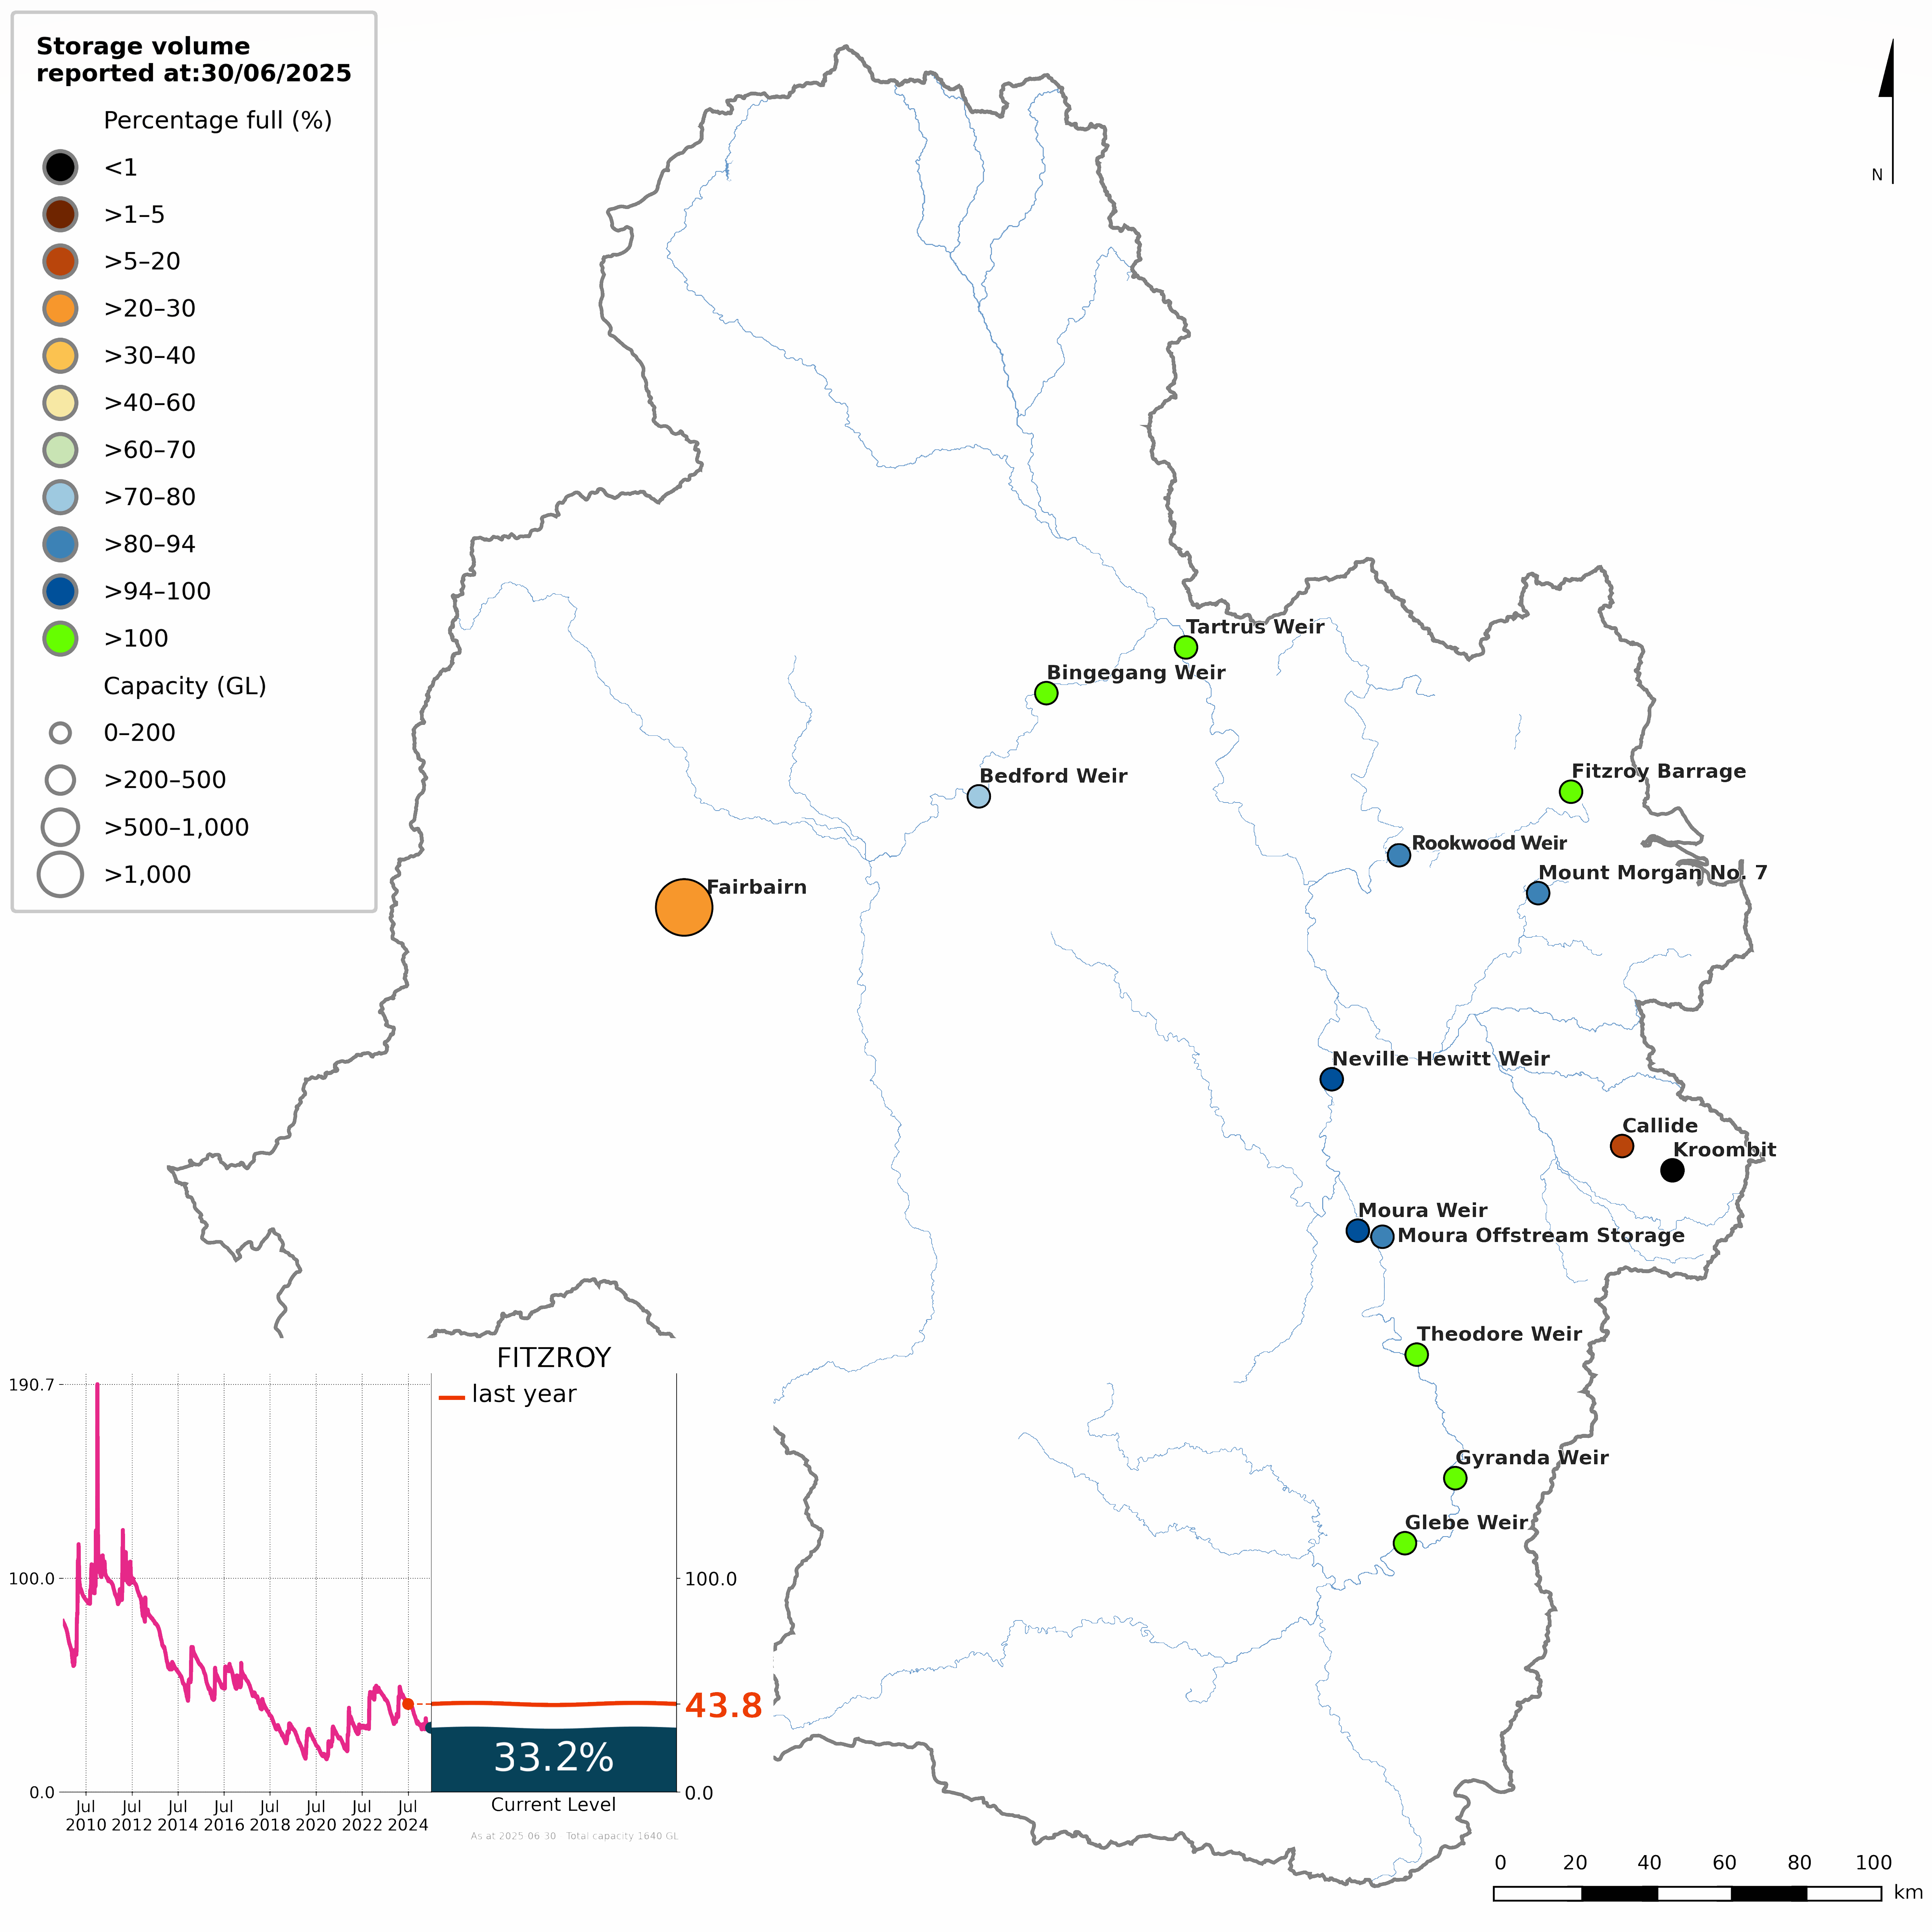
Figure S1 Percentage-full volume on 30 June 2025 for each storage and total storage volume since July 2009 (inset)
- The total storage volume in the Fitzroy region began the 2024–25 year approximately 45% full, slightly higher than the previous opening level, and the highest since the 2016–17 reporting period.
- During July, storage levels declined steadily, before unseasonable rainfall in mid-August generated monthly totals in excess of 100 mm in parts of the east, resulting in a slight increase in storage volumes.
- Following the August rainfall, storage levels declined through spring, falling to approximately 30% full towards the end of November.
- Storage levels stabilised through late November and December, fluctuating between 30% and 35% full, with intermittent thunderstorm activity supporting inflows.
- In late January, storage levels reached their lowest point of the reporting period, briefly dropping below 30% full, before increasing again in early February as an active monsoonal trough produced up to 200 mm of rainfall across the region.
- Although rainfall was above average in March, streamflows across the region responded poorly, resulting in storage levels remaining below 30% for much of the month.
- Widespread rainfall associated with an inland trough and moist onshore flow in late March and early April led to a short-lived increase in storage levels, which remained below 35% full, before declining again through to the end of the reporting period.
- By 30 June 2025, the total storage volume in the Fitzroy region was 33.2% full, representing a decrease of 20 percentage points over the reporting year.
- Fairbairn Reservoir, the largest storage in the region, began the year at 37% full and ended at 22% full, a decrease of a little under 40% in storage volume.
- More detailed information on individual storages in the Fitzroy region is available on the Bureau of Meteorology’s Water Information Dashboard.
Water liabilities
- Water liabilities in the Fitzroy region refer to the volume of allocation remaining on licence entitlements at the end of the reporting period (30 June).
- In the Fitzroy region, most water supply licences align with the water year (1 July–30 June); however, licences in the Dawson Valley Water Management Area operate on a different water year (1 October–30 September).
- A more detailed description of water allocations in the Fitzroy region is provided in the Water use section.
Surface water liabilities
| Description | 2025 | 2024 | 2023 | 2022 | 2021 | 2020 | |
| Opening balance at 01 July | 150,000 | 150,000 | 75,000 | 0 | 0 | 0 | |
| add | Allocations | 451,956 | 390,263 | 390,263 | 386,526 | 303,054 | 308,379 |
| less | Allocated diversions | 276,110 | 281,085 | 202,604 | 229,835 | 167,811 | 217,518 |
| less | Adjustments and forfeitures | 250,846 | 109,178 | 112,659 | 81,691 | 135,243 | 90,861 |
| Closing balance at 30 June | 75,000 | 150,000 | 150,000 | 75,000 | 0 | 0 | |
- Surface water allocations in the Fitzroy region during 2024–25 were 452 GL, with an additional 150 GL of water carried over from the previous year.
- The increase in surface water allocations was primarily due to the commencement of the Rookwood Weir Water Supply Scheme, which began operations on 22 November 2023.
- Approximately 45% (276 GL) of the total surface water volume accessible for take was diverted during the reporting year, slightly lower than the previous reporting period.
- Around 251 GL of water was forfeited at the end of the reporting year in accordance with licence conditions, resulting in a closing balance of 75 GL on 30 June 2025.
Groundwater liabilities
| Description | 2025 | 2024 | 2023 | 2022 | 2021 | 2020 | |
| Opening balance at 01 July | 0 | 0 | 0 | 0 | 0 | 0 | |
| add | Allocations | 13,491 | 14,500 | 14,500 | 14,500 | 15,009 | 15,294 |
| less | Allocated extractions | 8,479 | 9,904 | 7,152 | 7,211 | 10,268 | 11,545 |
| less | Adjustments and forfeitures | 5,012 | 4,596 | 7,348 | 7,289 | 4,741 | 3,749 |
| Closing balance at 30 June | 0 | 0 | 0 | 0 | 0 | 0 | |
- Groundwater allocations in the Fitzroy region during 2024–25 were slightly greater than 13 GL, with no carryover recorded at the start or end of the reporting period.
- Approximately 8 GL of the total groundwater volume accessible for take was extracted during the reporting year, lower than the previous reporting period.
- The remaining 5 GL of allocated groundwater was forfeited at the end of the reporting year in accordance with licence conditions.
Water flows
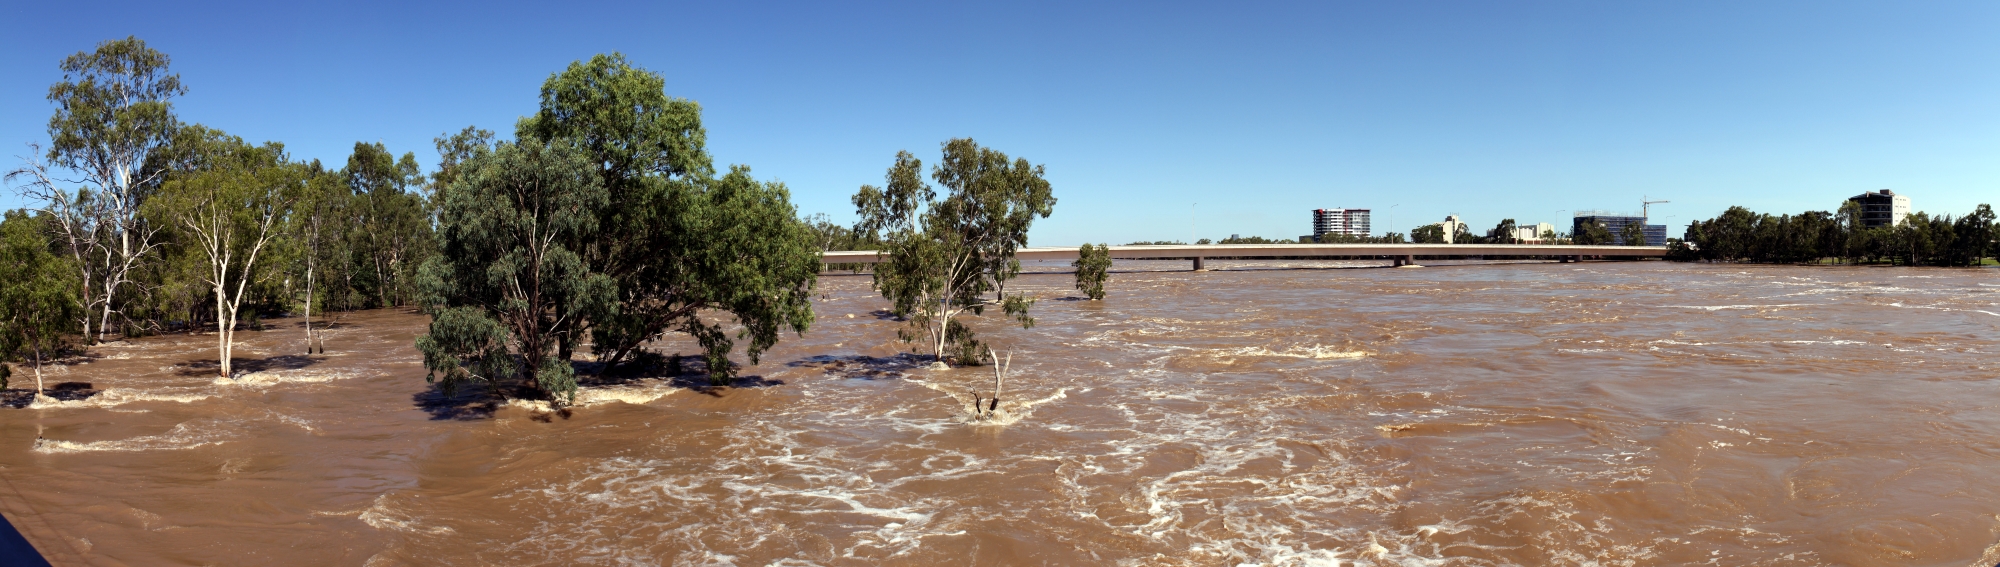
- Water flows in the Fitzroy region describe the movement of water between surface water and groundwater stores.
- A summary of total inflows and outflows for each water store is provided below.
- For a detailed breakdown of inflows and outflows in the Fitzroy region, refer to the Statement of Changes in Water Assets and Water Liabilities.
| Water inflows | 2025 | 2024 | 2023 | 2022 | 2021 | 2020 |
| Surface water inflows | 4,597,376 | 2,927,119 | 4,423,195 | 3,322,129 | 1,161,190 | 3,106,886 |
| Groundwater inflows | 1,138,734 | 1,006,739 | 1,135,807 | 1,136,117 | 455,159 | 857,380 |
| Total water inflows | 5,736,110 | 3,933,858 | 5,559,002 | 4,458,246 | 1,616,349 | 3,964,266 |
- Total water inflows to the Fitzroy region during 2024–25 were 5,736 GL, approximately 45% higher than the previous reporting period, primarily due to increased surface water inflows across the region.
- Surface water inflows contributed around 80% (4,597 GL) of total inflows, with runoff accounting for a little over 90% of surface water inflows.
- Runoff into the region’s surface water storages was 35% below the long-term average of 6,526 GL (based on area-averaged modelled data since July 1971).
- Groundwater inflows made up the remaining 20% (1,139 GL) of total inflows, entirely from recharge from surface water.
| Water outflows | 2025 | 2024 | 2023 | 2022 | 2021 | 2020 |
| Surface water outflows | 6,561,225 | 4,261,263 | 5,810,356 | 5,978,567 | 1,942,648 | 4,881,341 |
| Groundwater outflows | 112,910 | 102,388 | 97,606 | 105,508 | 107,141 | 105,888 |
| Total water outflows | 6,674,135 | 4,363,651 | 5,907,962 | 6,084,075 | 2,049,789 | 4,987,229 |
- Total water outflows from the Fitzroy region during 2024–25 were 6,674 GL, approximately 50% higher than the previous reporting period, primarily due to increased surface water outflows across the region.
- Surface water outflows accounted for more than 98% (6,561 GL) of total outflows, mostly from outflows to sea and recharge to groundwater, which together contributed around 80% of total surface water outflows.
- Outflows to sea were 30% below the long-term average of 5,880.0 GL (based on area-averaged modelled data since July 1971), corresponding to reduced runoff across the region.
- Groundwater outflows made up the remaining volume (113 GL) of total outflows, of which approximately 90% was associated with non-allocated extractions to various users.
Water availability
| Surface water | 2025 | 2024 | 2023 | 2022 | 2021 | 2020 |
| Water availability | 5,180,807 | 3,509,412 | 4,782,185 | 3,622,260 | 1,447,465 | 3,470,073 |
| Water accessible | 979,748 | 937,725 | 773,439 | 789,303 | 640,078 | 631,342 |
| Water taken | 653,902 | 678,547 | 510,780 | 632,612 | 504,835 | 540,481 |
| % water accessible taken | 67% | 72% | 66% | 80% | 79% | 86% |
- Surface water availability in the Fitzroy region during 2024–25 was the highest since the 2016–17 reporting period, and 50% higher than the previous year, reflecting the increase in runoff across the region.
- Changes in water availability across the region are strongly influenced by runoff. Generally, when runoff increases or decreases, water availability responds in a similar way.
- Surface water accessible for take increased slightly across the region compared to the previous reporting period, likely due to the commencement of the Rookwood Weir Water Supply Scheme on 22 November 2023.
- Water taken from surface water resources in the Fitzroy region was 654 GL, slightly lower than the previous reporting period, mostly associated with decreases in allocated and non-allocated diversions to irrigation users.
- Overall, approximately 65% of the surface water accessible for take in the Fitzroy region was taken during 2024–25, primarily for diversions to irrigation and agricultural users.
Water use
Consumptive use
- A total of 767 GL of water was taken from surface water and groundwater resources for consumptive use in the Fitzroy region during 2024–25, slightly lower than the previous reporting period.
| Surface water | 2025 | 2024 | 2023 | 2022 | 2021 | 2020 |
| Individual users | - | - | - | - | 332,648 | 318,592 |
| Agriculture users | 146,907 | 123,031 | 116,566 | 170,992 | - | - |
| Industrial users | 53,675 | 44,988 | 43,433 | 50,004 | 55,234 | 56,438 |
| Irrigation users | 413,877 | 466,489 | 311,578 | 361,477 | 105,781 | 153,632 |
| Mining users | 1,800 | 1,800 | 1,800 | 9,300 | - | - |
| Other users | 2,642 | 2,961 | 3,018 | 4,462 | 490 | 505 |
| Stock and domestic | 242 | 244 | 242 | 242 | - | - |
| Urban users | 34,759 | 39,034 | 34,143 | 36,135 | 10,682 | 11,314 |
| Total | 653,902 | 678,547 | 510,780 | 632,612 | 504,835 | 540,481 |
- Surface water diversions across the Fitzroy region during 2024–25 were 654 GL, slightly lower than the previous reporting period, mainly due to decreased diversions to irrigation users.
- Approximately 65% of surface water diversions were to irrigation users, while agricultural users made up a further 20%.
- The remaining volume of surface water diversions was largely distributed to industrial and urban users, while stock and domestic, mining, and other users collectively accounted for less than 1% of total diversions.
- Non-allocated surface water diversions contributed around 58% of total surface water diversions, with the remaining volume associated with allocated diversions within water supply schemes.
| Groundwater | 2025 | 2024 | 2023 | 2022 | 2021 | 2020 |
| Individual users | - | - | - | - | 44,585 | 41,663 |
| Agriculture users | 9,145 | 5,661 | 5,379 | 9,395 | - | - |
| Industrial users | 27,182 | 26,641 | 27,176 | 26,673 | - | - |
| Irrigation users | 59,510 | 55,806 | 50,881 | 53,503 | 59,479 | 61,174 |
| Mining users | 5,617 | 5,617 | 5,617 | 6,992 | - | - |
| Other users | 8,520 | 5,116 | 5,081 | 5,624 | - | - |
| Stock and domestic | 1,380 | 1,356 | 1,359 | 1,383 | - | - |
| Urban users | 1,556 | 2,191 | 2,113 | 1,938 | 3,077 | 3,051 |
| Total | 112,910 | 102,388 | 97,606 | 105,508 | 107,141 | 105,888 |
- Groundwater extractions across the Fitzroy region during 2024–25 were 113 GL, approximately 10% higher than the previous reporting period, and the highest since 2016–17, when groundwater use data was first available for the region.
- Irrigation users accounted for approximately 55% of total extractions, while industrial users made up a further 25% of groundwater use.
- Around 16% of groundwater extractions were to agricultural and other users, with the remaining volume distributed across smaller user groups, including stock and domestic, mining, and urban users.
- Most groundwater extractions were for non-allocated purposes, mainly to irrigation and industrial users, with the remaining volume associated with allocated use.
Allocations and diversions
| Surface water | 2025 | 2024 | 2023 | 2022 | 2021 | 2020 |
| Individual users | ||||||
| Carryover | 150,000 | 150,000 | 75,000 | 0 | 0 | 0 |
| Allocated announcements | 451,956 | 390,263 | 390,263 | 386,526 | 303,054 | 308,379 |
| Allocated diversions | 276,110 | 281,085 | 202,604 | 229,835 | 167,811 | 217,518 |
| % used | 61% | 72% | 52% | 59% | 55% | 71% |
- Total surface water allocations in the Fitzroy region during 2024–25 were 452 GL, similar to the previous reporting period, with an additional 150 GL of water carried over from the previous year.
- Approximately 45% (276 GL) of surface water allocations were used during the reporting year, lower than the previous reporting period.
- In recent years, the volume of water diverted across the Fitzroy region has been influenced by seasonal conditions and the availability of water for irrigation users.
| Groundwater | 2025 | 2024 | 2023 | 2022 | 2021 | 2020 |
| Individual users | ||||||
| Carryover | 0 | 0 | 0 | 0 | 0 | 0 |
| Allocated announcements | 13,491 | 14,500 | 14,500 | 14,500 | 15,009 | 15,294 |
| Allocated extractions | 8,479 | 9,904 | 7,152 | 7,211 | 10,268 | 11,545 |
| % used | 63% | 68% | 49% | 50% | 68% | 75% |
- Total groundwater allocations in the Fitzroy region during 2024–25 were 14 GL, slightly lower than the previous reporting period, with no carryover recorded.
- Approximately 8 GL of groundwater allocations were used during the reporting year, slightly lower than the previous reporting period.
- Groundwater extractions in the Fitzroy region are primarily associated with non-allocated use, particularly for irrigation and industrial purposes.