


South East Queensland: Climate and water
For the water account period 1 July 2024 to 30 June 2025
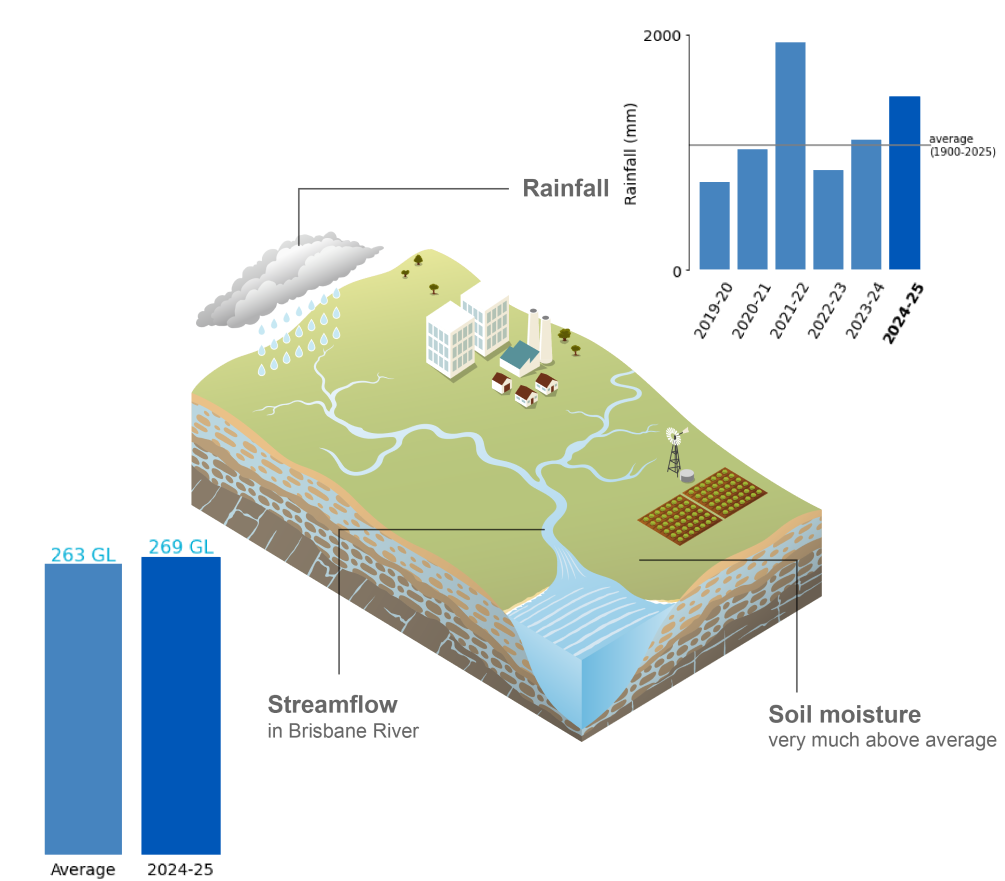
- South East Queensland region experienced well-above average rainfall during 2024–25, influenced by multiple heavy rainfall events including Tropical Cyclone Alfred.
- Soil moisture in the root zone (0–1 m depth) was very much above average across much of the region, reflecting the persistent wet conditions and high rainfall totals recorded throughout the year.
- Streamflows across the region were generally above average, with the Bremer, Logan, and North Maroochy rivers recording more than double their long-term annual averages, while flows in the Brisbane River upstream of Wivenhoe Dam remained close to average.
For further information on the climate and water conditions across the South East Queensland region during the current reporting period, scroll down this page or click on the links below:
About the region
- The South East Queensland region experiences a subtropical climate, characterised by hot, humid summers and mild to cool winters.
- Rainfall can occur throughout the year, although higher totals are more common during the northern wet season between October and April.
- Streamflows across the region generally reflect the seasonal variation in rainfall, with higher flows and storage inflows occurring during the wet season, while some rivers cease to flow during the drier months from May to September.
Climate conditions
Rainfall
Figure C1 Annual and monthly rainfall deciles for the South East Queensland region during the 2024–25 reporting period
- Total area-averaged rainfall across the South East Queensland region in 2024–25 was 1,471 mm, around 40% above the long-term average of 1,061 mm,
- From July to October, rainfall was about average. The exception was August which was above to very much above average, primarily due to a low-pressure system that combined with moist onshore flow to produce several days of intense rainfall.
- Several days of severe thunderstorm activity during the second half of November generated widespread rainfall contributing to a very much above average November rainfall.
- Two rain-bearing systems in December produced above-average rainfall in parts of the region, contributing to above-average summer rainfall.
- In early March, Tropical Cyclone Alfred and it's remnants brought widespread heavy to intense rainfall across the region. Areas of South East Queendsland received their highest on record decile for the month of March.
- Rainfall during May was average to above average across much of the region, before returning to an average June.
- Further information on Australia’s climate and water conditions during the 2024–25 reporting period can be found in the Financial Year Climate and Water Statement 2024–25.
Figure C2 Total monthly rainfall for the South East Queensland region during the 2024–25 reporting period, compared with the average and percentiles for the region
- Rainfall in November, December, and March exceeded the 90th percentile, reflecting the influence of severe thunderstorm activity in November and December, along with the impacts of Tropical Cyclone Alfred in March.
- August rainfall was well above average, ranking just below the 90th percentile.
- No month recorded rainfall below the 10th percentile, although February rainfall was substantially below average.
Actual evapotranspiration
Figure C3 Annual and monthly actual evapotranspiration deciles for the South East Queensland region during the 2024–25 reporting period
- Total area-averaged actual evapotranspiration was above average across most of the South East Queensland region during 2024–25, reflecting the generally wet conditions and sustained soil moisture throughout much of the year.
- In July, evapotranspiration was below average across much of the region, particularly around the upper reaches of the Mary and Brisbane river catchments, due to cool and dry winter conditions that limited vegetation growth and water availability.
- Following widespread rainfall in August, evapotranspiration increased, becoming average to above average across much of the region through to October, supported by near-average rainfall and gradually rising temperatures.
- Evapotranspiration increased further in November and became very much above average across the western two-thirds of the region during December and January, with the region receiving more than double the monthly rainfall average during this period, which evelvated soil moisture.
- Drier conditions and reduced rainfall in February caused a decline in evapotranspiration before returning to near-average levels across much of the region in March.
- Following near-average rainfall in May, evapotranspiration remained very much above average across much of the region.
- Although a slight decline was observed in June, above-average evapotranspiration persisted across much of the region.
Soil moisture
Figure C4 Annual and monthly soil moisture deciles for the South East Queensland region during the 2024–25 reporting period
- Total area-averaged soil moisture in the root zone (0–1 m depth) was very much above average across much of the South East Queensland region during 2024–25, reflecting the persistent wet conditions and high rainfall totals recorded throughout the year.
- In July, soil moisture was generally average across much of the region, as cool and dry winter conditions limited rainfall and surface water recharge.
- Following above-average rainfall in August, soil moisture increased across the northern, western, and southern parts of the region, but remained near average elsewhere. These conditions eased slightly in September but remained close to average, largely due to cooler temperatures which reduced evaporation.
- Widespread rainfall in November and December, led to an increase in soil moisture, particularly across the southern catchments, where parts of the Brisbane and Logan river systems recorded their highest December soil moisture on record.
- Drier conditions in February caused a decrease in soil moisture, with below-average levels emerging across the region. However, March soil moisture returned to average to above average following the rainfall events associated with Tropical Cyclone Alfred.
- By April, soil moisture had become very much above average across much of the region and remained above average through May.
- Although a slight decline was observed in June, soil moisture levels remained predominantly above average, reflecting the strong recharge earlier in the year along with the seasonally lower evapotranspiration typical of early winter.
- Further information on soil moisture conditions across the South East Queensland region during the 2024–25 reporting period is available on the Australian Water Outlook.
Streamflow responses
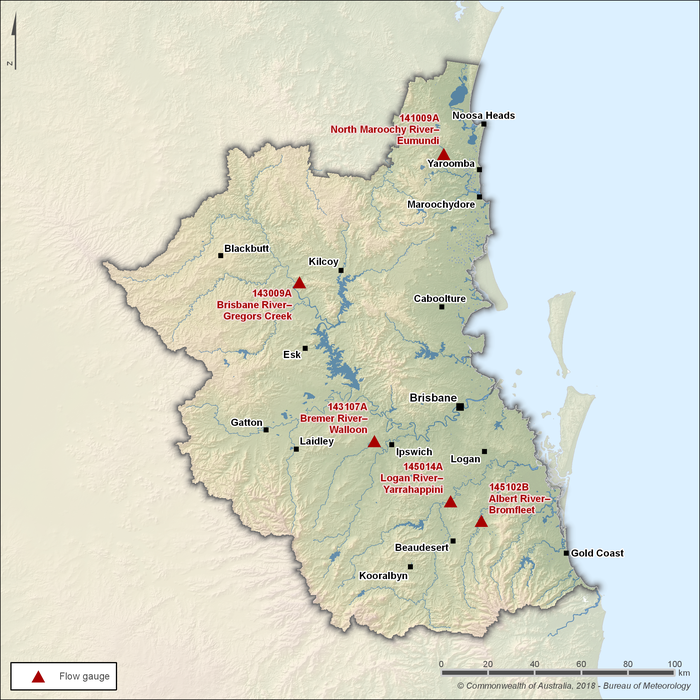
Figure C5 Key flow gauging stations along the main rivers within the South East Queensland region
- There are five main river systems within the South East Queensland region: the Albert, Bremer, Brisbane, Logan, and Maroochy rivers. Of these, the Brisbane and Logan rivers are the primary contributors to regional streamflow.
- The Brisbane River, regulated by Wivenhoe Dam, flows through the city of Brisbane and is highly susceptible to major flooding during extreme rainfall events. Significant flood events have occurred in the past, including in 1974, 2011, and most recently in 2022.
- Seasonal streamflow patterns across the region are represented by five key flow gauging stations, shown in Figure C5.
- Flows in the Albert, Brisbane, Logan, and Maroochy rivers generally exhibit perennial behaviour, while the Bremer River may intermittently cease to flow, particularly during the drier months from May to September.
Figure C6 Total monthly flow for major rivers in the South East Queensland region during the 2024–25 reporting period, compared with the average and percentiles for each gauging station
- Streamflows in the South East Queensland region during 2024–25 were generally above average, reflecting the widespread and persistent rainfall that occurred throughout the year.
- Flows in the Albert, Bremer, Logan, and North Maroochy rivers were well above average, with the Bremer, Logan, and North Maroochy rivers recording more than double their long-term annual averages.
- The Brisbane River at Gregors Creek (Station 143009A), upstream of Wivenhoe Dam, recorded 269 GL, slightly above the long-term average of 263 GL. In comparison, the Bremer River at Walloon (Station 143107A), which joins the Brisbane River downstream of Wivenhoe Dam, recorded annual flows of more than double above its long-term average of 79 GL.
- In response a wet November and December, streamflows across all sites peaked well above the 90th percentile, before returning to near-average levels by January.
- Exceptionally high flows occurred in March, with all sites except the Brisbane River upstream of Wivenhoe Dam peaking well above the 90th percentile following the heavy and prolonged rainfall associated with Tropical Cyclone Alfred.
- Although the Brisbane River upstream of Wivenhoe Dam showed little response to Tropical Cyclone Alfred, streamflows at Gregors Creek instead peaked above the 90th percentile in April, following above-average rainfall.
- By late autumn, flows had fallen below average in the Bremer, Brisbane, and Logan river catchments, but remained close to average in the Albert River at Bromfleet (Station 145102B) and above average in the North Maroochy River at Eumundi (Station 141009A).
- With limited rainfall in June, streamflows were average to below average across all sites by the end of the reporting period.